Author name / JHMTR 00 (2013) 000–000 31
31
1. Introduction
In recent years, rising energy demand, national energy security, and strengthening environmental regulations have been the most important factors for implementing sustainable, efficient and economically viable energy-conversion technologies. Solar energy as a kind of clean and accessible energy is considered as one of the most important ways of providing energy using efficient technologies. One of the most promising solar energy conversion technologies is the CCHP system. Trigeneration power plants have grown dramatically in recent years thanks to advances such as increasing energy efficiency, reducing greenhouse emissions, and economic benefits [1]. CCHP technology was first used in large dimensions, such as industrial and commercial buildings. In recent years, the smaller dimensions of CCHP named micro combined cooling, heating,
and power (mCCHP) system have been used in hotels, offices, and hospitals [2]. Normally, the energy-conversion efficiency is greatly increased using combined cycle technology. The efficiency of power plants which only produce electrical power is around 40% while using CCHP systems, efficiencies can be increased up to 90% [3].
Many studies have focused on system design, performance, and optimization of CCHP systems. These researches showed that CCHP can play a significant role in reducing greenhouse gas emissions and achieving high energy-conversion efficiencies [4]–[6]. Brandoni C. et al. [7] simulated hybrid renewable microgeneration systems for different electricity prices. Their results showed that the hybrid system becomes competitive with the PV technology when the level of solar radiation is high. Chicco G. et al. [8] presented a simulation model for analyzing energy flow in mCCHP
Click here, type the title of your paper, Capitalize first letter of each words
First Author
a, Second Author
b,*a
First affiliation, Address, City and Postcode, Country
b
Second affiliation, Address, City and Postcode, Country
Journal of Solar Energy Research Vol 4 No 1(2019) 31-39
Journal of Solar Energy Research (JSER)
Journal homepage: jser.ir
A B S T R A C T
Click here and insert your abstract text. Click here and insert your abstract text. Click here and insert your abstract text. Click here and insert your abstract text. Click here and insert your abstract text. Click here and insert your abstract text. Click here and insert your abstract text. Click here and insert your abstract text. Click here and insert your abstract text. Click here and insert your abstract text. Click here and insert your abstract text. Click here and insert your abstract text. Click here and insert your abstract text. Click here and insert your abstract text. Click here and insert your abstract text. Click here and insert your abstract text. Click here and insert your abstract text. Click here and insert your abstract text. Click here and insert your abstract text. Click here and insert your abstract text. Click here and insert your abstract text Click here and insert your abstract text Click here and insert your abstract text Click here and insert your abstract text Click here and insert your abstract text Click here and insert your abstract text Click here and insert your abst
© 2013Published by University of Tehran Press. All rights reserved.
ARTICLE INFO Received:
Received in revised form: Accepted:
Available online:
Keywords:
Type 3-6 keywords here,
separated by semicolons ;
Energy and Exergy Efficiency Improvement of a Solar Driven Trigeneration
System Using Particle Swarm Optimization Algorithm
R. Moltames
a*, B. Azizimehr
b, E. Assareh
ba
Energy Engineering Department, Energy Systems Engineering, Sharif University of Technology, Tehran, Iran; *Email: [email protected]
b
Mechanical Engineering Department, Dezful Branch, Islamic Azad University, Dezful, Iran
Journal of Solar Energy Research (JSER)
Journal homepage: www.jser.ut.ac.ir
A B S T R A C T
In this paper, a solar micro Combined Cooling, Heating, and Power (mCCHP) system based on ORC cycle is thermodynamically and economically analyzed. The model of conservation of mass, energy, and linear momentum is used to energy analysis of the system. On the other hand, a model based on the first and the second laws of the thermodynamics is used to exergy analysis of the system. Sensitivity analysis of the inlet temperature, back turbine pressure, turbine inlet pressure, and evaporator temperature are considered as the decision variables of the optimization algorithm. The performance of the mCCHP system is determined by some important indices including energy efficiency, exergy efficiency, and investment cost rate. Hence, the three mentioned indices are considered as the objective functions of the optimization. The Particle swarm optimization (PSO) algorithm is used for both single-objective and multi-single-objective optimization of the system and its code is developed in MATLAB software. The implementation of the multi-objective optimization using PSO for R123 working fluid improves 27.65% thermal efficiency, 27.46% exergy efficiency and reduces 11.98% of the system cost rate.
© 2019 Published by University of Tehran Press. All rights reserved.
ARTICLE INFO
Received: 16 Jan 2019 Received in revised form: 12 Feb 2019
Accepted: 05 March 2019 Available online: 10 May 2019
Keywords:
32 systems. Wu et al. [9] simulated a micro-CCHP system with thermal management controller. Their results indicate that the system can produce 17.7 kW heating power, 6.5 kW cooling output and 16 kW electric power simultaneously. Ion V. et al. [10] evaluated the effects of using a combined mCCHP system based on sterling engine and solar collectors on reducing greenhouse gas emissions and fuel consumption. P. Arnavat, M. et al. [11] developed a simple trigeneration plant model for designing, optimizing and simulating small-medium scale plants including a realistic biomass gasification model. Their model enables the outputs of the plant to be evaluated and calculated for different types of biomass, operating conditions, and configurations. Q. Wu et al. [12] designed and evaluated a CCHP based micro-grid for an urban area. Furthermore, the possible cost and energy saving and the reduction of CO2 emissions were examined. A conceptual model of a smart energy management system for a residential building equipped with a CCHP system was proposed by F. Farmani et al. [13]. The results showed that the application of CCHP equipped with a smart controller could significantly reduce the operating cost. R. Jiang et al. [14] developed a thermodynamic model and analyzed the performance of an MW CCHP system integrated with a dehumidification system and showed that the thermodynamic performance of their proposed CCHP system is better than conventional CCHP systems.
In the present study, a novel solar micro CCHP system equipped with a storage tank based on ORC is simulated for sustainable energy supply in both summer and winter seasons, while the results are only evaluated for the summer season. The proposed system, for the first time in this paper, is optimized using PSO optimization algorithm and is employed for both single-objective and multi-objective optimizations for three working fluids (R123, R134a, and R245fa). The use of the PSO algorithm for single-objective and multi-objective optimization to solve unsophisticated problems reduces the model running time compared to the genetic algorithm. The combination of MATLAB and REFPROP software is used for system simulation. The NIST REFPROP is a computer program and an accurate database of thermophysical property models for a variety of industrially fluids and fluid mixtures.
2. Materials and Methods
2.1. System description and assumptions
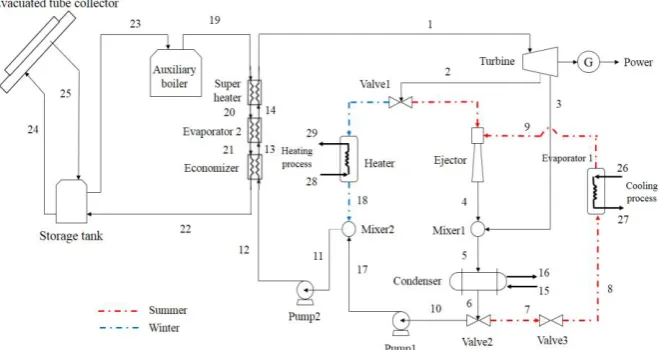
The detailed layout of the proposed system is shown in Fig. 1. As shown in the Fig.1, the system has three main subsystems. The CCHP system consists of three main subsystems: the vapor generator subsystem, the power generator subsystem, and the heating and cooling subsystem. The vapor generation system includes a solar collector and an auxiliary boiler. The second subsystem is the power generation unit, which includes a turbine and a generator. The third subsystem also includes the heating section in the cold seasons and the cooling section in the warm seasons. The high pressure and temperature vapor are generated using heat sources including solar energy and auxiliary boiler. This high pressure and temperature vapor is expanded through the turbine and produces electric power using the generator. In the warm seasons, one part of the turbine exhaust enters the supersonic nozzle of the ejector and the second part enters the mixer in point 4. The very high velocity of the vapor in the ejector inlet produces a high vacuum in the mixing chamber inlet and entrains secondary vapor into the chamber from the evaporator. In the cold seasons, the first part of the turbine exhaust as the stream 8, enters the heater and the second part enters the mixer1. The ejector outlet stream and the second part of the turbine exhaust are mixed in the mixer1 then the mixed stream enters the condenser in order to deliver heat to the ambient. Ejector modeling in this paper is based on a one-dimensional pressure model and its performance is evaluated by a coefficient named the entrainment ratio (𝜇). If the primary, secondary, and output pressure are known, the value of this ratio is calculated in an iterative solution, given by:
2 1, 4 , 2
( ) / ( ) 1
n m d h he is h is he
(1)
where ηn is the nozzle efficiency (=90%), ηm is the
mixing efficiency (=85%), and ηd is the diffuser
efficiency (=85%). The input data for simulating the mCCHP system is shown in Table 1.
2.2. Energy analysis
Author name / JHMTR 00 (2013) 000–000 33
33
Figure 1. Schematic diagram of the solar mCCHP system based on ORC equipped with a storage tank Table 1. The working data of the mCCHP system
Parameter Unit Values
Dead state temperature 15
Dead state pressure kPa 100
Turbine inlet pressure kPa 1000
Turbine inlet temperature 130
Turbine back pressure kPa 300
Ejector compression ratio - -
Turbine mass flow extraction ratio - 0.5
Turbine isentropic efficiency % 85
Evaporation temperature -
Evaporator 1 temperature difference -
Pump isentropic efficiency % 70
Cooling water inlet pressure kPa 300
Cooling water inlet temperature 15
Cooling water mass flow rate kg/s 0.4
Condenser temperature difference 10
Heater temperature difference 20
Heater outlet temperature 80
Superheater temperature difference 30
Approach temperature difference 15
Cooling load kW -
Heating load kW 11
Power kW 2.7
Electrical generator efficiency % 95
Auxiliary boiler efficiency % 90
Low heat value of fuel kJ/kg 50.654
Monthly average insolation, H Mj/m2day 7.99 (December)
Monthly averaged insolation clearness index, KT - 0.52 (December)
Tilt angle 37.4
Optical efficiency % 65.5
Coefficient W/m2K 1.4
Author name / JHMTR 00 (2013) 000–000 34
34
i e
m m
(2). . . .
e e i i
Q W m h m h
(3)where m is the mass flow rate (kg/s), .
Q is the heat rate (kW), W is the power (kW) and h is the enthalpy (kJ/kg). Subscripts i and e represent the inlet and exit streams for components. The turbine output power is calculated as follows:
1 1 2 2 3 3
,T S T
W m h m h m h (4) in which ηS,T is the turbine isentropic efficiency.
The power consumption of each pump is calculated according to the following equations [16], [17]:
1
1 10 10 17 10 / ,
p s p
W m P P (5)
2
2 11 11 12 11 / ,
p s p
W m P P (6) ηS,p1 and ηS,p2 are pump1 and pump2 isentropic
efficiencies, respectively. The energy efficiency of the system is calculated according to the input and output energy of the system, given by:
. 1 100 Gen Th NG NG ev c t W Q
A G m LHV
(7)
where ηTh is the thermal efficiency in percent, WGen
is the generator output power (kW), Q.ev1 is the evaporator output thermal power (kW), AC is the
surface area of solar the collector (m2), Gt is the
radiation on a tilted surface (W/m2), and LHV is the low heat value (kJ/kg). Where subscript NG represents the natural gas.
2.3. Energy analysis
Exergy is the maximum amount of work that a system can produce. The performance of a system and energy quality can be evaluated using exergy efficiency. Exergy efficiency is defined as the ratio of the output exergy to the cycle input exergy. The exergy input is taken as the energy change of the heat source, and the exergy output is considered as the total output exergy of the generator and the refrigeration cycle [18]. In this paper, the chemical exergy of materials, as well as potential energy and kinetic energy, are ignored. The exergy equations according to the first and second laws of thermodynamics are calculated as follows:
Q i i e e W D
i e
E
m e
m e E E (8)0 1 Q T E Q T
(9)W
E W (10)
where EQis the exergy rate of heat transfer (kW),
W
E is the work across the boundaries of the control volume (kW), and T is the temperature (C or K ). Subscript D represents the exergy destruction.
The exergy efficiency is calculated by the following equation:
. 1 . . 100
ev Gen E sun NG W E E E (11)
The exergy of the sun is determined by the following equation: 4 0 0 S 1 4 1 3 3
un t C
s s
T T
E G A
T T
(12)where Tsis the sun temperature (=6000K ) and .
NG
E is the specific exergy of natural gas which can be determined by:
LHV
NG NG NG
E m (13)
2.4. Exergoeconomic model
The cost balance is applied to economic analysis in which the cost rates of all output exergies are equal to the cost rates associated with the input exergies plus the investment cost, operating cost, and maintenance cost. The cost equations for each component are based on the heat and power received by that component according to the following equations:
. . . . .
, , , ,
e k W k Q k i k k
e i
C C C C C
(14). .
i
i i
C
c
X (15)where .
C is the cost rate ($/year), .
Z is the investment cost rate ($/year), and c is the cost per exergy unit ($/GJ). Subscripts i and e represent the entering and existing streams for the kth component. The equations for the investment cost of each component are shown in Table 2. The investment cost of the solar collector and the auxiliary boiler is considered to be 567$ per square meter and 28$ per kilowatt, respectively. It should be noted that the investment cost of the ejector, mixer, and the valves are ignored due to their small contribution in overall investment cost.
The investment cost rate for the kth component is calculated as follows:
. k Cl k C Z CRF t
(16)
where subscript CI represents the capital investment and CRF is the capital recovery factor which can be written as follows [18]:
1 1 1 N N i i CRF i (17)
35 operating hours of the system in a year (=7446 hours).
Table 2. The investment cost of each component of the mCCHP system
Component Cost
Heat exchanger [18]
0.78 130
0.093
CL HE
HE
A Z
Condenser [18]
.
177
CL
Cond s
Z
m
Pump [18]
0.71
.
3540
CL
Pump pump
Z
W
Storage tank [18]
0.506
4042
CL
ST ST
Z
V
Turbine [18]
10
2
. .
10 10
log 26259
14398log 0.1776 log
Cl Turb
Turb Turb
Z
W W
Generator [19]
0.95
.
60
CL
Elec Elec
Z
W
3. Verification
In order to validate the model presented in this paper, the simulation results of this paper for the summer season are compared with those of the Ref. [20]. For this purpose, exergy values of the system for flows 1 to 10 for R113 work fluid are shown in Table 3 in comparison with the exergy values presented in the Ref. [20], regardless of the optimal operating state.
Table 3. Comparison of the exergy results from the model presented in this paper (a) with Ref. [19](b)
Stream point Exergy (kJ/kg)
a b
1 51.38 52.37
2 29.71 30.33
3 8.72 9.24
4 9.45 8.00
5 9.12 8.45
6 0.17 0.20
7 0.17 0.20
8 -165.62 -163.50
9 -6.31 -13.01
10 0.17 0.20
4. Results and discussion
The values of system performance parameters including turbine output, pump consumption, thermal and exergy efficiency of the system are shown in Table 4. The effect of each of the decision variables including turbine input pressure, turbine input temperature, turbine output temperature and evaporator temperature in system performance are discussed below.
4.1. Effect of turbine input pressure
The effect of turbine input pressure changes on thermal efficiency and exergy efficiency of the mCCHP system for R123 working fluid is shown in Fig. 2. Under the same conditions, with an increase in turbine input pressure from 900 to 1100 kPa, thermal efficiency and exergy efficiency increase by 10.33% and 10.29%, respectively, due to the decrement of input energy of the system.
Figure 2. Effect of turbine inlet pressure changes on thermal efficiency and exergy efficiency 4.2. Effect of turbine input temperature
The effect of turbine input temperature changes on thermal efficiency and exergy efficiency is shown in Fig. 3. As shown in the figure, the increase in turbine inlet temperature leads to an increment in both thermal and exergy efficiencies. Under the same conditions, with an increase in turbine input temperature from 120 to 140 ℃, thermal efficiency and exergy efficiency increase by 0.26% and 0.30%, respectively, due to the slight decrement in energy input to the system.
Figure 3. Effect of turbine inlet temperature changes on thermal efficiency and exergy
efficiency 4.3. Effect of turbine output pressure
36 respectively, due to increase in the amount of wasted exergy.
Figure 4. Effect of turbine turbine outlet pressure changes on thermal efficiency and exergy
efficiency 4.4. Effect of evaporator temperature
The effect of evaporator temperature changes on thermal efficiency and exergy efficiency is shown in Fig. 5. Because there is no change in the input energy of the system, that is, solar energy and natural gas consumption, so both of the two efficiencies remain constant with the evaporator temperature changing.
Figure 5. Effect of evaporator temperature changes on thermal efficiency and exergy efficiency
Table 4. mCCHP cycle performance
Parameter Unit Value
Turbine output energy J/kg 2742.5 Pumps energy consumption J/kg 71.39
Thermal efficiency % 24.81
Exergy efficiency % 9.94
5. Optimization
In this section, single-objective and multi-objective optimization of the mCCHP system is evaluated. In many cases, the energy system is optimized for more than one purpose, which these purposes are often in contradiction [20]. In this study, thermal efficiency, exergy efficiency, and cost rate are considered as the objective functions of the optimization, while turbine input pressure, turbine input temperature, turbine output pressure,
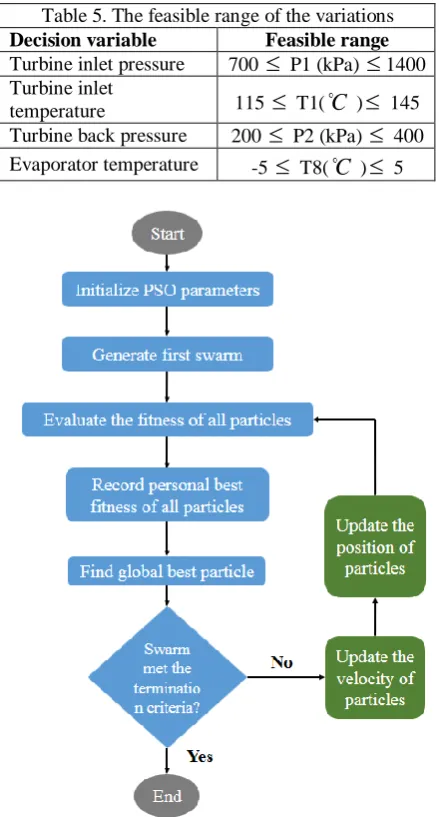
and evaporator temperature are considered as the decision variables. The feasible range of decision variables for the single-objective and multi-objective optimization is shown in Table 5. In order to optimize the combined system, The PSO algorithm is used and its code is developed in MATLAB software. PSO is a population-based stochastic optimization technique. This method is very simple, easily completed and it needs fewer parameters, which made it fully developed. The standard flowchart of the PSO algorithm used in this paper is shown in Fig. 6.
Table 5. The feasible range of the variations
Decision variable Feasible range
Turbine inlet pressure 700
P1 (kPa)
1400 Turbine inlettemperature 115
T1(C
)
145 Turbine back pressure 200
P2 (kPa)
400 Evaporator temperature -5
T8(C
)
5Figure 6. Scheme for particle swarm optimization algorithm used in the present work 5.1. Single-objective optimization
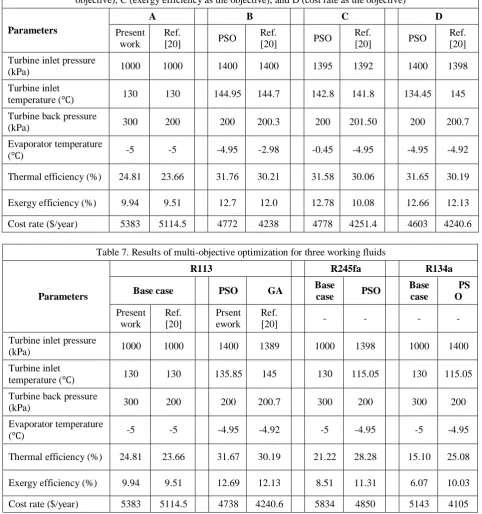
37 to the base case. On the other hand, in exergy efficiency optimization mode (maximum exergy efficiency), thermal and exergy efficiencies increase by 27.28% and 25.57%, respectively, while the cost rate decreases by 11.24%, compared to the base case. As the last mode, in the case that the minimum cost rate of the system is considered as the objective of the optimization, thermal and exergy efficiencies increase by 27.56% and 27.36%, respectively, while the cost rate decreases by 14.5%, compared to the base case.
5.2. Multi-objective optimization
In multi-objective optimization, all three parameters including thermal efficiency, exergy efficiency, and cost rate are simultaneously optimized. A low-efficiency energy system is usually cheap, while the cost of an efficient system is relatively high. So the objective functions usually act in the opposite direction in energy systems. For the mCCHP system studied in this paper, the total objective function of the multi-objective optimization is a combination of the three parameters studied in a single-objective optimization mode, which is written as follows:
1 1 2 8
,
1 , 2 , 3
.
, , ,
1 p sum tot sum tot sum
Max F P T P T
W W W C
(18)
where W1 is the weight of the thermal
efficiency, W2 is the weight of the exergy
efficiency, and W3 is the weight of the cost rate in
the objective function. All three objective functions including thermal efficiency, exergy efficiency, and cost rate are considered to have the same contribution in the total objective function. In other words, all three weights are considered to be equal to 1/3. Constraints on the weights are written as follows:
1 2 3
0W W W, , 1 (19)
1 2 3 1
W W W (20)
The results obtained for the multi-objective optimization are shown in Table 7. As shown in Table 7, implementation of the multi-objective optimization for R123 fluid improves 27.65% thermal efficiency, 27.46% exergy efficiency and reduces 11.98% of system cost rate. These values for the same fluid in Ref. [20] are 27.59%, 27.54%, and 11.23%, respectively. Multi-objective optimization for the R245fa working fluid also improves thermal efficiency by 33.27%, exergy efficiency by 32.9%, and reduces cost rate by
16.86%. These values for R134a are also 66.9%, 65.23%, and 20.18%, respectively.
6. Conclusion
In this paper, an energy model based on the conservation of mass, energy, and linear momentum and a model based on the first and second laws of thermodynamics were used for technical and exergoeconomic analysis of a micro CCHP system. For the first time in this paper, the PSO algorithm was performed for single-objective and multi-objective optimization of the combined system for three working fluids (R123, R134a, and R245fa). The main results obtained from this study can be summarized as follows:
For R123 working fluid:
For the base case, the thermal and exergy efficiencies of the system are calculated as 24.81% and 9.94%, respectively.
Under the same conditions, with an increase in turbine input pressure from 900 to 1100 kPa, thermal efficiency and exergy efficiency increase by 10.33% and 10.29%, respectively.
With increasing turbine input temperature, both energy and exergy efficiencies increase. Under the same conditions, with an increase in turbine input temperature from 120 to 140 ℃, thermal efficiency and exergy efficiency increase by 0.26% and 0.30%, respectively.
The thermal and exergy efficiencies decrease with increasing turbine output pressure. Under the same conditions, with increasing turbine output pressures from 250 to 350 kPa, thermal efficiency and exergy efficiency are reduced by 7.91% and 7.82% respectively.
Both thermal and exergy efficiencies remain constant with the evaporator temperature changing.
In multi-objective optimization mode, thermal efficiency, exergy efficiency, and cost rate are calculated as 31.67%, 12.68% and 4738 $/year, respectively.
For R134a working fluid:
In multi-objective optimization mode, thermal efficiency, exergy efficiency, and cost rates are calculated as 28.87%, 11.31%, and 4850 $/year, respectively.
For R245fa working fluid:
Author name / JHMTR 00 (2013) 000–000 38
38
Table 6. Results obtained for the variables and objective functions, A (base case), B (thermal efficiency as the objective), C (exergy efficiency as the objective), and D (cost rate as the objective)
Parameters
A B C D
Present work
Ref.
[20] PSO
Ref.
[20] PSO
Ref.
[20] PSO
Ref. [20] Turbine inlet pressure
(kPa) 1000 1000 1400 1400 1395 1392 1400 1398
Turbine inlet
temperature (℃) 130 130 144.95 144.7 142.8 141.8 134.45 145 Turbine back pressure
(kPa) 300 200 200 200.3 200 201.50 200 200.7
Evaporator temperature
(℃) -5 -5 -4.95 -2.98 -0.45 -4.95 -4.95 -4.92
Thermal efficiency (%) 24.81 23.66 31.76 30.21 31.58 30.06 31.65 30.19
Exergy efficiency (%) 9.94 9.51 12.7 12.0 12.78 10.08 12.66 12.13 Cost rate ($/year) 5383 5114.5 4772 4238 4778 4251.4 4603 4240.6
Table 7. Results of multi-objective optimization for three working fluids
Parameters
R113 R245fa R134a
Base case PSO GA Base
case PSO
Base case
PS O
Present work
Ref. [20]
Prsent ework
Ref.
[20] - - - -
Turbine inlet pressure
(kPa) 1000 1000 1400 1389 1000 1398 1000 1400
Turbine inlet
temperature (℃) 130 130 135.85 145 130 115.05 130 115.05
Turbine back pressure
(kPa) 300 200 200 200.7 300 200 300 200
Evaporator temperature
(℃) -5 -5 -4.95 -4.92 -5 -4.95 -5 -4.95
Thermal efficiency (%) 24.81 23.66 31.67 30.19 21.22 28.28 15.10 25.08
Exergy efficiency (%) 9.94 9.51 12.69 12.13 8.51 11.31 6.07 10.03 Cost rate ($/year) 5383 5114.5 4738 4240.6 5834 4850 5143 4105
7. References
[1] Kong X., Wang R., Li Y., and Wu J., Performance research of a micro-CCHP system with adsorption chiller, Journal of Shanghai Jiaotong University (2010) 15: 671–675.
[2] Wu J., Wang J., and Li S., Multi-objective optimal operation strategy study of micro-CCHP system, Energy (2012) 48: 472–483.
[3] Rey G., Ulloa C., Míguez J., and Cacabelos A., Suitability Assessment of an ICE-Based Micro-CCHP Unit in Different Spanish Climatic Zones:
Application of an Experimental Model in Transient Simulation, Energies (2016) 9: 1-13.
[4] Mago P. J., Chamra L. M., and Ramsay J., Micro-combined cooling, heating and power systems hybrid electric-thermal load following operation, Applied Thermal Engineering (2010) 30: 800–806
39 household energy demands, Applied Energy (2012) 97: 723–733.
[7] Brandoni C., Renzi M., Caresana F., and Polonara F., Simulation of hybrid renewable microgeneration systems for variable electricity prices, Applied Thermal Engineering (2014) 71: 667-676.
[8] Mancarella P., Matrix modelling of small-scale trigeneration systems and application to operational optimization, Energy (2009) 34: 261–273.
[9] Wu J. Y., Wang J. L., Li S., and Wang R. Z., Experimental and simulative investigation of a micro-CCHP (micro combined cooling, heating and power) system with thermal management controller, Energy (2014) 68: 444–453.
[10] Ion I. V., Ciocea G., and Popescu F., Energy saving and GHG emission reduction in a Micro-CCHP system by use of solar energy, Environmental and Climate Technologies (2012) 10: 16–20.
[11] Puig-Arnavat M., Bruno J. C., Coronas A., Modeling of trigeneration configurations based on biomass gasification and comparison of performance, Applied Energy (2014) 114: 845–856. [12] Wu Q., Ren H., Design, Evaluation of a CCHP based Micro-grid for an Urban Area, Energy Procedia (2017) 143: 798–803.
[13] Farmani F., Parvizimosaed M., Monsef H., and Rahimi-Kian A., A conceptual model of a smart energy management system for a residential building equipped with CCHP system, International Journal of Electrical Power & Energy System (2018) 95: 523–536.
[14] Jiang R. et al., Thermodynamic model development, experimental validation and performance analysis of a MW CCHP system integrated with dehumidification system, Energy Conversion and Management Volume (2018) 158: 176–185.
[15] Borgnakke C. and Sonntag R. E., Fundamentals of thermodynamics.
[16] Twomey B., Jacobs P. A., Gurgenci H., Dynamic performance estimation of small-scale solar cogeneration with an organic Rankine cycle using a scroll expander, Applied Thermal Engineering (2013) 51: 1307–1316.
[17] Srinivasan K. K., Mago P. J., Krishnan S. R., Analysis of exhaust waste heat recovery from a dual fuel low temperature combustion engine using an Organic Rankine Cycle, Energy (2010) 35: 2387–2399.
[18] Wang J., DaiY., Sun Z., A theoretical study on a novel combined power and ejector refrigeration cycle, International Journal of Refrigeration (2009) 32: 1186–1194.
[19] Garousi Farshi L., Mahmoudi S. M. S., Rosen M. A., Exergoeconomic comparison of double effect and combined ejector-double effect absorption refrigeration systems, Applied Energy (2013) 103: 700–711.