0 INTRODUCTION
There are many phrases that other authors have used to describe the “snaking” phenomenon. Some examples are: “vehicle-trailer system high speed instability” and “divergent oscillation that is often associated with high speed and initial impulse” [1] or: “vehicle-trailer instability that is dynamic in nature and may lead to oscillatory response with increasing amplitude” [2], where it is also termed “sway”; or “motion that involves the oscillation in yaw of a towed vehicle at high speed which can lead to loss of control of the coupled combination” [3]; and finally “characteristic oscillatory yawing and rolling motions of car–trailer combinations at moderate to high road speeds” [4] and [5].
This phenomenon, which we shall call snaking, demonstrates the dynamic instability [6] of a vehicle-trailer system. It is of interest to the community of researchers and practitioners, including vehicle manufacturers, trailer manufacturers, accident researchers and reconstructionists, road designers and builders, policy makers and, last but not least, the drivers of trailer-towing passenger cars, primarily caravan and boat owners and, as demonstrated in this article, the towers of cargo trailers .
Several approaches to the modelling and evaluation of snaking have been identified [8]. Analytical approaches [2] and [6] to [8] utilise yaw plane models of the vehicle-trailer system and implement the state space and Routh criteria. Numerical approaches [2], [4], [5], [7] and [8] either use the yaw plane models and numerical integration of their governing equations or the multi-body
dynamics modelling approach. Research has also been conducted into snaking based exclusively on experimental investigations [1], [3] and [9]. It has been demonstrated that the snaking phenomenon would set in at lower velocities in some systems than in others, with all of the above approaches. In order to provide the full control of the model, required to use it for the particular problem and further research, a new model had to be developed.
The specific goal of this study was to determine whether a detailed MBS (multibody system) simulation model could be suitable for modelling the snaking phenomenon. The model of a system comprising a passenger vehicle and a light cargo trailer was prepared by building a detailed geometrical model and a detailed mechanical model, including the aerodynamic forces. The model’s parameter values were obtained from measurements on a real car-trailer system. The aerodynamic forces were obtained from a computational fluid dynamics (CFD) simulation. A set of full-scale experimental runs was devised and performed. The detailed MBS model was validated by a comparison of the measured data and the simulation results.
1 MATERIALS AND METHODS
1.1 The System of a Passenger Car and a Light Cargo Trailer
The towing vehicle in the system comprising a passenger car and a light cargo trailer is a compact, multi-purpose, Opel Zafira, while the trailer is a “uni TRACK 700” from Agromex. The towing vehicle was
The Snaking Stability of Passenger Cars
with Light Cargo Trailers
Šušteršič, G. – Prebil, I. – Ambrož, M.
Gašper Šušteršič – Ivan Prebil – Miha Ambrož*
University of Ljubljana, Faculty of Mechanical Engineering, Slovenia
This paper presents research conducted to determine whether the detailed multibody system (MBS) model presented in the paper is applicable to modelling the snaking phenomenon and to validate the model, including the parameter values, so that it can be used in further research of vehicle safety systems. Experiments and simulations both show – and with good agreement – that the system of a passenger car and a cargo trailer can become unstable at motorway velocities if the trailer is loaded inappropriately. Based on an analysis of the measured data, the impact-damping phenomenon and its influence on snaking damping have been identified. An MBS analysis of the computational-fluid-dynamics-determined aerodynamic influences on the system’s response to an impulse disturbance has shown these influences to be negligible. We have devised the principles and apparatus for measuring the steering-wheel angle, the articulation angle and the lateral force of the trailer’s tow bar. Measuring the last of these makes possible an on-the-fly determination of the trailer’s yaw inertia, one of the most influential parameters with respect to the snaking phenomenon.
not equipped with directional stability systems such as ESP. The basic properties of the car and the trailer are given in Table 1 below.
Table 1. Vehicle system properties as used in experiments and simulation
Curb
weight [kg] Yaw inertia [kgm2] Wheelbase [mm] length [mm]Towbar track [mm]Front/rear Towing
vehicle 1530 2577 2694 / 1487/1470
Trailer 130 248 / 1750 1300
The towing passenger car carries a crew of two – the driver and the operator of the measurement system. The trailer was loaded with cargo arranged around a wooden frame placed in the middle of the trailer’s cargo area as described in section 1.3. This ensured that the cargo was immobilised and that there was an increase in the trailer’s yaw inertia.
1.2 Mechanical Model
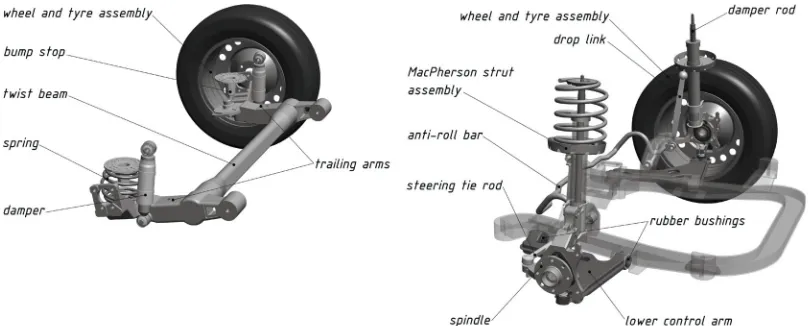
The mechanical model of the car-trailer system is based on the detailed MBS mechanical model presented in [8]. The geometrical model is shown in Fig. 1 for the light cargo trailer and in Fig. 2 for the passenger car. The MacPherson front suspensions on the car are modelled with the lower control arm (LCA) connected to the vehicle body through two control-arm bushings. The MacPherson strut is connected to the control arm by a kinematic spherical joint at the bottom and to the vehicle body at the top by a kinematic universal joint. Bump stops and suspension-travel limiters are also included in the model and generate forces according to the splines obtained from measurements.
Fig. 1. Geometrical model of the trailer
The anti-roll bar is modelled with two rigid bodies, connected to each other by a revolute joint and a torsion spring element acting between them. The rack-and-pinion-type steering system is modelled with the steering wheel attached to the vehicle body by a revolute joint. The translational motion of the steering rack is driven by the rotation of the pinion gear. The vehicle’s steering actions are performed by applying the steering wheel rotation.
The twist-beam-type rear suspension is modelled with each of the trailing-arm bodies connected to the car body with a revolute joint and a torsion spring element acting between both trailing-arm bodies. These are connected to the vehicle body by a damper and a spring on each side. The bump stops and the suspension-travel limiters are also implemented in the model.
The trailer’s suspension, attached to the trailer body, is modelled with each of the trailing arms connected to the trailer body through a revolute joint and a linear torsion spring and damper element.
The application of external forces and moments is facilitated so that aerodynamic forces can be applied to the system at the vehicle as well as at the trailer body. The tyre forces are modelled by implementing the Magic Formula model [9].
A set of mathematical equations is generated and solved automatically by the MBS modelling environment MSC.ADAMS [10].
1.3 Acquisition of the Parameter Values
Geometrical models of the car’s suspension parts were prepared for a previous investigation [8], for the test vehicle as well as for the test trailer. These provide the geometrical parameters as well as the mass and inertia properties of the individual vehicle components included in the mechanical model.
The mass of the vehicle and the location of the centre of mass are determined experimentally in a way, similar to that presented in [11]. The inertial properties of the vehicle were provided to us by the manufacturer (2011 e-mail from Adam Opel AG; unreferenced).
The mass and inertial properties of the driver and the operator were estimated by using human-like geometrical forms, to which densities were assigned that resulted in appropriate masses for the driver and the operator.
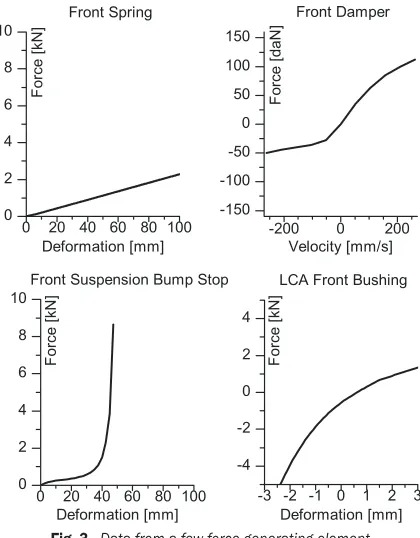
All the vehicle force-generating elements were removed from the vehicle for characterisation in order to obtain their net forces, similar as in the procedure, described in [12]. The vehicle springs, the bump stops, the suspension-travel limiters and the bushings were all characterised on a laboratory universal testing machine. While the vehicle springs exhibited highly linear behaviour, the other elements behaved in a nonlinear manner, necessitating the implementation of spline curves for a faithful representation of their properties. The bushings mounted on the vehicle were axially symmetric, but the axial stiffness was different when loaded from front to rear than when loaded from rear to front. A custom mounting device made possible a characterisation on the universal testing machine. The bushings were modelled in a preloaded state, resembling that on the real vehicle. Vehicle dampers were characterised on a testing machine that was capable of higher-speed operation. The measurements were carried out at 50 mm of travel and maximum velocities of 52, 104, 157, 209 and 262 mm/s. Based on the damper measurements, two nonlinear damping force vs. damper rod velocity splines were generated for the characteristics of the front and rear dampers.
Fig. 3 shows the measured characteristics for some force-generating suspension elements.
Fig. 3. Data from a few force-generating element characterization experiments
The front anti-roll bar and the stabilising influence of the twist axle were characterised by securing the attachment points and observing the relative rotation of the two suspension arms for various values of the applied torsion moment.
The trailer’s suspension spring and damping characteristics were characterised as shown in [8] by applying known torsional moments and by determining the free oscillation decay. The range of suspension velocities occurring during the free oscillation, from which the rate of decay was determined (around 1.75 Hz), also encompasses the range of suspension velocities at the snaking frequency present in our model’s response (around 1 Hz), as both motions had similar amplitudes.
The steering ratio was determined by simultaneously measuring the steering wheel’s angle of rotation and the rack’s translation. The wheel alignment of the model was set up according to the vehicle-service manual [13].
The tyre model’s parameter-set values were acquired for the specific make, model, size, speed rating and load rating [14].
rather than a caravan, which tempted us to consider the aerodynamic forces as being negligible. However, the report of Darling and Standen [9] prompted us to consider the influences of the aerodynamic forces as well. We utilised a 3D CFD software application XFlow. Detailed geometrical models of the towing vehicle and the trailer were included in the simulation. A single-phase external flow model was used. The Large Eddy Simulation (LES) approach for turbulence was employed with the Wall-Adapting Local Eddy (WALE) scheme. Zero roughness on the surface was assumed and the pressure gradient was not taken into account. The geometrical model of the vehicle body [8] was obtained by photogrammetric modelling and consists of 3898 polygons. The trailer’s geometrical model was the same as used in the MBS simulations.
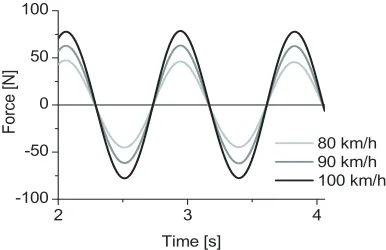
First, a simulation of the MBS vehicle-trailer system was carried out to obtain the motion of the system without any aerodynamic influences. Next, the maximum amplitude and the frequency of trailer’s yaw motions from this simulation were used as inputs for the CFD analysis to obtain the aerodynamic forces and the moments on the trailer. The aerodynamic forces relate directly to the vehicle’s velocity and the trailer’s yaw angle. The simulation results
give a distinct curve of larger amplitude with the superimposed influences of smaller amplitudes and higher frequencies. A 3-Hz low-pass filter revealed the sine-like form of the signal, as shown in Fig. 4. All of the aerodynamic forces and moments were applied at a point on the trailer model according to the CFD analysis results. This greatly simplified the inclusion of the aerodynamic influences in the model. The simulations were then carried out, including the forces determined in the previous steps.
Fig. 4. Resulting lateral force from the CFD analyses, low-pass filtered at 3 Hz
Fig. 5. Measurement system schematic
1.4 Test Equipment and Procedure
1.4.1 Equipment
The measurements were carried out with a measurement system based on a NI PXI platform consisting of a chassis, a controller module and multiple DAQ modules. The complete measurement system is schematically presented in Fig. 5.
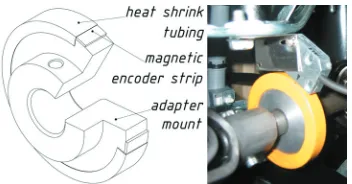
A non-contact optical sensor was used to measure the vehicle’s longitudinal and lateral velocities, triaxial accelerometer modules were used for the acceleration measurements, and an incremental rotary encoder (Fig. 6) was used to measure the articulation angle. A magnetic linear encoder, modified and fitted to the steering shaft (Fig. 7), was used to measure the angle of the steering wheel. Strain gauges arranged in a full-bridge circuit, which provided temperature compensation and isolation from any axial forces (Fig. 8), were used to measure the lateral force on the tow ball. The application that facilitated the acquisition, storage and reviewing of the acquired test-run data was developed in the LabVIEW environment.
Fig. 7. Linear magnetic encoder fitted to the steering shaft
Fig. 8. Implementation of a rotary encoder for the measurement of the articulation angle
1.4.2 Procedure
The validation experiments were conducted with two trailer-load distributions. Both contained the same amount of cargo material and were loaded
symmetrically, front to rear as well as left to right, except for one row sacks. This row was placed as far as possible to the front in the first test case (TC1) and as far as possible to the rear in the second test case (TC2), providing the difference in the weight distribution.
A total of 76 experimental runs were conducted in the TC1 and TC2 configurations, all on an airport runway. The test procedure for a single experimental run began by accelerating the vehicle to the desired velocity and engaging the car’s cruise control. The operator started data acquisition and the driver then initiated the disturbance manoeuvre according to [15]. The initial impulse displacement of the steering wheel was completed by a subsequent steering correction in the opposite direction (see Fig. 9) in order for the car to regain its initial path. The steering wheel was then held fixed in the straight-ahead position. Once the system oscillation had settled down, the next disturbance was applied to the steering wheel.
2 ANALYSIS OF THE MEASUREMENTS AND THE SIMULATION RESULTS
2.1 General
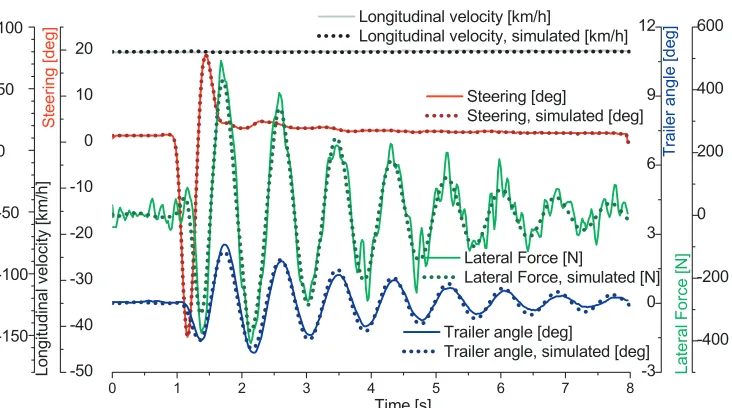
An example of the measured data for one individual disturbance and the system’s response, complete with simulation results for comparison, is shown in Fig. 9.
All the test-run data were processed offline in the manner outlined in ISO 9815 [15] in order to determine the value of the most frequently used parameter that is indicative of the level of system stability, i.e., “the damping D”.
The system is stable (the amplitude of sways subsides over time) as long as the D value is positive. The speed at which the system D value becomes negative is called the zero damping speed.
The D values of the individual test runs plotted with respect to the vehicle’s velocity are presented in Fig. 10. Although it is common practice to plot a root-mean-square linear interpolation through all the data points on graphs such as these, we shall, for now, restrain ourselves from this practice.
from their initial positions and came into impact-like contact with each other and with the side walls of the trailer’s cargo compartment.
The movement of the cargo and the interaction between the cargo and the trailer can account for significant additional damping in the system. This so-called “impact damping” or “particle impact damping” is a consequence of wall and particle-to-particle collisions in which kinetic energy is dissipated due to frictional and inelastic losses. Although many papers were published on this topic [16] to [21], the data and the theory therein do not allow us to make any sensible evaluation of the influence of impact damping in our experimental studies. However, the damping ratios from the measurement runs are consistently higher than those from the simulated runs, as seen in Fig. 11. This does not contradict the found presence of impact damping in the system.
It is clear that it would not be appropriate to regress to linearity through all the measured data points in Fig. 10, thus only the “no-cargo-movement” (8 tests for TC1 and 21 for TC2) data was used for the validation of the model and parameter values.
2.2 Validation of the Model and Parameter Values
We validated the model, including the parameter values described previously, by comparing the measured data with the simulation results. The simulations were carried out in such a way that made the simulated test runs comparable to the experimental test runs. The disturbance was introduced to the model of the vehicle-trailer system in the simulated test runs through a prescription of the time series of the steering-wheel angle data measured on the vehicle during the actual experimental test runs. The initial velocity of the vehicle model was prescribed to be the Fig. 9. Disturbance and response of the system as measured and simulated for a single test run
a) b)
value measured during the actual experimental test run and this velocity was kept constant by the actions of the driver model. Both the measured and the simulated steering-wheel angle and vehicle velocities are shown for comparison in Fig. 9.
While the simulation results and the measurements in TC2 (the less-stable configuration) show good agreement, it is necessary to comment on the TC1 configuration results. It should be noted that only the test runs with no or only a small amount of cargo movement should be taken into consideration when plotting the linear regression. Consequently we find that the data for the measurement data points at the highest system velocities (shown as larger squares in Fig. 11) is too scarce to be of real value. Fig. 11 shows that the measured and simulated damping became increasingly similar as the system velocity increased. This is due to the drop of the initial impulse and the consequent decrease in the cargo movement. The test runs where the cargo movement with the cargo-area wall impact occurred demonstrate a large increase in damping.
2.3 Implications of the Trailer Tow Bar’s Lateral Force Measurement
The comparison of the simulated and measured values of the lateral trailer hitch force reveals that although the basic forms of both curves and the amplitude values match closely, an oscillation with a frequency higher than that of the snaking can be clearly identified, superimposed on the measured force curve (Fig. 9).
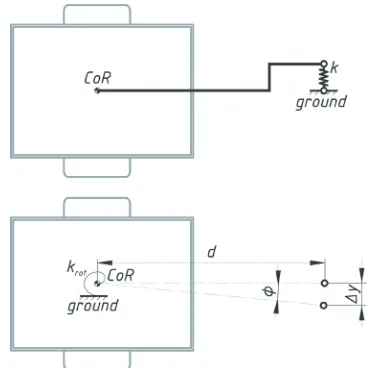
The superimposed force is a consequence of the fact that the trailer’s tow bar is not rigid in the actual system, but rather acts as an elastically deformable beam element connecting the trailer to the vehicle. The trailer wheels rotate freely. The mode of the trailer motion that sets on when moving the hitch point of the trailer tow bar left to right can be described as rotation of the trailer about the centre of rotation (CoR) as shown in Fig. 13. As such, the frequency of this superimposed force component could give us some insight into the actual trailer yaw inertia as long as we Fig. 11. Comparison of measured and simulated damping ratios
have some basic geometrical data for the trailer and the trailer’s tow bar.
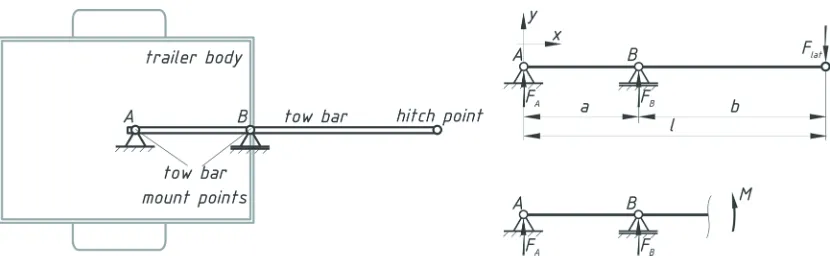
To check the validity of the above proposition, we utilised the theory of beam deflection [22]. We modelled the trailer’s tow bar as an overhanging beam, as shown in Fig. 12.
Fig. 13. Interpretation of the trailer with a deformable trailer tow bar as a yaw pendulum
To write the equation for the beam deflection, we first express the beam’s bending moment M according to Fig. 12:
M x
( )
=F x FA⋅ + B⋅ −(
x a).
Next, we double integrate the beam-deflection equation:
EI y
x M x
d d 2
2 =
( ),
and consider the boundary conditions in order to obtain the deflection equation:
y x F EI
x x
a x a
x ax xa x
a
( )
= − + − − − 16 1 6 2 6 1 3
3 3 2 2
. (1)
Eq. (1) can be used to determine the ratio of
F/y(l), which represents the spring stiffness k of the spring in the model shown in Fig. 13. Since the trailer is basically carrying out a yawing motion around its centre of rotation, we substitute the translational spring of stiffness k with a rotational spring of stiffness
krot, placed at the centre of rotation.
Having small f, equating the forces produced with each spring leads us to:
krot⋅ = ⋅φ k y k d∆ = ⋅ ⋅φ and krot= ⋅k d.
From the equation of oscillation of a simple 1D torsional pendulum, the trailer’s yaw inertia can be expressed as:
JT =krot ω2, (2)
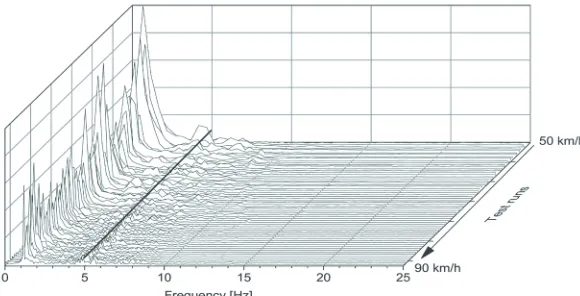
where ω = 2πν, ν being the frequency of oscillation. The spectra of trailer hitch forces for all the TC2 measurements are shown in Fig. 14 and the frequency of the superimposed force component is clearly identifiable on every test run with a value close to 5 Hz. The value of the trailer’s inertia that is determined from Eq. (2) based on this frequency, turns out not to be the best estimator for the actual yaw inertia of the trailer (141 kgm2, determined from the spectral analysis vs. 248 kgm2, estimated from the geometrical modelling).
It is nevertheless reasonable to consider that the frequency response of a trailer with a non-granular immobilised cargo would demonstrate a characteristic that estimates the trailer’s yaw inertia with greater accuracy. The trailer’s inertia measured with a relatively high-frequency oscillation might not have included all of the loose cargo. In other words, some of the cargo could have been excluded from the oscillating system due to the transfer of an individual cargo particle motion.
An “on the fly” evaluation of the trailer’s yaw inertia by analysing the lateral forces of the trailer’s tow bar is perfectly technically feasible. Since the trailer’s yaw inertia is one of the most influential parameters for the snaking phenomenon, a materialisation of this idea could deliver a warning safety system similar to a low-tyre-pressure detection system.
2.4 Influence of Aerodynamic Forces
increasing yaw amplitude of the trailer. The latter is a consequence of a decrease in the system’s stability with the increased longitudinal velocity. The stability of the system with aerodynamic influences is only marginally higher than in the system without them.
The results presented in Fig. 15 indicate that the aerodynamic influences can safely be removed from consideration when simulating the snaking phenomenon with a system based on a passenger car and a light cargo trailer for trailers that have geometries and sizes similar to that used in this study (see Fig. 2).
3 CONCLUSIONS
The results of the experimental investigation show that a system composed of a passenger car and a cargo trailer can easily become unstable at legal motorway speeds (80 to 100 km/h in Slovenia and most of Europe) if the trailer is not correctly loaded. The
simulation results follow the experimental findings closely, thus proving the multi-body system (MBS) approach to the modelling of the snaking phenomenon is appropriate. The coupled MBS-CFD model-based research of the aerodynamic influences on the system’s response showed that those influences do not need to be considered when dealing with trailers that have geometries and sizes similar to the one used in this study. We have determined that the impact damping, occurring due to the energy dissipation of the impact-like interaction of the unsecured cargo and the trailer, can greatly improve the stability of the system.
The approaches to measuring the articulation angle and the steering-wheel angle that we have proposed and the devices we have implemented performed flawlessly and show great potential for further use. This is also true for the implementation of a lateral tow-bar force measurement, which has proven itself to be of great value. Its fidelity Fig. 14. Comparison of systems with and without aerodynamic influences; a) articulation angle amplitude decay,
b) damping D over a range of velocities
promises to enable on-the-fly determination of some of those trailer parameters that influence the snaking phenomenon the most and are left to the (often uninitiated) user’s discretion.
Following the verification of our model with a slightly improved experimental set-up, investigations into the influence of the amplitude of the disturbance impulse on the system’s stability could be carried out. The validated detailed model as presented in the paper is needed for an in-depth investigation of the snaking phenomenon. Some preliminary tests have shown that the influence of the impulse amplitude on system’s stability might not be negligible. The influences of the system’s roll properties could also be evaluated through the MBS. Finally, a design of experiment (DOE) approach could also be used to test for the interaction or synergetic (in a positive or negative sense of the word) influence of multiple system parameters.
4 REFERENCES
[1] Darling, J., Tilley, D., Gao, B. (2009). An experimental investigation of car–trailer high-speed stability. Proceedings of the Institution of Mechanical Engineers, Part D: Journal of Automobile Engineering, vol. 223, no. 4, p. 471-484, DOI:10.1243/09544070JAUTO981. [2] Hac, A., Fulk, D., Chen, H. (2008). Stability and
control considerations of vehicle-trailer combination. SAE Technical Paper Ser., no. 2008-01-1228, p. 1-15. [3] Killer, C.J. (2003). The Dynamics of Towed Vehicles
[Final year project], University of Bath, Bath. [4] Sharp, R.S., Alonso Fernandez, M.A. (2002). Car–
caravan snaking Part 1: the influence of pintle pin friction. Proceedings of the Institution of Mechanical Engineers, Part C: Journal of Mechanical Engineering Science, vol. 216, no. 7, p. 707-722, DOI:10.1243/09544060260128760.
[5] Sharp, R.S., Alonso Fernandez, M.A. (2002). Car– caravan snaking Part 2: active caravan braking. Proceedings of the Institution of Mechanical Engineers, Part C: Journal of Mechanical Engineering Science, vol. 216, no. 7, p. 723-736, DOI:10.1243/09544060260128779.
[6] Karnopp, D. (2004). Vehicle Stability. Marcel Dekker, New York, DOI:10.1201/9780203913567.
[7] Bundorf, T.R. (1967). Directional control dynamics of automobile- travel trailer combinations. SAE Technical Paper 670099, p. 667-680, DOI:10.4271/670099. [8] Šušteršič, G., Ambrož, M., Prebil, I. (2011). Application
of rigid multi-body system modelling to determination of passenger-car and trailer combination lateral stability. Trans & MOTAUTO, p. 26-29.
[9] Darling, J., Standen, P.M. (2003). A study of caravan unsteady aerodynamics. Proceedings of the Institution of Mechanical Engineers, Part D: Journal of Automobile Engineering, vol. 217, no. 7, p. 551-560, DOI:10.1243/095440703322114933.
[10] MSC.ADAMS. (2007). MSC.Software Corporation,
Santa Ana.
[11] UNECE Regulation no. 66 (2006). Uniform technical prescriptions concerning the approval of large passenger vehicles with regard to the strength of their superstructure. United Nations Economic Commission for Europe. Geneva.
[12] Krishnasamy, P., Jayaraj, J., John, D. (2013).
Experimental investigation on road vehicle active suspension. Strojniški vestnik - Journal of Mechanical Engineering, vol. 59, no.10, p. 620-625, DOI:10.5545/ sv-jme.2012.925.
[13] Legg, A.K., Mimi, L., Martyn, R. (2003). Vauxhall Astra and Zafira service and Repair Manual. Haynes Publishing, Sparkford.
[14] Michelin, Michelin Engineering & Services
Automotive, from
http://www.michelin-engineering-and-services.com/, accessed on 2013-10-04.
[15] ISO 9815:2010(E). Road vehicles - Passenger-car and trailer combinations - Lateral stability test. International Organization for Standardization, Geneva. [16] Friend, R.D., Kinra, V.K. (2000). Particle impact
damping. Journal of Sound and Vibration, vol. 233, no. 1, p. 93-118, DOI:10.1006/jsvi.1999.2795
[17] Saeki, M. (2002). Impact damping with granular materials in a horizontally vibrating system. Journal of Sound and Vibration, vol. 251, no. 1, p. 153-161, DOI:10.1006/jsvi.2001.3985.
[18] Mao, K., Wang, M.Y., Xu, Z., Chen, T. (2004). DEM simulation of particle damping. Powder Technology, vol. 142, no. 2-3, p. 154-165, DOI:10.1016/j. powtec.2004.04.031.
[19] Marhadi, K.S., Kinra, V.K. (2005). Particle impact damping: effect of mass ratio, material, and shape. Journal of Sound and Vibration, vol. 283, no. 1-2, p. 433-448, DOI:10.1016/j.jsv.2004.04.013.
[20] Afsharfard, A., Farshidianfar, A. (2012). Design of nonlinear impact dampers based on acoustic and damping behavior. International Journal of Mechanical
Sciences, vol. 65, no. 1, p. 125-133, DOI:10.1016/j.
ijmecsci.2012.09.010.
[21] Fleissner, F., Gaugele, T., Eberhard, P. (2007). Applications of the discrete element method in mechanical engineering. Multibody System Dynamics, vol. 18, no. 1, p. 81-94, DOI:10.1007/s11044-007-9066-2.
[22] Nash, W.A. (1998). Schaum’s Outline of Theory and
Problems of Strength of Materials, McGraw-Hill, New