University of New Orleans University of New Orleans
ScholarWorks@UNO
ScholarWorks@UNO
University of New Orleans Theses and
Dissertations Dissertations and Theses
Fall 12-17-2011
Multivariate Models and Algorithms for Systems Biology
Multivariate Models and Algorithms for Systems Biology
Lipi Rani Acharya
University of New Orleans, [email protected]
Follow this and additional works at: https://scholarworks.uno.edu/td
Part of the Bioinformatics Commons, Computer Sciences Commons, and the Systems Biology Commons
Recommended Citation Recommended Citation
Acharya, Lipi Rani, "Multivariate Models and Algorithms for Systems Biology" (2011). University of New Orleans Theses and Dissertations. 1364.
https://scholarworks.uno.edu/td/1364
This Dissertation is protected by copyright and/or related rights. It has been brought to you by ScholarWorks@UNO with permission from the rights-holder(s). You are free to use this Dissertation in any way that is permitted by the copyright and related rights legislation that applies to your use. For other uses you need to obtain permission from the rights-holder(s) directly, unless additional rights are indicated by a Creative Commons license in the record and/ or on the work itself.
This Dissertation has been accepted for inclusion in University of New Orleans Theses and Dissertations by an
Multivariate Models and Algorithms for Systems Biology
A Dissertation
Submitted to the Graduate Faculty of the University of New Orleans
in partial fulfillment of the requirements for the degree of
Doctor of Philosophy in
Engineering and Applied Science Computer Science
by
Lipi Rani Acharya
M.Sc., Indian Institute of Technology Madras, 2003 Ph.D., Indian Institute of Technology Kanpur, 2009
Acknowledgements
I express my deep gratitude to my advisor, Dr. Dongxiao Zhu, for his insightful
guidance, endless patience and generous support throughout the tenure of this dissertation.
I also thank him for letting me be a part of this exciting project. Numerous discussions and
seminars held under his knowledgeable direction, his invaluable expertise and unflinching
encouragement have gone a long way in successful completion of this work. It was a great
pleasure working with him and I am indebted to him for helping me grow both professionally
and personally.
I am grateful to the members in my dissertation committee for their constructive
suggestions on this research and their incredible support. Besides Dr. Zhu, I thank Dr.
Huimin Chen, Dr. Adlai N DePano, Dr. Linxiong Li and Dr. Christopher M Summa. I
also had the privilege of taking classes with them during my course work and what I learned
from them had a great impact on this dissertation. I sincerely thank each one of them.
I am thankful to my colleague Thair Judeh with whom I had the opportunity to
dis-cuss and collaborate on many research projects. I also acknowledge the initial contributions
made by Dr. Zhensheng Duan and the suggestions of Dr. Michael Rabbat in Chapter 5
of this dissertation. I express my thanks to Dr. Guangdi Wang for sharing his biological
insights which proved instrumental in testing our methodology in Chapter 6.
This research was supported by the Office of Research and Sponsored Programs at the
University of New Orleans and the grant R21LM010137 from National Institute of Health
to Dr. Zhu. I acknowledge the support of both the agencies.
My words of appreciation go to Ms. Jeanne Boudreaux, our department secretary,
and Ms. Zella Huaracha, the doctoral program coordinator, for their hard work.
research group, especially Nan Deng, Guorong Xu, Tin Nguyen, Thair Judeh and Kristen
M Johnson. They all have taught me many things about life. I appreciate their friendships
during the course of this dissertation.
I will always be indebted to my parents, parent-in-laws, brother and sisters for their
unconditional love and support, which helped me stay focussed during the years. Finally,
I express my most heartfelt thanks to my husband, Sachi Mishra, for his selfless love, for
providing me with unending encouragement and for standing by me in all good and bad
Table of Contents
List of Figures xiv
List of Tables xvi
List of Abbreviations and Acronyms xviii
Abstract xx
1 Background and Introduction 1
1.1 Molecular Profiling Measurements . . . 1
1.1.1 Microarray Experiments . . . 1
1.1.2 Replicated Molecular Profiling Data . . . 5
1.2 Pathway Analysis . . . 7
1.2.1 Structure of Signaling Pathways . . . 8
1.2.2 Identification of Signaling Pathway Components . . . 9
1.3 Previous Works and Current Challenges . . . 11
1.3.1 Correlation-Based Discovery of Pathway Components . . . 11
1.3.2 Reconstruction of Signaling Pathway Structures . . . 14
1.4 Outline of Dissertation . . . 18
1.5 List of Publications . . . 19
2 Learning Correlation Structures from Replicated and Complete Molecular Profiling Data I 22 2.1 Introduction . . . 22
2.3 The Existing Blind-Case Approach . . . 24
2.3.1 The Model . . . 24
2.3.2 Parameter Estimation . . . 25
2.4 Informed-Case Approach . . . 27
2.4.1 The Model . . . 27
2.4.2 Parameter Estimation . . . 29
2.4.3 Model Summarization . . . 30
2.5 Results . . . 31
2.5.1 Parameter Settings . . . 31
2.5.2 Performance Evaluation . . . 32
2.6 Discussion . . . 34
3 Learning Correlation Structures from Replicated and Complete Molecular Profiling Data II 37 3.1 Introduction . . . 37
3.2 Notations . . . 38
3.3 Finite Mixture Model Approach . . . 39
3.3.1 The Model . . . 39
3.3.2 Unconstrained EM Algorithm . . . 40
3.3.3 Constrained EM Algorithm . . . 41
3.3.4 Correlation-Based Clustering . . . 42
3.4 Simulations . . . 43
3.4.1 Simulation Settings . . . 43
3.4.2 Performance Evaluation . . . 45
3.5 Real-world Data Analysis . . . 45
3.5.1 Data . . . 45
3.5.2 Estimation of Correlation Structure . . . 46
3.6 Discussion . . . 48
4 Learning Correlation Structures from Replicated and Incomplete Molecu-lar Profiling Data 50 4.1 Introduction . . . 50
4.2 Notations . . . 50
4.3 EM Algorithm . . . 51
4.3.1 The E Step . . . 52
4.3.2 The M Step . . . 55
4.4 Simulations . . . 56
4.4.1 Simulation Settings . . . 56
4.4.2 Performance Evaluation . . . 59
4.5 Read-world Data Analysis . . . 62
4.5.1 Data . . . 62
4.5.2 Estimation of Correlation Structure . . . 71
4.5.3 Cluster Analysis . . . 73
4.6 Discussion . . . 73
5 Reconstructing Signaling Pathway Structures: A Sampling-Based Approach 76 5.1 Introduction . . . 76
5.2 Concepts and Notations . . . 78
5.3 Joint Distribution of IFGSs . . . 79
5.4 Conditional Distribution of IFGSs . . . 80
5.5 Gene Set Gibbs Sampler (GSGS) . . . 81
5.6 Description of the Case Studies . . . 82
5.6.1 Case Study I: Using the E. coli and In silico Networks . . . 82
5.6.2 Case Study II: Using the E. coli Data Sets . . . 86
5.7 Performance Evaluation . . . 87
5.7.1 Using IFGSs Derived from the E. coli and In silico Networks . . . 87
5.7.2 Using IFGSs Derived from the E. coli Data Sets . . . 92
5.7.3 Using IFGSs Related to the ERBB Signaling Pathway . . . 95
5.8 Discussion . . . 100
6 Reconstructing Signaling Pathway Structures: A Discrete Optimization Approach 102 6.1 Introduction . . . 102
6.2 Notations . . . 103
6.3 A Discrete Optimization Problem . . . 103
6.4 Energy of a Signaling Pathway Structure . . . 104
6.5 Feasible Signaling Pathway Structures . . . 105
6.6 Justification of the Energy Function . . . 106
6.7 Gene Set Simulated Annealing (GSSA) . . . 106
6.8 Description of the Case Studies . . . 107
6.8.1 Case Study I: Using Signaling Pathway Structures in KEGG . . . 107
6.8.2 Case Study II: UsingE. coli Data Sets . . . 109
6.8.3 Case Study III: Pathways Reconstruction in Breast Cancer Cells . . . 110
6.9 Performance Evaluation . . . 111
6.9.1 Using IFGSs Derived from Signaling Pathway Structures in KEGG . 111 6.9.2 Using IFGSs Derived from the E. coli Data Sets . . . 114
6.9.3 Using IFGSs Related to the ERBB and PMOM Signaling Pathways . 114 6.10 An Alternative Approach: Gene Set Genetic Algorithm (GSGA) . . . 120
6.11 Discussion . . . 123
7 Conclusion and Future Works 124
A Appendix 152
A.1 Derivation of the MLEs ˆµI and ˆΣI . . . 152
A.2 Summarization of Correlation . . . 154
A.3 Missing Values Imputation Using K-Nearest Neighbors . . . 154
A.4 SD-Weighted Correlation . . . 155
A.5 Description of the Bayesian Network Methods . . . 156
A.6 Description of the Mutual Information Methods . . . 157
A.7 Generation of All Linear Paths from a Network . . . 158
A.8 Generation of BFS Paths from a Network . . . 158
A.9 Accommodation of Discrete Inputs by GSGS and GSSA . . . 160
A.10 Burn-In State Analysis for GSGS . . . 161
A.11 Computational Complexity Analysis of GSSA . . . 162
List of Figures
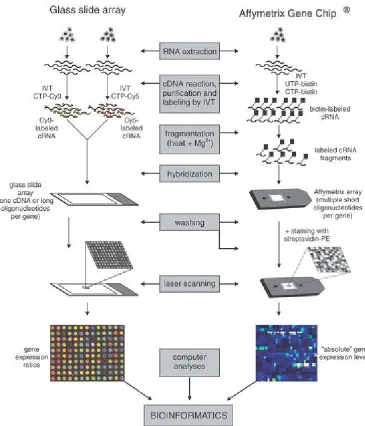
1.1 Illustration of cDNA (Left) and Affymetrix (Right) microarray technologies. Figure
reused by permission from Mcmillan Publishers Ltd: Leukemia [138], copyright 2003. 3
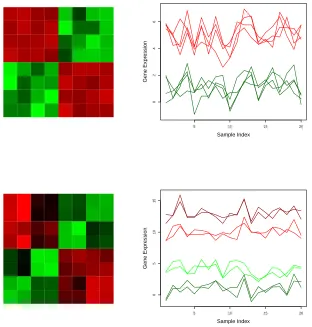
1.2 Correlation structures (Left) and molecular profiling data (Right)
correspond-ing to a pair of genes, each with 4 replicated measurements. The upper
panels represent the correlation structure and molecular profiling data with
blind replication mechanism, whereas the lower panels correspond to the ones
with informed replication mechanism. In the case of informed replication
mechanism 2 biological replicate and 2 technical replicates nested within each
biological replicates are used for a gene. Figure reused from [4]. . . 6
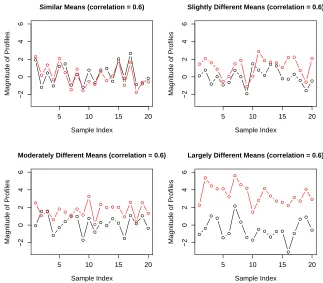
1.3 Correlation is scale-free. The 4 pairs of non-replicated simulated profiles have the
same correlation of 0.6, but differ vastly in their relative magnitude. Figure reused
from [161]. . . 13
1.4 Gene clustering and networking using replicated molecular profiling data. The left
block represents 4 replicated molecular profiles, in which the magnitude of each
molecular profile (one color curve) differs significantly from the others. The middle
block displays a scale-free correlation matrix of 4 replicated gene expression profiles.
The right side block shows five popular gene clustering and networking algorithms.
Figure reused from [161]. . . 15
1.5 Representation of a gene set compendium as binary discrete data andvice versa. . 17
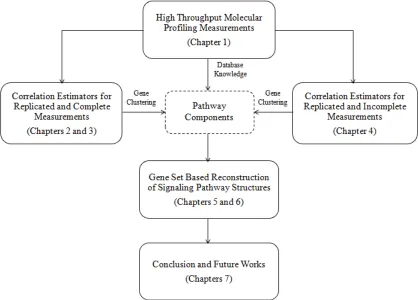
1.6 An outline of dissertation. . . 21
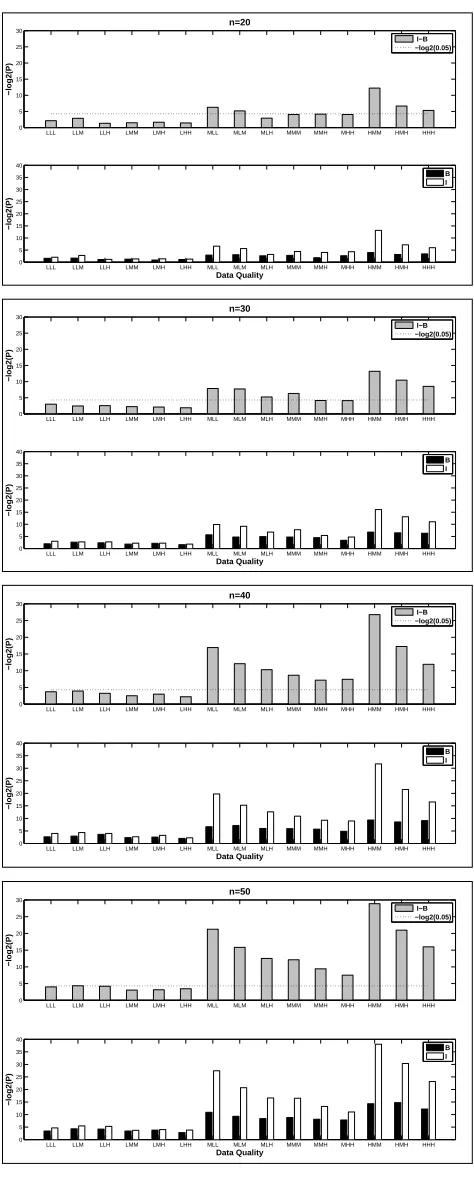
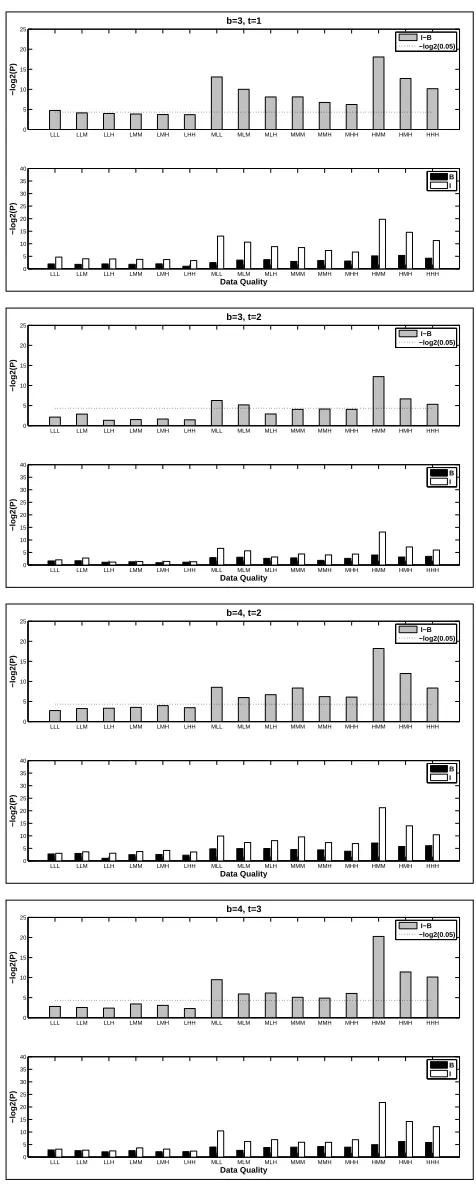
2.1 Comparison of the blind-case model (B) and the informed-case model (I) using
two methods outlined in Section 2.4.3. The simulated data has three biological
2.2 Comparison of the blind-case model (B) and the informed-case model (I) with
increasing number of biological and technical replicates. Sample size is fixed at
n= 20. . . 35
3.1 Comparison of the mixture model and the blind-case model in terms of MSE
ratio, where MSE ratio = MSE from the blind-case model/MSE from the
mixture model. . . 44
3.2 Comparison of the squared error values in estimating all pairwise correlations
using the mixture model and the blind-case model, for spike-in data . . . 47
3.3 Comparison of the correlation structures estimated using the mixture model
and the blind-case model with the nominal correlation structure, for selected
probe sets in spike-in data . . . 47
3.4 Performance of the blind-case model and the mixture model in clustering yeast
data. Each index corresponds to a data set with 60 randomly selected probe
sets. . . 49
4.1 Performance of the EM algorithm with increasing data quality. Upper Panel:
Blind-case model; Lower Panel: Informed-case model. . . 60
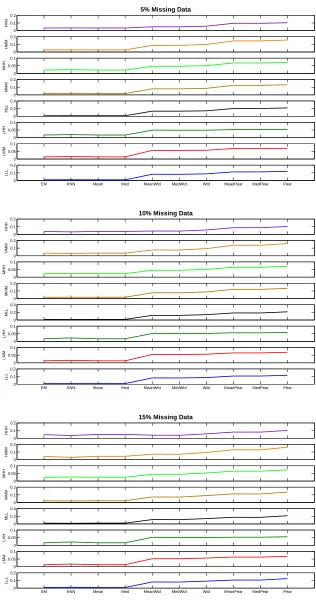
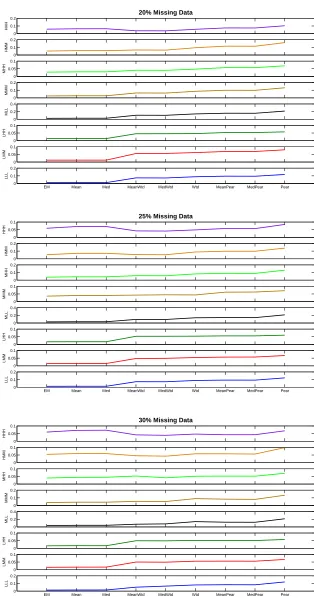
4.2 Performance of the EM algorithm with increasing percentage of missing values.
Upper Panel: Blind-case model; Lower Panel: Informed-case model. . . 61
4.3 Blind-case Model: Comparison of the EM algorithm with other
multivari-ate models, KNN, Mean and Med in terms of MSE ratio (n=20 and m=4).
Percentage of missing values is in the range 5%-15%. . . 63
4.4 Blind-case Model: Comparison of the EM algorithm with other
multivari-ate models, KNN, Mean and Med in terms of MSE ratio (n=20 and m=4).
Percentage of missing values is in the range 15%-30%. . . 64
4.5 Informed-case Model: Comparison of the EM algorithm with other
multivari-ate models, KNN, Mean and Med in terms of MSE ratio (n=20 and m=6).
4.6 Informed-case Model: Comparison of the EM algorithm with other
multivari-ate models, KNN, Mean and Med in terms of MSE ratio (n=20 and m=6).
Percentage of missing values is in the range 15%-30%. . . 66
4.7 Performance of all blind-case multivariate and bivariate models for different
percentage of missing values. Percentage of missing value is in the range
5%-15%. . . 67
4.8 Performance of all blind-case multivariate and bivariate models for different
percentage of missing values. Percentage of missing value is in the range
15%-30%. . . 68
4.9 Performance of all informed-case multivariate and bivariate models for
differ-ent percdiffer-entage of missing values. Percdiffer-entage of missing value is in the range
5%-15%. . . 69
4.10 Performance of all informed-case multivariate and bivariate models for
differ-ent percdiffer-entage of missing values. Percdiffer-entage of missing value is in the range
15%-30%. . . 70
4.11 Performance of all multivariate models in Affymetrix spike-in data analysis in
terms of MSE ratio. . . 72
4.12 Performance of all multivariate and bivariate models in Affymetrix spike-in
data analysis for different percentage of missing data. . . 72
4.13 Performance of all multivariate and bivariate models in yeast galactose data
analysis for different percentage of missing data. . . 74
5.1 Sensitivity analysis for the GSGS approach with increasing percentage of prior
knowledge. Network: E. coli (Upper Panel) and In silico (Lower Panel). In blocks
(a)-(f), the x-axis represents the percentage of gene sets present in the input and
the y-axis plots the total number of edges predicted by GSGS (Solid Line). The
5.2 Network: E. coli. Comparison of the GSGS approach with K2 and MH in terms of
the total number of predicted edges with increasing percentage of prior knowledge.
Left Panel: Using discrete measurements; Right Panel: Using continuous data with
different sample size. The dashed line represents the ground truth. . . 91
5.3 Network: In silico. Comparison of the GSGS approach with K2 and MH in terms of
the total number of predicted edges with increasing percentage of prior knowledge.
Left Panel: Using discrete measurements; Right Panel: Using continuous data with
different sample size. The dashed line represents the ground truth. . . 92
5.4 Network: E. coli. Comparison of the GSGS approach with K2 and MH in terms of
F-Scores. Upper Panel: Using discrete measurements; Lower Panel: Using continuous
measurements with different sample sizes. . . 93
5.5 Network: In silico. Comparison of the GSGS approach with K2 and MH in terms
of F-Scores. Upper Panel: Using discrete measurements; Lower Panel: Using
con-tinuous measurements with different sample sizes. . . 94
5.6 A proof of principle study. Left panels show two gold standard networks, E. coli
(Upper) and In silico (Lower). Right panels show the corresponding predicted
networks by GSGS, E. coli (Upper) and In silico (Lower). On the right panels,
the blue edges correspond to true positives and gray edges represent false positives.
Figures were generated using Cytoscape [131]. . . 96
5.7 Comparison of GSGS with the contemporary MI based network inference methods
using four benchmarkE. coli data sets available from the DREAM initiative. . . . 97
5.8 Upper Panel: Example of information flows inferred by GSGS. Genes in each
information flow follow the hierarchy presented in Table 5.3; Lower Panel: A
partial view of the network formed by genes in the neighborhood of ERBB2
and ERBB3. Each information flow follows the hierarchy presented in Table
6.1 Left Panel: Empirical P-Values computed for true signaling pathway
struc-tures (Left) and randomly selected feasible pathway strucstruc-tures (Right)
corre-sponding to 83 IFGS compendiums derived from the KEGG pathways; Right
Panel: Energy values computed by varying the initial structure and cooling
schedule constants for a total of 2×10⁵ jumps. The IFGS compendium was
derived from the generic vascular smooth muscle contraction pathway in KEGG.112
6.2 The performance of GSSA in reconstructing true signaling cascades and
sig-naling pathway structures corresponding to 83 IFGS compendiums derived
from the KEGG database. . . 113
6.3 Comparison of GSSA with the Bayesian network approaches K2 and MH using
BIC and Bayesian score functions (Left Panel) and with MI based approaches
(Right Panel). . . 114
6.4 An example showcasing the performance of GSSA in recovering the true
struc-ture using the IFGS compendium derived from the GnRH signaling pathway
in KEGG database. Structures on the upper and lower panels represent true
and inferred signaling pathways, respectively. . . 115
6.5 Comparison of GSSA and the MI based methods in terms of precision ratio,
which is the ratio of the precision from GSSA and the one from MI based
methods. We used 4E. coli benchmark data sets available from the DREAM
initiative. . . 117
6.6 Upper Panel: Linear cascading events inferred by GSSA which correspond
to complete or partial linear signaling events already reported in the ERBB
(Upper Left) and PMOM (Upper Right) pathways in KEGG; Lower Panel:
Partial view of the breast cancer signaling pathways, ERBB (Lower Left) and
PMOM (Lower Right), inferred by GSSA. . . 118
6.7 Convergence of GSGA to the global solution using the IFGS compendium
List of Tables
5.1 F-Scores calculated for the GSGS approach with increasing percentage of gene sets
in the input (Row) and prior knowledge (Column). Networks: E. coli (Left Panel)
andIn silico (Right Panel). . . . . 90
5.2 Performance comparison of GSGS with four other pair-wise similarity based network
reconstruction approaches in terms of F-Scores. Upper and lower panels correspond
to using discrete and continuous data, respectively. For continuous data sample size
is 50. . . 95
5.3 Genes arranged in different layers in the hierarchial representation of the
ERBB signaling pathway available from the KEGG database. . . 99
6.1 The hierarchial arrangement of 87 genes from the ERBB signaling pathway
(Upper Panel) and 35 genes from the PMOM pathway (Lower Panel) available
from the KEGG database [67, 68]. These representations can be visualized
using Cytoscape [131]. . . 111
A.1 Comparison of GSSA and the Bayesian network methods in terms of F-Score
(Upper Panel) and computational time (Lower Panel). We used IFGS
com-pendium with 54 IFGSs. The lengths of IFGSs varied in the range 4−8. Time is shown in minutes. Here ‘*’ means Not Applicable. . . 165
A.2 Comparison of GSSA and the Bayesian network methods in terms of F-Score
(Upper Panel) and computational time (Lower Panel). We used IFGS
com-pendium with 108 IFGSs. The lengths of IFGSs varied in the range 4−7. Time is shown in minutes. Here ‘*’ means Not Applicable and ‘-’ indicates
A.3 Comparison of GSSA and the Bayesian network methods in terms of F-Score
(Upper Panel) and computational time (Lower Panel). We used IFGS
com-pendium with 195 IFGSs. The lengths of IFGSs varied in the range 4−10. Time is shown in minutes. Here ‘*’ means Not Applicable and ‘-’ indicates
that F-Scores could not be observed due to memory crash. . . 166
A.4 Comparison of GSSA and the Bayesian network methods in terms of F-Score
(Upper Panel) and computational time (Lower Panel). We used an IFGS
compendium with 723 IFGSs. The lengths of IFGSs varied in the range 4−12. Time is shown in minutes. Here ‘*’ means Not Applicable and ‘-’ indicates that
F-Scores could not be observed due to memory crash or large computational
List of Abbreviations and Acronyms
ANOVA Analysis of Variance
ARACNE Algorithm for the Reconstruction of Accurate Cellular Networks
BFS Breadth First Search
BIC Bayesian Information Criterion
BNT Bayes Net Toolbox
C3NET Conservative Causal Core Network
CDF Cumulative Density Function
cDNA Complementary DNA
CLR Context Likelihood of Relatedness
DAG Directed Acyclic Graph
DNA Deoxyribonucleic Acid
DPI Data Processing Inequality
DREAM Dialogue for Reverse Engineering Assessments and Methods
E. coli Escherichia coli
EM Expectation-Maximization
EMBL The European Molecular Biology Lab
ERBB Avian Erythroblastosis Oncogene B
GCRMA GeneChip RMA
GEO Gene Expression Omnibus
GGM Graphical Gaussian Model
GnRH Gonadotropin-Releasing Hormone
GSGA Gene Set Genetic Algorithm
GSSA Gene Set Simulated Annealing
HER Human Epidermal Growth Factor Receptor
IF Information Flow
IFGS Information Flow Gene Set
KEGG Kyoto Encyclopedia of Genes and Genomes
KNN K-Nearest Neighbors
MAS5 MicroArray Suite 5.0
MBEI Model-Based Expression Index
MCMC Markov Chain Monte Carlo
MI Mutual Information
MIM Mutual Information Matrix
MH Metropolis-Hastings Algorithm
MLE Maximum Likelihood Estimate
mRNA Messenger RNA
MRNET The Maximum Relevance Minimum Redundance Network
MSE Mean Squared Error
NCBI National Center for Biotechnology Information
NEM Nested Effects Models
PBN Probabilistic Boolean Network
PMOM Progesterone-Mediated Oocyte Maturation
PPI Protein-Protein Interaction
PPV Positive Predictive Value
RMA Robust Multi-Array Average
RN Relevance Network
RNA Ribonucleic Acid
SE Squared Error
Abstract
Rapid advances in high-throughput data acquisition technologies, such as microarrays
and next-generation sequencing, have enabled the scientists to interrogate the expression
lev-els of tens of thousands of genes simultaneously. However, challenges remain in developing
effective computational methods for analyzing data generated from such platforms. In this
dissertation, we address some of these challenges. We divide our work into two parts. In
the first part, we present a suite of multivariate approaches for a reliable discovery of gene
clusters, often interpreted as pathway components, from molecular profiling data with
repli-cated measurements. We translate our goal into learning an optimal correlation structure
from replicated complete and incomplete measurements. In the second part, we focus on the
reconstruction of signal transduction mechanisms in the signaling pathway components. We
propose gene set based approaches for inferring the structure of a signaling pathway.
First, we present a constrained multivariate Gaussian model, referred to as the
informed-case model, for estimating the correlation structure from replicated and complete
molecular profiling data. Informed-case model generalizes previously known blind-case model
by accommodating prior knowledge of replication mechanisms. Second, we generalize the
blind-case model by designing a two-component mixture model. Our idea is to strike an
optimal balance between a fully constrained correlation structure and an unconstrained one.
Third, we develop an Expectation-Maximization algorithm to infer the underlying correlation
structure from replicated molecular profiling data with missing (incomplete) measurements.
We utilize our correlation estimators for clustering real-world replicated complete and
in-complete molecular profiling data sets. The above three components constitute the first part
of the dissertation. For the structural inference of signaling pathways, we hypothesize a
transduc-tion events. We then propose two algorithms to reverse engineer the underlying signaling
pathway structure using unordered gene sets corresponding to signal transduction events.
Throughout we treat gene sets as variables and the associated gene orderings as random.
The first algorithm has been developed under the Gibbs sampling framework and the second
algorithm utilizes the framework of simulated annealing. Finally, we summarize our findings
and discuss possible future directions.
Keywords Replicated data, incomplete data, correlation, covariance matrix, multivariate
Gaussian mixture models, expectation-maximization (EM) algorithm, gene sets, Gibbs
Chapter 1
Background and Introduction
1.1 Molecular Profiling Measurements
Rapid advances in high throughput data acquisition platforms, such as microarrays [46, 82,
128] and next generation sequencing [99, 133], are bringing about a revolution in our
un-derstanding of biological complexity. It has become clear that genes do not function alone
but through complex biological pathways. Characterization of such intricate pathways can
provide deep insights into the biomolecular interaction and regulation mechanisms, which
pose several challenges to biology and genetics. Using traditional approaches, which mainly
focussed on one gene at a time, it was not feasible to survey the concerted activities of
multiple genes simultaneously. Emergence of high throughput technologies have enabled the
researchers to interrogate the expression profiles of tens of thousands of genes in a single
experiment. An enormous amount of data generated by such platforms can be accessed from
public repositories and databases, e.g. National Center for Biological Technology (NCBI)
Gene Expression Omnibus (GEO) [15], the European Molecular Biology Lab (EMBL)
Ar-rayExpress [115] and the Saccharomyces Genome Database (SGD) [54]. This has created
substantial interest among researchers in the development of effective methodologies for a
better understanding of fundamental cell functions and genetic causes of human diseases.
1.1.1 Microarray Experiments
Microarrays have become a standard tool for gene expression measurement in the biomedical
of an organism under different conditions. Microarrays are useful in a wide range of research
areas such as gene screening [120, 137], drug discovery [56, 63] and pathway analysis [39, 112,
113]. Some of the more familiar techniques used in the analysis of microarray data include
detection of differentially expressed genes [27, 60, 124], gene clustering [93, 94, 152], sample
classification and biomarker discovery [108, 153] and gene network inference [7, 20, 88, 155].
However, the outcome of any of these analyses is directly affected by the quality of gene
expression profiles under study. In general, the measurements generated from microarray
platforms are contaminated with excessive noise, which may be introduced at various stages
of a microarray experiment.
There are a sequence of steps involved in acquiring gene expression profiles using
microarray technology, which we briefly describe below:
Chip Manufacturing: A microarray is made of a solid surface on which strands of
polynu-cleotide, also known as probes, are attached or synthesized in fixed locations. Two popular
gene expression microarrays are: spotted or cDNA microarrays [128] and oligonucleotide
chips (Affymetrix GeneChips) [82]. In cDNA microarrays, probes are mechanically printed
on the slide and each probe, which is a cDNA fragment, represents one gene. In the case of
Affymetrix chips, probes are directly synthesized on the array. Each probe on a Affymetrix
chip is a DNA oligonucleotide. A set of sibling probes, referred to as a probe set, is used to
represent one gene.
Sampling and Labeling: A microarray experiment begins with the isolation of RNAs from the
subject cells. In cDNA microarrays, RNAs are extracted from both control and experimental
samples. RNAs are reverse transcribed into cDNAs. By in vitro transcription cDNAs are
converted to cRNAs, which are then labeled using fluorescent dyes of two different colors
(usually red and green). The labeled transcripts are called targets. Affymetrix microarrays,
on the other hand, are single channel platforms which use only one sample per chip.
Hybridization: The basic principles used in microarrays are: (1) DNA and RNA specifically
dance of a sequence. Hybridization is the process by which the labeled targets bind to the
probes on the array. After hybridization, microarray is washed to eliminate the portions of
unused targets.
Scanning and Imaging: The washed microarray is illuminated using a laser light that causes
the labeled targets to emit fluorescence. The emitted fluorescence is scanned and stored as
an image which consists of a grid of spots, one for each probe.
Data Acquisition: The image is transformed into numerical values to obtain raw intensities
for each probe. Before the raw data can be used for analysis, it is preprocessed using
background correction and normalization. Background correction is used to correct the
processing effects on the array and make adjustments for cross-hybridization (non-specific
bindings). Normalization is used for reducing the within or between array variations. After
this step, a matrix comprising of relative or absolute mRNA abundance levels is obtained,
which is used for bioinformatics analysis.
Fig. 1.1 demonstrates a step-by-step procedure used in both cDNA and Affymetrix
microarray experiments. It is worth mentioning here that the methodologies developed in
this dissertation are not restricted to microarray data. They are applicable to other
molec-ular profiling data, such as proteomics data. In the following chapters, however, we have
illustrated the performance of our methods using molecular profiling measurements
gener-ated from Affymetrix microarray technology. Compared with other microarray platforms,
Affymetrix microarrays are often preferred due to a number of reasons:
• Affymetrix microarray is a single-color oligonucleotide array, which results in a simpli-fied experimental design.
• As opposed to using a single long probe, Affymetrix microarrays use a set of short sibling probes for representing a gene. This leads to an increased sensitivity and
specificity.
result, the effect of localized artifacts is reduced.
• Affymetrix microarrays have increased throughput and reproducibility.
• A wide range of computational tools are easily available for analyzing Affymetrix mi-croarray data.
1.1.2 Replicated Molecular Profiling Data
Replication is commonly used in biomedical experiments to account for the inherent
vari-ability and noise in data. The necessity and benefit of replication is more pronounced for
high throughput experiments, where data are often exposed to excessive noise. Even in the
case of more accurate next-generation deep sequencing data [134], there still exist multiple
sources of uncertainty deriving from fragmentation bias, base calling, short-read aligning and
short-read counting based on the error-prone genome annotation [99].
The following two types of replications are commonly used in high throughput
experi-ments: biological replicationandtechnical replication [10]. Biological replication corresponds
to the type where measurements from multiple cases are considered, e.g. samples collected
from different breast cancer patients. In technical replication, multiple replicates of the same
biological replicate are used, e.g. replicated spots representing the same gene on a chip or
different aliquots of the same sample used in different chips. Biological replication is useful
to measure the variability across population, whereas technical replication is employed for
estimating measurement level variability.
The replication mechanism used in underlying experimental design may be either
blind or informed to the data analysts. A good example of the former is the Affymetrix
GeneChip [82], where 11 perfect match probes are designed against the 3-prime end of mRNA
to interrogate the abundance level of the same gene, although a mixture of gene isoforms can
exist. For this reason they are general-sense replicates with blind replication mechanism and
5 10 15 20
0
2
4
6
Sample Index
Gene Expression
5 10 15 20
0
5
10
15
Sample Index
Gene Expression
BeadArray [46] and deep sequencing based Genome Analyzer II [134], where 6−12 samples of whole-genome gene expression are simultaneously profiled for each chip/run. Both biological
replicates and/or technical replicates can be used for each chip/run. For this reason they can
be treated as narrow-sense replicates with informed replication mechanisms. In many cases,
replicates with blind mechanism can be nested within the ones with informed mechanism,
and vice versa [70].
Both blind and informed replication mechanisms must be considered for a robust
pattern analysis of replicated molecular profiling data. For instance, Fig. 1.2 presents two
gene sets with the same number of replicated measurements but with different replication
mechanisms. As demonstrated in the figure, the corresponding true correlation structures
capture the replication mechanisms and are different from each other. In addition to diverse
replication mechanisms used in experimental design, high throughput molecular profiling
data may also be incomplete, i.e. data may contain a small to large percentage of missing
values [81]. Incompleteness may arise due to various reasons such as sample
contamina-tion, cross-hybridizacontamina-tion, high background noise combined with low signal. In some high
throughput molecular profiling experiments such as mass-spectrum, the ratio of missing
val-ues can be as high as 30%. Clearly, incomplete replicated measurements present obstacles
for further data analysis. It is necessary to design computational frameworks for a reliable
pattern discovery from replicated complete and incomplete measurements with both blind
and informed replication mechanisms [1, 4, 158, 161].
1.2 Pathway Analysis
Molecular profiling measurements generated from microarray experiments are usually in
the form of large matrices of gene expression levels measured under different conditions.
These measurements only act as a source for investigating biological complexity, they do not
themselves reveal the whole picture of this complexity. A follow-up data analysis must be
data. However, gaining biological insights from genome-wide measurements is challenging
due to the complexity of biological systems (large number of biomoleculesp) and availability
of an insufficient amount of data that estimate the complex dependency structure (small
sample size N), a problem referred to as the curse of dimensionality [49]. Therefore, an
initial characterization of molecular profiling data is required to organize genes into smaller
groups on the basis of their expression profiles. Individual gene groups are then analyzed for
their potential role in biological pathways.
Pathway-level analysis is the key to make biological inferences and hypothesis from
molecular profiling data. A biological pathway represents the biological reactions and
biomolec-ular interaction mechanisms within a cell. In recent years, many annotated biological
path-ways and tools for their analysis have become increasingly available due to rapid
advance-ments in high-throughput data acquisition methods [30,57,68,140,145]. However, our current
knowledge about the signal transduction activities in a cell, which affects gene expressions
via downstream transcription factors, is quite limited. For example, the signaling pathway
structures available from public databases may not represent a complete picture of
under-lying signal transduction events among genes that are already known to be related to the
pathway. There might exist additional mechanisms among genes present in the pathways.
Moreover, the pathways in databases are often generic, whereas scientists are many times
interested in learning context-specific signaling pathway structures. We categorize
signal-ing pathway analysis into the followsignal-ing two subproblems: (1) which genes are related to a
signaling pathway and (2) how the genes within a pathway interact with each other.
1.2.1 Structure of Signaling Pathways
Structural study of signaling pathways is important to improve our understanding of
fun-damental cell functions, e.g. growth, metabolism, differentiation and apoptosis, which are
driven by simultaneous action of several cascades of reactions from the cell surface to the
encoded in double stranded DNA. The information stored in DNA is transferred to single
stranded messenger RNA (mRNA) to direct protein synthesis. Signal transduction activities
in a pathway are the primary mean to control the passage of biological information from
DNA to mRNA with mRNA directing the synthesis of proteins.
A signaling pathway comprises of several overlapping signal transduction events among
a set of biomolecules (usually proteins) upstream of transcription factors. Signal
transduc-tion events in a pathway are triggered by the binding of external ligands (e.g. cytokine
and chemokine) to the transmembrane receptors. This binding results in sequential
acti-vations of signaling molecules, such as cytoplasmic protein kinase, to lead to a biological
end point (transcription factor). Since activation of signaling pathways affects gene
expres-sions via transcription factors, it is necessary to understand signal transduction mechanisms
upstream of transcription factors.
In an abstract sense, the structure of a signaling pathway can be described as a
di-rected graph, where each node represents a protein and a didi-rected edge represents the passage
of information from one node to another node. Inference of such directed network topologies
is a major challenge in systems biology [24, 122]. Some of the popular pathway databases
that comprise of manually curated pathway maps representing our current knowledge on
biological networks include KEGG (www.genome.jp/kegg), BioCarta (www.biocarta.com)
and NCBI BioSystems (www.ncbi.nlm.nih.gov/biosystems). For a more comprehensive
list of web-accessible biological pathway and network databases, we refer to [12].
1.2.2 Identification of Signaling Pathway Components
For inferring the structure of a signaling pathway, it is first necessary to identify the set
of genes that comprise the pathway. Gene clustering [93, 94, 152] is often one of the first
steps used in the identification of pathway components. Gene clustering is a simple data
partitioning approach for organizing genes in different groups, where genes within a group
clustering are often easier to interpret. Another advantage of gene clustering is its
applica-bility in the absence of any prior knowledge about data, such as the functions of individual
genes. Some of the popular gene clustering algorithms include: Hierarchial clustering [34],
K-means clustering [48] and model-based clustering [90].
A number of other supervised and unsupervised learning algorithms used in the
iden-tification of pathway components are differential expression analysis [27, 60, 124], matrix
factorization schemes [17, 72], co-expression networking combined with network
partition-ing [19, 155, 156] and others [52, 142]. Gene lists obtained by an application of any of the
aforementioned approaches represent candidate pathway components. The candidate gene
lists are statistically tested for their biological significance using over-representation
analy-sis [33, 71] to identify gene ontology terms that are over-represented in the candidate list or
functional class scoring [140,145] which incorporates functional indicators of the genes. This
process leads to the discovery of signaling pathway components.
In general, the discovery of biologically meaningful pathway components is highly
dependent on the computational approach used in their identification. Since the choice of
an approach is often problem specific, a more crucial issue is the use of a reliable metric
which can be employed to learn the dependencies among genes in a pathway and can be
easily accommodated by diverse pathway learning techniques. Indeed, correlation is one
such measure that captures the functional relationships among genes and facilitates the
identification of pathway components.
Correlation is at the core of many supervised and unsupervised pattern analyses
ap-proaches. In unsupervised learning, many gene clustering algorithms group genes on the
basis of their correlation structure [34, 55, 151, 152]. Correlation structure is also employed
by many gene networking algorithms to determine the presence or absence of network edges,
which is a strong indicator of the functional relevancy between a pair of genes. However,
similar to the case of high-dimensional molecular profiling data, it is difficult to draw
abstract of a representation for a particular biological process of interest. Therefore,
learn-ing a finer level of detail from large-scale biological networks is often of more interest to the
scientists. As a result, co-expression networking is followed by an application of network
clustering [69, 84, 156] or community detection algorithms [5, 73, 78, 105–107, 111]. The
re-sulting subnetworks are interpreted as functional modules or signaling pathway components.
In terms of supervised learning, the performance of various model-based classification
meth-ods [49], e.g. linear and quadratic discriminate analysis, relies on an accurate estimate of
the population correlation structure. These analyses may further be used to learn pathway
components and context-specific gene networks in disease groups [39, 103].
1.3 Previous Works and Current Challenges
In this dissertation, we develop methodologies to address two major problems in
compu-tational systems biology: (1) estimation of an optimal correlation structure which plays a
crucial role in the identification of pathway components and (2) reconstruction of signaling
pathway structures demonstrating the signal transduction activities in the pathway
compo-nents.
1.3.1 Correlation-Based Discovery of Pathway Components
As discussed earlier, estimation of an optimal correlation structure is essential for a reliable
discovery of pathways from molecular profiling data. However, the existing approaches
for inferring population correlation structure do not automatically accommodate replicated
measurements. Often, a data preprocessing step of averaging over replicated measurements
followed by the estimation of bivariate correlation, such as Pearson correlation coefficient,
is used [59, 151, 152]. Averaging is not completely satisfactory since it creates a strong bias
while reducing the variance among replicates of diverse magnitudes. Averaging may also
lead to a significant amount of information loss. For example, useful information including
In one-gene-at-a-time analyses for detecting differentially expressed genes between
categorical phenotypes (e.g. healthy versus cancer tissues), replicates are sufficiently
ex-ploited by using Analysis of Variance (ANOVA) type methods, e.g. [70, 147]. However,
this type of analysis identifies differentially expressed genes between two phenotypes or
ex-perimental conditions without considering the complicated regulatory relationships among
genes, which is often reflected in gene-gene correlation structure. Correlation-based analysis,
e.g. hierarchical clustering [34, 55], differential correlation [132] and co-expression
network-ing [16, 18, 19, 85, 88, 116, 125, 149, 155, 156], are viable multi-gene approaches to decipher
underlying gene regulatory mechanisms and to infer functional modules or pathway
com-ponents. With few exceptions, the existing clustering and networking algorithms do not
explicitly accommodate replicated measurements. Commonly, replicates are averaged (e.g.
weighted [59], un-weighted or something in between [151]) or, for Affymetrix data,
sum-marized (e.g. RMA [64], GCRMA [150], MAS5 [58] and Model-Based Expression Index
(MBEI) [81]). The averaging and summarizing are necessary since the mean of the
repli-cates is one of the primary interests in one-gene-at-a-time analysis.
In multi-gene clustering and networking analysis, the primary interest is often to
esti-mate a scale-free correlation structure among genes that does not depend on the abundance
level of each individual replicate (Fig. 1.3). Expression patterns derived from low abundance
profiles can be just as important as those derived from high abundance ones. Averaging or
summarizing over replicates of diverse magnitude might wipe out important patterns of low
magnitude and/or cancel out patterns of similar magnitude. The averaging or
summariz-ing procedure, originally targeted for differential expression analysis, becomes a nuisance in
gene clustering and networking analysis. The situation is even worse when the replication
mechanisms used in underlying experimental design is available a priori or the replicated
measurements contain a small to large percentage of missing values.
With few exceptions, e.g. [93, 94, 158], the existing gene clustering and networking
5 10 15 20
−2
0
2
4
6
Similar Means (correlation = 0.6)
Sample Index
Magnitude of Profiles
5 10 15 20
−2
0
2
4
6
Slightly Different Means (correlation = 0.6)
Sample Index
Magnitude of Profiles
5 10 15 20
−2
0
2
4
6
Moderately Different Means (correlation = 0.6)
Sample Index
Magnitude of Profiles
5 10 15 20
−2
0
2
4
6
Largely Different Means (correlation = 0.6)
Sample Index
Magnitude of Profiles
The increased power of detecting hidden patterns in data is achieved by sufficiently exploiting
the replicates, which has been demonstrated using infinite Bayesian mixture models [93, 94]
and parsimonious (or blind-case) multivariate Gaussian models [158]. In the infinite mixture
model approach, authors used both an elliptical model that allows within-replicate variation
across difference samples to be different and a spherical model that does not. The authors
showed that approaches using information about the within-replicate variability (elliptical
and spherical models [94]) generally outperform the averaging or summarizing approaches. In
the parsimonious multivariate Gaussian models, authors proposed a parsimonious correlation
model [158] that shares a similar spirit to the Bayesian elliptical or spherical model approach
[94] in that both approaches explicitly consider each replicate, individual variability and their
relationships.
Nevertheless, none of the two approaches are ready to analyze replicated and/or
incomplete molecular profiling data with a prior known experimental design information.
Therefore, it is necessary to design new computational paradigms for an accurate estimation
of the correlation structure that allows biomedical researchers to sufficiently exploit
repli-cated complete and incomplete measurements with or without prior knowledge of replication
mechanism. This, in turn, is expected to give rise to a reliable discovery of pathway
com-ponents (Fig. 1.4). It is one of the two major contributions of this dissertation to
address this challenge.
1.3.2 Reconstruction of Signaling Pathway Structures
Reconstruction of signaling pathway structures is essential to decipher complex regulatory
relationships in living cells. Characterization of complicated interaction patterns in
sig-naling pathways can provide insights into biomolecular interaction and regulation
mecha-nisms. Consequently, there have been a large body of computational efforts for
reconstruct-ing signalreconstruct-ing pathway structures usreconstruct-ing Probabilistic Boolean Networks (PBNs) [135, 136],
Multivariate Innovation Bivariate Routine Replicated Molecular Profiling Data
Example: Affymetrix probe-level expression profiles (Genes i,j,k,l)
Minimum Spanning Tree
Hierarchical Clustering Self-Organization Map
K-means Clustering
Correlation Network Correlation Structure
Models [32, 75, 125, 126] and other approaches [38, 143, 144, 148, 155].
Although the existing approaches are useful, they often represent a phenomenological
graph of the observed data. For example, a parent set of each gene in Bayesian networks
indicates statistically causal relationships. In addition, the accuracy of a learned Bayesian
network is determined by the choice of the number of parents for each node, a metric used
to score a structure and other parameters set to alleviate the non-trivial computational
bur-dens associated with Bayesian network inference. Mutual information networks, graphical
Gaussian models and boolean networks are computationally tractable even for large
signal-ing pathways, however the co-expression criteria used in mutual information networks and
graphical Gaussian models only models a possible functional relevancy, whereas the use of
boolean functions in boolean networks may lead to an oversimplification of the underlying
gene regulatory mechanisms. Moreover, the aforementioned approaches do not explicitly
consider signal transduction events characterizing a signaling pathway. Signal transduction
events refer to directed linear cascades of reactions from the cell surface to the nucleus and
form the basic building blocks of a signaling pathway. It is, therefore, necessary to design
computational approaches for the structural inference of signaling pathways by incorporating
signal transduction mechanisms.
With few exceptions in the field of communication networks, the existing network
in-ference approaches do not explicitly accommodate signal transduction events. The frequency
method in [118] assumes a tree structure in the paths between pairs of nodes (genes).
How-ever, the method is subjected to fail in the presence of multiple paths between the same
pair of nodes. The cGraph algorithm presented in [76] adds weighted edges between each
pair of nodes that appear in some set of gene co-occurrence and so the networks inferred by
this approach might contain a large number of false positives. The EM approach [119, 157]
treats permutations of genes in a signal transduction as missing data and infers a network by
assuming a linear arrangement of genes along with a prior knowledge of two end nodes. It is
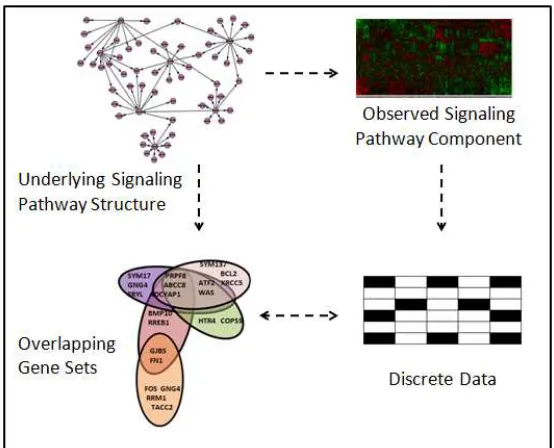
Figure 1.5: Representation of a gene set compendium as binary discrete data andvice versa.
mentioned above.
A central aspect of developing such network reconstruction approaches is to
under-stand the structure of signaling pathways, which are an ensemble of several overlapping
signal transduction events with a linear arrangement of genes in each event. Overlapping
arises from simultaneous participation of genes in many biological processes. In the present
context, we refer to the set of genes in a signal transduction event as an information flow
gene set (IFGS). Thus, an IFGS only reflects which genes participate in a signal
trans-duction event, but not their ordering. The underlying signaling pathway structure can be
reconstructed by inferring the order of genes in each IFGS.
An IFGS can also be interpreted as a discrete set of genes expressed in an
experi-ment, whereas an IFGS compendium comprises of many overlapping gene sets corresponding
to different experiments. With this understanding, an IFGS based approach can be
com-pared with other network inference algorithms which accommodate discrete measurements,
such as Bayesian networks [26, 37, 130] and mutual information networks [7–9, 19]. Fig.
1.5 sketches the equivalence between an IFGS compendium and binary discrete molecular
expressed) of genes in a gene set. However, an IFGS approach may be more suitable for
capturing higher order signal transduction mechanisms as opposed to pairwise interactions
or causal interactions. Compared with other network inference approaches which utilize
con-tinuous molecular profiling data, an IFGS approach may be more robust to noise and may
facilitate data integration from multiple data acquisition platforms.
It is also worth mentioning the difference between the concept of an IFGS presented
here and a gene signature used in the literature. A gene signature usually corresponds to a
set of genes with combined pattern of expression downstream of transcription factors and is
often linked to a given biological state of interest. An IFGS, on the other hand, represents a
set of molecules (usually proteins) in a signaling pathway upstream of transcription factors
which participate in a signal transduction event in the pathway. Moreover, IFGSs related
to a signaling pathway indicate the existence of an underlying structure, whereas a gene
signature may only correspond to a set of functionally relevant genes without suggesting
the presence of a structure. Gene signature based analysis has received much attention in
recent years. The relative advantages of working with gene signatures in bioinformatics
analyses have been adequately demonstrated [112, 113, 121, 140]. They have also been used
to dissect drug mechanism of action and to find transcriptional connections among genes,
drugs and diseases [63, 77]. However, signaling pathway structure inference by sufficiently
exploiting gene sets corresponding to signal transduction mechanisms, a promising area of
bioinformatics research, remains underdeveloped. It is the second major contribution
of this dissertation to address this challenge.
1.4 Outline of Dissertation
The goal of this dissertation is to develop novel methodologies for inferring gene association
and regulation patterns from molecular profiling data. The work presented here is composed
of two parts. The first part presents a sequence of multivariate approaches leading to a
molecular profiling data. Our approach is to learn an optimal correlation structure from both
replicated complete and incomplete molecular profiling data (Fig. 1.4). In the second part,
we address the problem of inferring the structure underlying a signaling pathway component.
We develop algorithms by treating gene sets corresponding to signal transduction activities
in a signaling pathway as the basic building blocks of the underlying structure (Fig. 1.5).
In Fig. 1.6, we sketch a flowchart of the problems considered in this dissertation. In
Chapters 2 and 3, we develop two generalized multivariate correlation estimators for pattern
discovery from replicated and complete molecular profiling data. In Chapter 2, specifically,
we present a correlation estimator by explicitly taking into account the prior knowledge of
replication mechanisms. We further generalize this correlation estimator in Chapter 3 by
designing a finite mixture model. Chapter 4 deals with the problem of inferring correlation
structure from replicated and incomplete molecular profiling data. We consider replicated
and incomplete measurements with either blind or informed replication mechanisms and
develop an EM algorithm to estimate the correlation structure. In Chapters 5 and 6, we
present two gene set based algorithms to infer underlying signaling pathway structure in a
given pathway component. Chapter 5 presents a sampling based approach by employing
the Gibbs sampling framework, whereas Chapter 6 presents a search strategy under the
framework of simulated annealing. Finally, in Chapter 7, we summarize our findings and
discuss future works.
1.5 List of Publications
Peer-reviewed Journal Papers
Zhu D,Acharya L and Zhang H. A generalized multivariate approach to pattern discovery
from replicated and incomplete genome-wide measurements, IEEE/ACM Transactions on
Computational Biology and Bioinformatics (TCBB), 8(5):1153-1169, 2011.
reconstruct signaling pathway structures from gene sets, Accepted to appear in IEEE/ACM
Transactions on Computational Biology and Bioinformatics (TCBB), PreprintarXiv:1101.
3983v3.
Acharya L, Judeh T, Wang G and Zhu D. Optimal structural inference of signaling pathways
from overlapping and unordered gene sets, Submitted toBioinformatics, Revised Aug 2011.
Book Chapters
Acharya L and Zhu D. Multivariate models and algorithms for learning correlation
struc-tures from replicated molecular profiling data, In a chapter of the bookAdvanced Biomedical
Engineering, InTech 2011.
Acharya L, Judeh T and Zhu D. A survey of computational approaches to biological network
reconstruction and partition, To appear in a chapter of the bookMachine Learning Approach
for Network Analysis: Novel Graph Classes for Classification Techniques, Wiley Publisher
2011.
Peer-reviewed Conference Papers
Acharya L, Judeh T, Duan Z and Zhu D. A novel computational framework to reconstruct
gene regulatory networks, In the proceedings of Biotechnology and Bioinformatics
Sympo-sium (BIOT), 80-81, 2010.
Judeh T, Acharya L and Zhu D. Gene network inference via linear path augmentation, In
the proceedings ofBiotechnology and Bioinformatics Symposium (BIOT), 46-48, 2010.
Acharya L and Zhu D. Estimating an optimal correlation structure from replicated
molec-ular profiling data using finite mixture models, In the proceedings of IEEE International
Conference on Machine Learning and Applications (ICMLA), 119-124, 2009.
Zhu D, Xu G and Acharya L. A generalized multivariate approach for correlation-based
pattern discovery from replicated molecular profiling data, In the proceedings of IEEE
Chapter 2
Learning Correlation Structures from Replicated and
Complete Molecular Profiling Data I
2.1 Introduction
Estimation of an optimal correlation structure is crucial in the pattern analyses of replicated
molecular profiling data. Many of these analyses facilitate the identification of pathway
com-ponents, such as gene clustering [34, 93, 94, 151, 152], co-expression networking [20, 125, 155]
combined with network partitioning [5, 69, 105–107, 156] to discover network modules. With
few exceptions [93, 94, 158], however, the current approaches for estimating the correlation
structure from molecular profiling data do not automatically accommodate replicated
surements. Often, a preprocessing step of summarizing or averaging over replicated
mea-surements is used to reduce the multivariate structure of replicated data into a bivariate
one [151, 152]. Bivariate data fits into the framework of pairwise correlation analysis, e.g.
Pearson’s correlation, which is simple in approach and is achievable at a very low
com-putational cost. However, summarizing or averaging may lead to a significant amount of
information loss due to diverse magnitudes of replicated measurements. The situation is
worse when the experimental design that explains the replication mechanism of molecular
profiling data is knowna priori but this information is not exploited in the pattern analysis.
Therefore, it is necessary to develop computational methods by exploiting each replicate
In this chapter1, we present a generalized multivariate model for estimating the
corre-lation structure of a gene set with replicated and complete molecular profiling measurements.
The proposed model, referred to as the informed-case model, generalizes previously known
parsimonious or blind-case correlation estimator [1,4,158] by accommodating prior knowledge
of replication mechanisms. In many cases, prior knowledge of the number of biological and
technical replicates used in underlying experimental design may be known. A straightforward
application of blind-case model, which does not distinguish between biological replicates of
a gene, may not exploit all underlying information within data. Informed-case model, on
the other hand, explicitly incorporates a prior known replication mechanisms in its setting
and considers different parameters for different biological replicates of a gene.
Throughout this chapter, we follow and extend the path of blind-case approach. The
main reasons are as follows: (1). blind-case model presents a parsimonious multivariate
correlation estimator and a closed-form formula for each pair of genes, which successfully
alleviates the computational burden derived from dimensionality. Other approaches, such
as infinite Bayesian mixture models [93, 94], often represent a computationally daunting
task, especially for high dimensional data with an increased number of genes and replicates.
(2). blind-case model uses a scale-free correlation structure to separate the estimate of
correlation between replicates (the primary interest) from the estimate of within-replicate
variability (nuisance). These advantages make the blind-case approach more suitable than
infinite Bayesian mixture models for analyzing replicated measurements with large
within-replicate variability. However, neither of them are ready to analyze within-replicated molecular
profiling data with a prior known experimental design.
2.2 Notations
Throughout this chapter, G1, . . . , Gk denote arbitrary biomolecules with gijl as their
respec-tive abundance levels in the ith replicate (row) and jth sample (column), for l = 1, . . . , k,
where the abundance levels are measured over n independent samples. Further, we
as-sume that ml replicated measurements are available for Gl in each sample, l = 1, . . . , k.
The jth column of the given replicated data set is written as Z
j = (Zj1, . . . , Zjk)T =
(g1
j1, . . . , gjm1 1, . . . , g
k
j1, . . . , gjmk k)
T, j = 1,2, . . . , n, and is assumed to be an independently
and identically distributed sample from a multivariate normal distribution with Pkl=1ml
random variables.
2.3 The Existing Blind-Case Approach
2.3.1 The Model
We first review the existing blind-case model for estimating the correlation structure of a gene
set with replicated and complete measurements. Blind-case model was introduced in [158]
and further studied in [1,4]. In this model, each replicate is treated individually as a random
variable and data are assumed as random samples from a multivariate Gaussian distribution,
which we denote by N(µB,ΣB). We designate the model as ‘blind’ since it imposes a fixed
number of correlation parameters in the underlying correlation structure. The parameters
for the blind-case model are defined as
µB =
µB g1em1
.. .
µB gkemk
(2.1)
where µB
gi is a scalar and emi = (1, . . . ,1)
T is a vector of size m
i ×1, for i = 1, . . . , k. The
correlation matrix ΣB is of size Pk
i=1mi× Pk
ΣB =
1 . . . ρ11 . . . ρ1k . . . ρ1k
..
. . .. ... ... . .. ...
ρ11 . . . 1 . . . ρ1k . . . ρ1k
... . .. ... ... . .. ...
ρk1 . . . ρk1 . . . 1 . . . ρkk
..
. . .. ... ... . .. ...
ρk1 . . . ρk1 . . . ρkk . . . 1
= ΣB
g1g1 . . . Σ
B g1gk
..
. ... ...
ΣB g1gk
T
. . . ΣB gkgk
. (2.2)
In Eq. 2.2, ΣB
gigj represents a submatrix of size mi ×mj, which is defined in terms of a
single correlation parameter ρij. When i = j, the parameters ρij’s correspond to
within-molecular correlation. Otherwise, they represent between-within-molecular correlations. Due to
the symmetric nature of a correlation matrix, we assumeρij =ρji. From a practical point of
view, between-molecular correlations are more important. Within-molecular correlations, on
the other hand, are indicative of data quality. Higher values of within-molecular correlations
represent cleaner data.
2.3.2 Parameter Estimation
For estimating model parameters from replicated measurements, blind-case approach
fol-lows the path of maximum likelihood estimation. Maximum likelihood estimates (MLEs)
are frequently used in parameter estimation problems when the underlying distribution is
multivariate normal [21]. In such cases, MLEs often have some optimal properties. For
When n >Pki=1mi, the likelihood function can be written as
L(µB,ΣB) =
n
Y
j=1
N(Zj|µB,ΣB) =
1
(2π)12( Pk
i=1mi)n
|ΣB|12n
e[−12 Pn
j=1(Zj−µB)
T
ΣB−1(Zj−µB)]
.
(2.3)
The MLE’s are obtained by maximizing L with respect to µB and ΣB. This is achieved by
solving
dL/dµB
gl = 0, (2.4)
for l= 1, . . . , k and
dL/dΣB = 0, (2.5)
where L= logL. This leads to
ˆ
µBgl = 1
n 1 ml n X j=1 ml X i=1
glij (2.6)
for l= 1, . . . , k. Thus, the MLE of µB is
ˆ
µB =
ˆ µB g1em1
... ˆ
µB gkemk
. (2.7)
The MLE of ΣB is given by
ˆ ΣB = 1
n
n
X
j=1
(Zj −µˆB)(Zj−µˆB)T. (2.8)
Since the parameters ˆρij’s may not be tractable in practice, they are estimated using
ˆ
ρij =Avg( ˆΣBij), i, j = 1, . . . , k. (2.9)
biomolecules, the representation of blind-case model in Eq. 2.1 and Eq. 2.2 coincides with
the one presented in [158], which is defined in terms of two within-molecular and one between
molecular correlation parameters.
Blind-case model is simple in approach and is especially useful in the case of
repli-cated measurements with no prior knowledge of underlying replication mechanisms. Since
the MLEs of model parameters are represented in closed-forms, blind-case approach also
benefits from a much reduced computational load than other multivariate approaches, such
as infinite Bayesian mixture models [93, 94]. However, blind-case model suffers from two
major limitations. First, it may simplify the correlation structure of a gene set with many
pairwise gene correlation structures (Eq. 2.2) and second, the model may be overly
con-strained for some replicated data, e.g. data with a prior known replication mechanism. To
overcome these issues, it is necessary to consider a more relaxed multivariate model.
2.4 Informed-Case Approach
2.4.1 The Model
In this section, we design a multivariate model for estimating the correlation structure from
replicated and complete molecular profiling measurements corresponding to a gene set with
a prior known replication mechanism. For simplicity, we illustrate the model for the case of 2
genesG1 andG2, where 3 biological replicates with 2 technical replicates nested within each
biological replicate are available for both G1 and G2. Throughout we assume that data are
independently and identically distributed samples from a multivariate normal distribution
N(µI,ΣI). In the above specified case, Z
j’s follow a 12-variate normal distribution with
µI = µ1g1, µ1g1, µg21, µ2g1, µ3g1, µ3g1, µ1g2, µ1g2, µ2g2, µg22, µ3g2, µ3g2T , (2.10)
a 12×1 vector defined in terms of 6 parameters. The correlation matrix ΣI is of size 12×12