ISSN 0975-928X
Research Article
Evaluation and identification of wheat hybrids for wider adaptability
R a k h i S i n h a a n d R . S . S h u k l a
Department of Plant Breeding & Genetics, Jawaharlal Nehru Krishi Vishwa Vidyalaya, Jabalpur (M.P.)
E-mail: [email protected]
(Received: 08 Nov 2016; Revised: 18 Aug 2017; Accepted: 25 Aug 2017)
Abstract
The experimental material comprising F1, F2, BC1 and BC2 generations derived from crosses involving five parents were evaluated to find out stability in bread wheat under four environments. The differences among the crosses were significant for most of the characters studied except ear length, number of spikelets per spike, spike weight per plant, biological yield, harvest index and grain yield per plant. Among environment + varieties x environment interaction significant differences were found for characters such as days to 50% flowering, plant height, number of tillers per plant, number of spikelets per spike and harvest index. The differences for environments were significant for most of the characters except number of tillers per plant, number of grains per spike, spike weight per plant, biological yield, harvest index and grain yield per plant. Further stability analysis revealed that most of the genotypes showed varying stability for different crosses, generations and characters. Cross HI 1500 x HD 2868 was found stable over environments for yield per plant while cross M3020 x NI 5439 and HD 2868x HI 1500 was found stable for harvest index.
Key words
Wheat, stability, G x E interaction, grain yield
Introduction
Wheat is the most important staple food for humans. Approximately one-sixth of the total arable land in the world is cultivated with wheat. Wheat is grown under wide range of climatic conditions but adapted to cool and dry environment. The global area under wheat comes to 226.95 m. ha and contributes to the extent of about 27% of the total food grain production. It is staple food for nearly 40 per cent of world population covering at least, 43 countries and provides 20 per cent of food calories to the mankind. In Madhya Pradesh, wheat shares major area of rabi crops about 62-65 percent, mainly grown in partial irrigated condition (1-2 irrigation). The area production and productivity (2014-15) of wheat in M.P. are 5.56 million hectares, 14.18 million tons and 2551 kg/ha, respectively. The productivity of wheat in M.P. is estimated to be 2.5 tonnes/ha, which is quite low in comparison to productivity at national level (2.9 tons/ha.). The objective in many plant breeding programmes is the selection of genotypes which give consistent performance over a wide range of environments. The selection is often ineffective due to lack of information on genotype x environment. In the present study an effort was made to identify suitable crosses having stability and wider adaptability for different environments.
Materials and Methods
The experimental material consisted of F1, F2, BC1 and BC2 generations derived from the crosses made between 5 diverse parents viz. MP 3020, NI 5439, HD 2868, HI 1500 and HD 2889. Experiment was conducted in four environments
viz. irrigated condition 2012-13, rainfed 2012-13, irrigated condition 2013-14, rainfed 2013-14. The
experiment was laid out in randomized complete block design with 4 replications; one row of P1, P2, F1, BC1, BC2 and twenty rows of F2 generation in each of the four crosses (MP 3020× NI 5439, HD 2868× HI 1500, HI 1500× HD 2868 and HI 1500× HD 2889) in each replication were grown, under rainfed and irrigated condition. The observations were recorded in 10 randomly selected plants in each replication of all the generations raised for 12 characters viz. days to 50 % flowering, days to maturity, plant height (cm), number of tillers/ plant, ear length (cm), number of spikelets per spike, number of grains per spike, spike weight per plant (g), grain yield per plant (g), 1000-grain weight (g), biological yield (g) and harvest Index (%). The data were statistically analysed to find out adaptability of hybrids using Eberhart and Russell model.
Results and Discussion
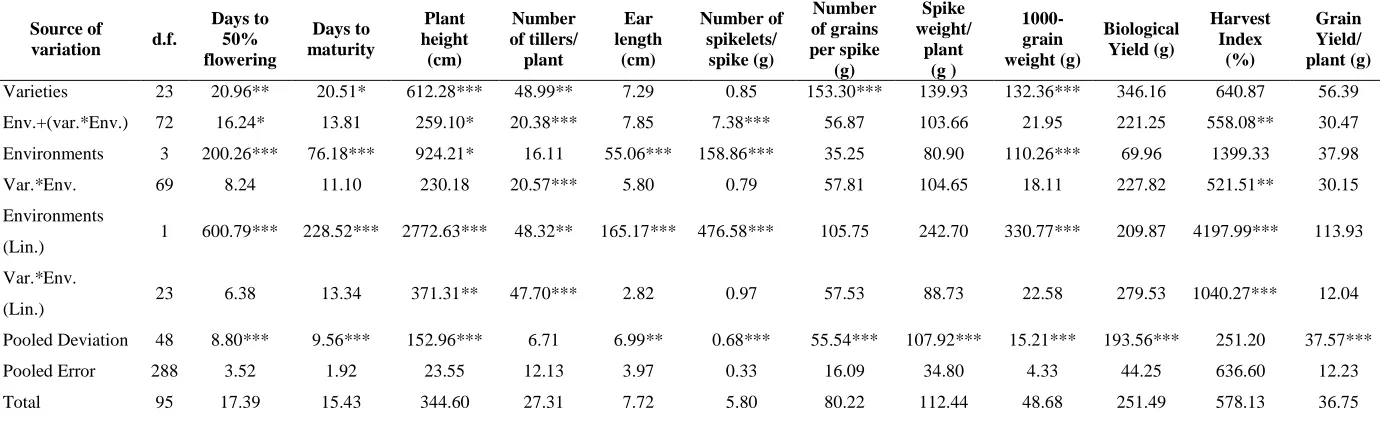
The variation due to variety x environment (linear) interaction had showed significant differences for plant height, number of tillers per plant and harvest index (Table 1). Similarly pooled deviation was found significant for all characters except number of tillers per plant and harvest index. The above results are in agreement with the finding of Bangarwa and Luthra(1966).
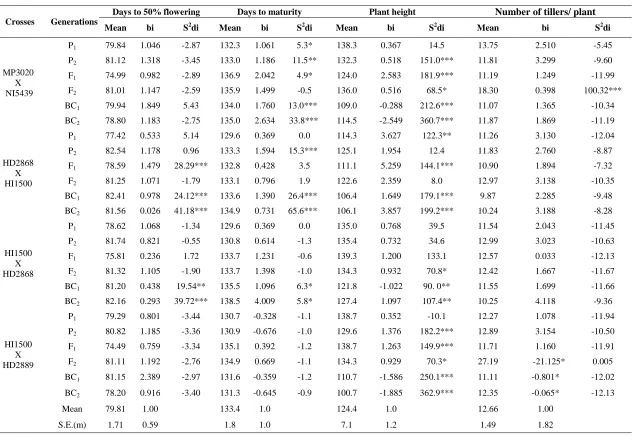
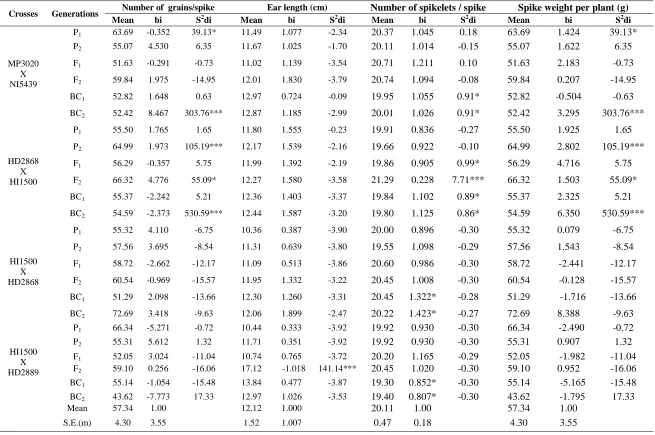
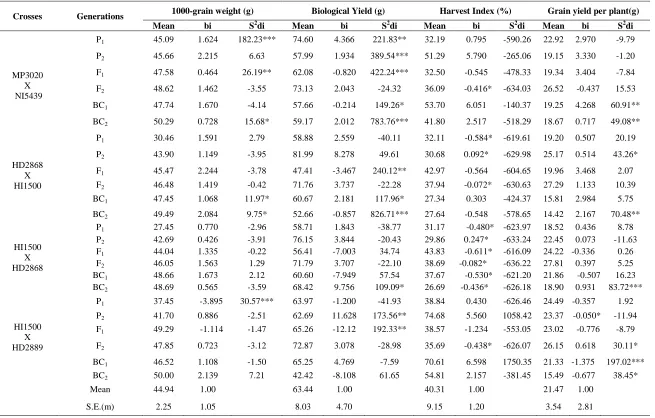
The stability parameters such as mean (m), regression coefficient (bi), deviation from regression (S2di) for all twelve characters of each generation were estimated and are presented in table 2 to 4.
ISSN 0975-928X
generations and characters. In cross HD2868 x HI1500 parent P1, cross HI1500 x HD2868 parent P2, generationF1 and backcrosses BC1 and BC2 for days to 50 % flowering, for days to maturity (Table 2) in cross HD2868 x HI1500 P1 F1 F2, cross HI1500 x HD2868 parents P1 P2, cross HI1500 x HD2889 parents P1 P2 F1 F2 BC1 and BC2, for plant height in cross MP3020 x NI5439 P1 P2 F2, cross HI1500 x HD2889 P1 and F2, for number of tillers per plant (Table 2) in cross MP3020 x NI5439 F2, for number of grains per spike (Table 3) P1 F1 in cross MP3020 x NI5439, for ear length cross (Table 3) HI1500 x HD2868 P1 P2 F1, cross HI1500 x HD2889 parents P1 P2 F1 and BC1, for number of spikelets per spike (Table 3) in cross HI1500 x HD2868 P1 P2 F1 F2 BC1 and BC2 and in cross HI1500 x HD2889 P1 P2 F1 F2 BC1 and BC2, for spike weight per plant (Table 3) in cross HI1500 x HD2868 generation F2, cross HI1500 x HD2889 P1 and F2, for character 1000 grain weight (Table 4) cross MP3020 x NI5439 F1 and BC2, cross HI1500 x HD2889 BC2, in cross HI1500 x HD2889 P2 and F2, for harvest index (Table 4) in cross HD2868 x HI1500 F1, cross HI1500 x HD2868 F1 and for grain yield per plant (Table 4) in cross MP3020 x NI5439 generation F2, cross HI1500 x HD2868 parent P2, generation F1 F2and BC1 and in cross HI1500 x HD2889 parents P1 P2, generations F1 and F2. These have been possessed high stability and reflecting they have wider adaptation could be grown under all type of environments. The finding of Mishra et al., (2000) suggested that WH 147 was responsive to rich environment which contradictory with present investigation.
The crosses, generations and characters have regression coefficient less than unity with low mean values viz. for character days to 50 % flowering (Table 2) in cross MP3020 x NI5439 in generations F1, cross HI1500 x HD2889 parent P1 and generation F1 and backcross BC2, for days to maturity in cross (Table 2) HI1500 x HD2868 in parents P1 P2, for plant height (Table 2) in cross HD2868 x HI1500 P1 P2 F1 F2 BC1 and BC2, for number of grains per spike (Table 3) in cross MP3020 x NI5439 P2 F1 BC1 and BC2, cross HI1500 x HD2889 generation F2, for number of spikelets per spike (Table 3) in cross HD2868 x HI1500 P1 P2 F1 F2 BC1 and BC2, for harvest index (Table 4) in cross MP3020 x NI5439 P1 P2 F1 and F2, cross HD2868 x HI1500 parents P1 P2 generation F2 and backcrosses BC1 BC2, cross HI1500 x HD2868 parents P1 P2 generation F2 backcross BC1 and BC2, and for grain yield per plant (Table 4) in cross HI1500 x HD2868 in P1 and BC2 recorded above average stability and they are suitable for specific environment. Same
these, crosses, generations and characters such as plant height (Table 2) in cross MP3020 x NI5439 in generation F1 and BC2, cross HD2868 x HI1500 parent P1 P2 generations F1 F2 and backcrosses BC1 BC2, for ear length (Table 3) in cross HD2868 x HI1500 parent P1 and generation F1, cross HI1500 x HD2868 parent P1 P2 generations F1 F2, for number of spikelets per spike (Table 3) in cross HI1500 x HD2868 parent P2, for spike weight per plant (Table 3) in cross MP3020 x NI5439 P2 F1 and BC2, cross HI1500 x HD2889 P1 F1 and BC2, for 1000 grain weight in cross MP3020 x NI5439 parent P1 and P2, cross HD2868 x HI1500 parent P1 and P2, cross HI1500 x HD2868 generation F1, cross HI1500 x HD2889 P1 and P2, for biological yield (Table 4) in cross MP3020 x NI5439 P2 and BC2, cross HD2868 x HI1500 P1 F1 and BC2, cross HI1500 x HD2889 P2 and BC2, for harvest index (Table 4) in cross MP3020 x NI5439 parent P2, cross HI1500 x HD2889 generation F1 and for grain yield per plant (Table 4) in cross MP3020 x NI5439 parent P2 F1 and BC1, cross HD2868 x HI1500 backcrosses BC1 and BC2. Hence these are not highly stable and they are poorly adapted to all environments. Same findings were reported by Shazia et al. (2015), and Misganaw et al. (2016).
ISSN 0975-928X
adaptation since they had regression coefficient greater than one and mean values more than their population mean for majority of the characters and, therefore, these crosses and generations may be exploited under optimal favorable environmental condition. Same findings revealed by Luthra OP (1994), Shazia et al. (2015) Kurt et al. (2016).
It is concluded from the above study that cross HI 1500 x HD 2868 was found stable over environments for yield per plant while cross M3020 x NI 5439 and HD 2868 x HI 1500 was found stable for harvest index.
References
Bangarwa, K.S. and Luthra, O.P. 1996. Stability analysis for spike attributes in macaroni wheat.
Agricultural Science Digest, 16(1): 1-4.
Borghi, B. and Perenzin, M. 1990. Yield and yield stability of conventional varieties and F1 bread wheat hybrids. Journal of Genetics and Breeding, 44(4): 307-310.
Ferede, M. and Worede, F. 2016. Grain Yield Stability and Phenotypic Correlation Analysis of Bread Wheat (Triticum aestivum L.) Genotypes in North Western Ethiopia. Food Science and
Quality Management,48: 44-50. Gulzar, S., Kamaluddin, B., Yusuf, M.A. and Khan
M.A. 2015. Stability analysis for yield, yield component and quality traits in wheat (Triticum aestivum l.) under temperate conditions in Kashmir valley. Plant Archives,15(1): 433-440. Kurt, P.O., Cifci, E.A. and Yagdi, K. 2016. Stability
Performance of Bread Wheat (Triticum aestivum
L.) Lines. J. Agr. Sci. Tech., 18: 553-560.
Luthra, O.P. and Bangarwa, K.S. 1994. Stability of gene effects for grain yield in macaroni wheat.
Agricultural Science Digest, 14(1): 51-53. Mishra, D.K. and Khan, R.A. 2000. Stability of wheat
ISSN 0975-928X
Table 1. Pooled analysis of variance for seed yield per plant and its components in wheat
Source of
variation d.f.
Days to 50% flowering
Days to maturity
Plant height
(cm)
Number of tillers/ plant
Ear length
(cm)
Number of spikelets/
spike (g)
Number of grains per spike
(g)
Spike weight/
plant (g )
1000-grain weight (g)
Biological Yield (g)
Harvest Index
(%)
Grain Yield/ plant (g)
Varieties 23 20.96** 20.51* 612.28*** 48.99** 7.29 0.85 153.30*** 139.93 132.36*** 346.16 640.87 56.39 Env.+(var.*Env.) 72 16.24* 13.81 259.10* 20.38*** 7.85 7.38*** 56.87 103.66 21.95 221.25 558.08** 30.47
Environments 3 200.26*** 76.18*** 924.21* 16.11 55.06*** 158.86*** 35.25 80.90 110.26*** 69.96 1399.33 37.98
Var.*Env. 69 8.24 11.10 230.18 20.57*** 5.80 0.79 57.81 104.65 18.11 227.82 521.51** 30.15
Environments
(Lin.) 1 600.79*** 228.52*** 2772.63*** 48.32** 165.17*** 476.58*** 105.75 242.70 330.77*** 209.87 4197.99*** 113.93 Var.*Env.
(Lin.) 23 6.38 13.34 371.31** 47.70*** 2.82 0.97 57.53 88.73 22.58 279.53 1040.27*** 12.04
Pooled Deviation 48 8.80*** 9.56*** 152.96*** 6.71 6.99** 0.68*** 55.54*** 107.92*** 15.21*** 193.56*** 251.20 37.57***
Pooled Error 288 3.52 1.92 23.55 12.13 3.97 0.33 16.09 34.80 4.33 44.25 636.60 12.23
Total 95 17.39 15.43 344.60 27.31 7.72 5.80 80.22 112.44 48.68 251.49 578.13 36.75
ISSN 0975-928X
Table 2. Estimates of stability parameters for days to 50 % flowering, days to maturity, plant height and number of tillers per plant
Crosses Generations
Days to 50% flowering Days to maturity Plant height Number of tillers/ plant
Mean bi S2di Mean bi S2di Mean bi S2di Mean bi S2di
MP3020 X NI5439
P1 79.84 1.046 -2.87 132.3 1.061 5.3* 138.3 0.367 14.5 13.75 2.510 -5.45
P2 81.12 1.318 -3.45 133.0 1.186 11.5** 132.3 0.518 151.0*** 11.81 3.299 -9.60 F1 74.99 0.982 -2.89 136.9 2.042 4.9* 124.0 2.583 181.9*** 11.19 1.249 -11.99
F2 81.01 1.147 -2.59 135.9 1.499 -0.5 136.0 0.516 68.5* 18.30 0.398 100.32***
BC1 79.94 1.849 5.43 134.0 1.760 13.0*** 109.0 -0.288 212.6*** 11.07 1.365 -10.34 BC2 78.80 1.183 -2.75 135.0 2.634 33.8*** 114.5 -2.549 360.7*** 11.87 1.869 -11.19
HD2868 X HI1500
P1 77.42 0.533 5.14 129.6 0.369 0.0 114.3 3.627 122.3** 11.26 3.130 -12.04
P2 82.54 1.178 0.96 133.3 1.594 15.3*** 125.1 1.954 12.4 11.83 2.760 -8.87
F1 78.59 1.479 28.29*** 132.8 0.428 3.5 111.1 5.259 144.1*** 10.90 1.894 -7.32
F2 81.25 1.071 -1.79 133.1 0.796 1.9 122.6 2.359 8.0 12.97 3.138 -10.35
BC1 82.41 0.978 24.12*** 133.6 1.390 26.4*** 106.4 1.649 179.1*** 9.87 2.285 -9.48 BC2 81.56 0.026 41.18*** 134.9 0.731 65.6*** 106.1 3.857 199.2*** 10.24 3.188 -8.28
HI1500 X HD2868
P1 78.62 1.068 -1.34 129.6 0.369 0.0 135.0 0.768 39.5 11.54 2.043 -11.45
P2 81.74 0.821 -0.55 130.8 0.614 -1.3 135.4 0.732 34.6 12.99 3.023 -10.63
F1 75.81 0.236 1.72 133.7 1.231 -0.6 139.3 1.200 133.1 12.57 0.033 -12.13
F2 81.32 1.105 -1.90 133.7 1.398 -1.0 134.3 0.932 70.8* 12.42 1.667 -11.67
BC1 81.20 0.438 19.54** 135.5 1.096 6.3* 121.8 -1.022 90. 0** 11.55 1.699 -11.66 BC2 82.16 0.293 39.72*** 138.5 4.009 5.8* 127.4 1.097 107.4** 10.25 4.118 -9.36
HI1500 X HD2889
P1 79.29 0.801 -3.44 130.7 -0.328 -1.1 138.7 0.352 -10.1 12.27 1.078 -11.94
P2 80.82 1.185 -3.36 130.9 -0.676 -1.0 129.6 1.376 182.2*** 12.89 3.154 -10.50 F1 74.49 0.759 -3.34 135.1 0.392 -1.2 138.7 1.263 149.9*** 11.71 1.160 -11.91
F2 81.11 1.192 -2.76 134.9 0.669 -1.1 134.3 0.929 70.3* 27.19 -21.125* 0.005
BC1 81.15 2.389 -2.97 131.6 -0.359 -1.2 110.7 -1.586 250.1*** 11.11 -0.801* -12.02
BC2 78.20 0.916 -3.40 131.3 -0.645 -0.9 100.7 -1.885 362.9*** 12.35 -0.065* -12.13
Mean 79.81 1.00 133.4 1.0 124.4 1.0 12.66 1.00
ISSN 0975-928X
Table 3. Estimates of stability parameters for number of grains/spike, ear length, number of spikelets per spike and spike weight per plant
Crosses Generations Number of grains/spike Ear length (cm) Number of spikelets / spike Spike weight per plant (g) Mean bi S2di Mean bi S2di Mean bi S2di Mean bi S2di
MP3020 X NI5439
P1 63.69 -0.352 39.13* 11.49 1.077 -2.34 20.37 1.045 0.18 63.69 1.424 39.13*
P2 55.07 4.530 6.35 11.67 1.025 -1.70 20.11 1.014 -0.15 55.07 1.622 6.35
F1 51.63 -0.291 -0.73 11.02 1.139 -3.54 20.71 1.211 0.10 51.63 2.183 -0.73
F2 59.84 1.975 -14.95 12.01 1.830 -3.79 20.74 1.094 -0.08 59.84 0.207 -14.95
BC1 52.82 1.648 0.63 12.97 0.724 -0.09 19.95 1.055 0.91* 52.82 -0.504 -0.63
BC2 52.42 8.467 303.76*** 12.87 1.185 -2.99 20.01 1.026 0.91* 52.42 3.295 303.76***
HD2868 X HI1500
P1 55.50 1.765 1.65 11.80 1.555 -0.23 19.91 0.836 -0.27 55.50 1.925 1.65
P2 64.99 1.973 105.19*** 12.17 1.539 -2.16 19.66 0.922 -0.10 64.99 2.802 105.19***
F1 56.29 -0.357 5.75 11.99 1.392 -2.19 19.86 0.905 0.99* 56.29 4.716 5.75
F2 66.32 4.776 55.09* 12.27 1.580 -3.58 21.29 0.228 7.71*** 66.32 1.503 55.09*
BC1 55.37 -2.242 5.21 12.36 1.403 -3.37 19.84 1.102 0.89* 55.37 2.325 5.21
BC2 54.59 -2.373 530.59*** 12.44 1.587 -3.20 19.80 1.125 0.86* 54.59 6.350 530.59***
HI1500 X HD2868
P1 55.32 4.110 -6.75 10.36 0.387 -3.90 20.00 0.896 -0.30 55.32 0.079 -6.75
P2 57.56 3.695 -8.54 11.31 0.639 -3.80 19.55 1.098 -0.29 57.56 1.543 -8.54
F1 58.72 -2.662 -12.17 11.09 0.513 -3.86 20.60 0.986 -0.30 58.72 -2.441 -12.17
F2 60.54 -0.969 -15.57 11.95 1.332 -3.22 20.45 1.008 -0.30 60.54 -0.128 -15.57
BC1 51.29 2.098 -13.66 12.30 1.260 -3.31 20.45 1.322* -0.28 51.29 -1.716 -13.66
BC2 72.69 3.418 -9.63 12.06 1.899 -2.47 20.22 1.423* -0.27 72.69 8.388 -9.63
HI1500 X HD2889
P1 66.34 -5.271 -0.72 10.44 0.333 -3.92 19.92 0.930 -0.30 66.34 -2.490 -0.72
P2 55.31 5.612 1.32 11.71 0.351 -3.92 19.92 0.930 -0.30 55.31 0.907 1.32
F1 52.05 3.024 -11.04 10.74 0.765 -3.72 20.20 1.165 -0.29 52.05 -1.982 -11.04
F2 59.10 0.256 -16.06 17.12 -1.018 141.14*** 20.45 1.020 -0.30 59.10 0.952 -16.06 BC1 55.14 -1.054 -15.48 13.84 0.477 -3.87 19.30 0.852* -0.30 55.14 -5.165 -15.48
BC2 43.62 -7.773 17.33 12.97 1.026 -3.53 19.40 0.807* -0.30 43.62 -1.795 17.33
ISSN 0975-928X
Table 4. Estimates of stability parameters for 1000 grain weight, biological yield, harvest index and grain yield per plant
Crosses Generations 1000-grain weight (g) Biological Yield (g) Harvest Index (%) Grain yield per plant(g) Mean bi S2di Mean bi S2di Mean bi S2di Mean bi S2di
MP3020 X NI5439
P1 45.09 1.624 182.23*** 74.60 4.366 221.83** 32.19 0.795 -590.26 22.92 2.970 -9.79
P2 45.66 2.215 6.63 57.99 1.934 389.54*** 51.29 5.790 -265.06 19.15 3.330 -1.20
F1 47.58 0.464 26.19** 62.08 -0.820 422.24*** 32.50 -0.545 -478.33 19.34 3.404 -7.84
F2 48.62 1.462 -3.55 73.13 2.043 -24.32 36.09 -0.416* -634.03 26.52 -0.437 15.53
BC1 47.74 1.670 -4.14 57.66 -0.214 149.26* 53.70 6.051 -140.37 19.25 4.268 60.91**
BC2 50.29 0.728 15.68* 59.17 2.012 783.76*** 41.80 2.517 -518.29 18.67 0.717 49.08**
HD2868 X HI1500
P1 30.46 1.591 2.79 58.88 2.559 -40.11 32.11 -0.584* -619.61 19.20 0.507 20.19
P2 43.90 1.149 -3.95 81.99 8.278 49.61 30.68 0.092* -629.98 25.17 0.514 43.26*
F1 45.47 2.244 -3.78 47.41 -3.467 240.12** 42.97 -0.564 -604.65 19.96 3.468 2.07 F2 46.48 1.419 -0.42 71.76 3.737 -22.28 37.94 -0.072* -630.63 27.29 1.133 10.39 BC1 47.45 1.068 11.97* 60.67 2.181 117.96* 27.34 0.303 -424.37 15.81 2.984 5.75 BC2 49.49 2.084 9.75* 52.66 -0.857 826.71*** 27.64 -0.548 -578.65 14.42 2.167 70.48**
HI1500 X HD2868
P1 27.45 0.770 -2.96 58.71 1.843 -38.77 31.17 -0.480* -623.97 18.52 0.436 8.78 P2 42.69 0.426 -3.91 76.15 3.844 -20.43 29.86 0.247* -633.24 22.45 0.073 -11.63 F1 44.04 1.335 -0.22 56.41 -7.003 34.74 43.83 -0.611* -616.09 24.22 -0.336 0.26 F2 46.05 1.563 1.29 71.79 3.707 -22.10 38.69 -0.082* -636.22 27.81 0.397 5.25 BC1 48.66 1.673 2.12 60.60 -7.949 57.54 37.67 -0.530* -621.20 21.86 -0.507 16.23 BC2 48.69 0.565 -3.59 68.42 9.756 109.09* 26.69 -0.436* -626.18 18.90 0.931 83.72***
HI1500 X HD2889
P1 37.45 -3.895 30.57*** 63.97 -1.200 -41.93 38.84 0.430 -626.46 24.49 -0.357 1.92 P2 41.70 0.886 -2.51 62.69 11.628 173.56** 74.68 5.560 1058.42 23.37 -0.050* -11.94 F1 49.29 -1.114 -1.47 65.26 -12.12 192.33** 38.57 -1.234 -553.05 23.02 -0.776 -8.79
F2 47.85 0.723 -3.12 72.87 3.078 -28.98 35.69 -0.438* -626.07 26.15 0.618 30.11*
BC1 46.52 1.108 -1.50 65.25 4.769 -7.59 70.61 6.598 1750.35 21.33 -1.375 197.02*** BC2 50.00 2.139 7.21 42.42 -8.108 61.65 54.81 2.157 -381.45 15.49 -0.677 38.45*
Mean 44.94 1.00 63.44 1.00 40.31 1.00 21.47 1.00