Vol.8 (2018) No. 4
ISSN: 2088-5334
Evaluation of Demand Response on System Reliability and
Cable Aging
D. B. Nugraha
#1, K. Kopsidas
#2, S. Liu
#3, M. Abogaleela
#4 #School of Electrical and Electronic Engineering, University of Manchester, United Kingdom E-mail : 1 [email protected], 2 [email protected]
3 [email protected], 4 [email protected]
Abstract— Emergency loading implementation brings reliability and flexibility benefits to the operator. However, its application
results in higher cable temperature, which may lead to increase of aging risk. Furthermore, demand response (DR) option can clip the customer loads and shift them to a different period. The DR clipping process reduces the loading of the network to avoid cable overheating and reduce its aging risk. The study aims to evaluate the impact of DR in increasing the reliability of the system as well as reducing the aging of the network. The proposed DR is implemented in the cable-based transmission network, as a complementary of emergency loading, by taking into account the large thermal inertia of the cable. It uses cable temperature elevation as the trigger as an alternative to demand level trigger, which is the traditional approach. The evaluation uses Sequential Monte Carlo Simulation (SMCS) on the IEEE 14 Bus Reliability Test System. The implementation of temperature-based DR reduces the network aging by 3% as well as expected energy not supplied by 34% compared to the emergency loading only.
Keywords— cable ageing; mergency rating; demand response; sequential monte carlo simulation; reliability
I. INTRODUCTION
The power system is getting more complex both on the demand side and generation side, with the presence of rapid demand growth and an increasing number of electric vehicles. On the other hand, environmental concern drives the utilization of clean and renewable energy to be injected into the power system network. However, this option introduces intermittency to the system. The system operator requires a flexible power system to cope with this uncertainty in the power system network.
Power system flexibility sources come from different aspects of power system [1]. On the generation side, a fast ramping generator can be utilized to follow the fluctuation of the customer demand quickly. However, this option requires high investment cost and long lead-time to be built,
From the network side, one option to increase the flexibility of the system is to operate the network based on the temperature, instead of current level, by implementing Electro Thermal Coordination (ETC) [2], [3]. Researches show that its implementation in the Over Head Line (OHL) and cable-based network brings the advantage of maintaining continuity of supply during contingency condition [2], [4]. In the cable-based transmission network, this option exploits the enormous thermal inertia of the cable which gives additional delay time between current and
temperature increase. This delay time could be utilized by the operator to overload the network safely. Another option is by employing emergency loading during a contingency event, such as a line failure. Following the contingency, the operator set a higher rating to let current flow through the remaining network. This avoids the need of high cost of reconductoring option to cover the increase in demand. However, this operation scheme tends to elevate the network temperature as the higher current will flow through the network. This may end in the increasing of network aging risk [5].
The use of DR for reducing OHL aging risk is observed by implementing temperature-triggered DR [10]. Its ability to reduce the aging is the result of lower loading of the cable by clipping the customer load. This loading reduction prevents a higher temperature elevation in the network. There is no current work in the implementation of temperature-triggered DR which exploits dynamic temperature characteristic in a cable-based transmission network.
The study aims to manage system reliability through exploiting cables’ large thermal inertia and lowering the aging risk by decreasing cable loading with the use of DR. This paper examines the impact of temperature-triggered DR to the reliability of the system and the index of cable aging. The objective is carried out by considering cable transient temperature and aging model as variables to the scheme. The scheme produced the result of updated aging risk and the flexibility of the system after the implementation of DR.
II. MATERIAL AND METHOD
This study implements Sequential Monte Carlo Simulation (SMCS) to assess the impact of proposed DR on system reliability and network aging risk. SMCS is utilized to model the component up-down state and to calculate the reliability and aging indices. SMCS is integrated with the dynamic cable temperature and aging calculation to model the temperature curve of the cable. This study also models emergency loading and demand response as a post-contingency action following a line failure in the system. The overview of the modeling and calculation scheme is presented in Fig. 1.
Fig. 1. Proposed Demand Response Implementation Flowchart
The required data for the modeling are generation data, network data, load data, cable data, soil data and reliability of the components data. The network data consists of the type, capacity, and connection of the cable. Cable formation and configuration are also integrated into the calculation, while the temperature of the soil is considered to model surround impact to the cable temperature.
In the initialization stage, each data is arranged chronologically with a 1-hour step to obtain hourly demand and cable temperature curve. Moreover, hourly component states are randomly generated with SMCS. The SMCS models one operation year of the system, with a ∆t step. The process is iterated until the stopping criterion is reached, whether maximum iteration year or predefined convergence level. New component states are generated to model the uncertainty in the system for each iteration.
Emergency loading is performed when the operator detects a contingency occurs in the system to let higher current flow. The operators assign the maximum allowable emergency loading level and duration for the network. The cable temperature is then calculated based on the updated current flow and soil temperature. The emergency demand response (EDR) is applied if the trigger-signal is detected, either demand level or cable temperature. EDR modify the customer demand depends on the participation level of the customer. Finally, the final load flow and cable temperature are obtained by performing AC optimal power flow (ACOPF) with the modified load curve. These data will be used for network aging and reliability calculation.
A. Emergency Loading Modelling
Emergency loading is modeled as a post-contingency mean to increase the system flexibility by operating the network at the higher rating for a reasonable period. The operation regards a maximum rating for a limited duration. There are three different rating level implemented in this simulation; Short Time Emergency (STE), Long Time Emergency (LTE), and Normal rating. The acceptable duration depends on the rating level. The employment duration is checked by applying a counter, which starts at the beginning of its utilization. The implementation is shown in the Fig. 2.
The operator decision is based on the rating counter at t hour when a contingency occurs. Both counter, STE and LTE, are initially set to zero. The counter increases by 1 if the emergency rating is utilized. Following a contingency event, the operator checks whether the maximum duration limit is reached. If maximum STE duration is exceeded, the rating will be set to lower rating, which is LTE. Then, the normal rating is utilized if LTE rating utilization is reached its permitted duration.
Power Flow is run to evaluate the line flow level with the assigned rating. The STE rating is utilized if the resulted line flow is higher than LTE rating. Then, the STE counter is increased by 1. When the resulted line flow is higher than the normal rating, the LTE rating is employed, and the LTE counter is incremented. The counter is reset to zero if the line flow is below the standard rating.
B. Demand Response Modelling
DR is utilized as an emergency action to reduce the loading of the network by clipping the customer load during a contingency, e.g., line failure. The DR process is triggered if a predefined limit is exceeded and begins with load clipping. This study utilizes the Load Shifting regime, which considers restoration of the clipped load from the peak period to a low demand period.
There are two triggering methods in this simulation; demand level and cable temperature. The operator sets the predefined limit for each trigger. In the first method, DR is triggered if the contingency occurs when the system demand level is higher than the limit. On the other hand, the second method evaluates the cable temperature as the DR trigger. If the temperature exceeds the predefined value, the operator starts the DR clipping process to avoid higher temperature elevation. The limit for each triggering method is shown in equation (2) and (3). In the demand-triggered method, the limit is defined as the percentage k of maximum system
demand
P
systemmax which is calculated by.
(1)
While the temperature limit is defined as
(2)
Where m is the percentage of the maximum cable
temperature
T
cablemax.The amount of demand reduction depends on the customer participation percentage p. Calculation of the clipped demand PPC_Bus(j,h) is referred to the equation (3), where
PBus(j,h) is the demand of bus j at hour h.
_
( , )
( , )
PC Bus Bus
P
j h
= ×
p P
j h
(3)The resulted in bus demand
P
Bus_new after the clippingprocess is calculated with equation (4) by subtracting the original bus
P
Bus_ori with the total clipped demand. Theclipped demand of each bus is summed to obtain total clipped demand according to the equation (5) which will be shifted to the restoration period.
_
( , )
_( , )
_( , )
bus new Bus ori PC Bus
P
j h
=
P
j h
−
P
j h
(4)
_
( )
_( , )
PC Total PC Bus h
P
j
=
P
j h
(5)
The restoration process started following the end of the clipping process. The restoration can only be started during the off-peak period when the system demand level is lower than a pre-specified value. A restoration limit is implemented in this simulation to prevent a new peak during
the restoration process [11]. This limit
P
resmaxfor bus j isdefined by equation (6) with k as the percentage of bus
maximum demand
P
busmax.max max
P
res( )
j
= ×
k
P
bus( )
j
(6) The total clipped energy is fully restored at the beginning of the restoration process unless it is higher than the restoration limit. If it exceeds the limit, the amount of restored energy is equal to the limit, while the remainder is recovered at the next period. The process repeatedly occurs until all the clipped energy is fully restored. The hourly restored demand _ is calculated by_
_ max
_
( )
( , )
min
( )
( , )
PC Total
DR bus
res Bus ori
P
j
P
j h
P
j
P
j h
=
−
(7)
_ _
_ max
_
( ) ( , )
( , 1) min
( ) ( , 1)
PC Total DR bus
DR bus
res Bus ori
P j P j h
P j h
P j P j h
− + =
− +
. (8)
The resulted demand level _ after the DR process is calculated by
_
( , )
( , )
_( , )
bus new Bus res bus
P
j h
=
P
j h
+
P
j h
. (9)C. Cable electrothermal and aging modeling
Fig. 3. TEE model of unarmored cable with the soil layer
Td and Tj represent the thermal resistance of the insulation and jacket layer, respectively, while Cc, Cd, and Cj define thermal capacitances of each layer (conductor, insulation, screen, and jacket). The impact of the surrounding soil is represented by an exponential discretization model where Ts and Cs are the soil thermal resistance and capacitance, respectively [13]. The parameters are calculated based on IEC 60287 [14].
D. Cable aging modeling
The aging of the cable can be modeled with the Arrhenius model to calculate the impact of the temperature variation on the aging [15]. This model uses the loss-of-life fraction concept to calculate the aging of each time interval ∆t for
operating temperature , ∆ . This also depends on cable material’s activation energy Ea. The loss-of-life fraction
,( ) C i tt
LF
θ∆ of cable i is calculated with
( )
(
)
,( ) 1 0, 1 ,( )
,
C i tt Ea ki B i C i tt
o i
t
LF
L e
θ ∆ θ − θ ∆
∆
=
(10)
where ,is the expected lifetime, , is the ambient temperature, and kB is the Boltzman Constant. The Equivalent Cable Ageing (ECA) index is proposed to assess the equivalent calculated ageing to the ageing at 90°C, which is the maximum temperature in utility practice [15]. The calculation is expressed by
ECAi ,∆t = LFθ
C ,i(t∆t)
LFi,90°C =exp Eai
kB
1 363−
1
θ
C ,i(t∆t)
(11)
E. Reliability and aging indices
The evaluation of the proposed DR’s impact on system reliability and cable aging is based on the reliability and aging indices. The reliability is assessed based on the Expected Energy Not Supplied (EENS) which is calculated using SMCS. On the other hand, Expected Equivalent Network Ageing is used for evaluating the aging of the network as the sum of each cable Expected Equivalent Cable Ageing (EECA) in the network. EECA is calculated by
(12)
where ECA is the equivalent cable aging at each interval. While the EENA is calculated by
.
(13)
F. Case study
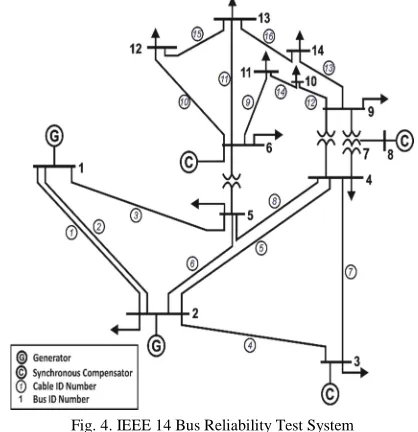
The study uses the IEEE 14 Bus RTS System, which is shown in the Fig. 4, for evaluating the proposed scheme.
Fig. 4. IEEE 14 Bus Reliability Test System
The simulation is conducted for 1-year operation period or 8760 hours. The SMCS stop at the maximum iteration of 1500 years or until the covariance of the EENS is less than 5%.
In this simulation, it is assumed that only line failures are considered. The demand curve is developed chronologically from [16] and increased to 2 times to stress the system. XLPE cables are used in this simulation, in which the data is adapted from [15]. The maximum cable temperature is set to 90 °C.
TABLEI CASE STUDIES
Scenario Flexibility Source EDR Trigger
Base Case N/A N/A
SC-1 EL N/A
SC-2 EL+EDR 80% of Max Sys. Demand
SC-3 EL+EDR 80% of Max Cable Temp.
III.RESULTS AND DISCUSSION
A. Cable Temperature and Ageing Mapping
Intact year simulation, which considers no failure in the system, was run to investigate average cable temperature and aging for a free-contingency system.
Fig. 5. Cable expected aging and average temperature indices during an intact year
The result shows that the highest aging and average temperature were recorded for cable 11. This is due to cable’s high capacity which causes a significant amount of current passing through this cable. Moreover, the total of network aging, EENA, was calculated at 625.55 (hours/year) for an intact year.
B. Impact of Emergency Loading on Cable Temperature
In this section, the impact of emergency loading (EL) on cable temperature is evaluated. Contingency condition in the system is represented by the failure of cable 16 for 15 hours starting at hour 8315. Fig. 6 shows the comparison between the base case scenario and Sc-1, which implements EL.
The ENS of the system increases following the failure. Moreover, the system ENS in the Sc-1 was lower than the base case. This occurred as more current flowing through the remaining network. Thus, the curtailment of customer load could be minimized.
On the other hand, ENS reduction has to be compromised with higher temperature elevation on the remaining cables. Fig. 6 captures the temperature of cable 13, which is the neighboring cable of the failed cable. The maximum temperature during the contingency increased by 14% compared to the base case scenario.
Fig. 6. Impact of ER on cable 13 temperature and system ENS for a failure of cable 16 at 8315 to 8330
As the aging of the cable increase with the higher cable temperature, this operation resulted in higher aging. This aging risk is minimized with the implementation of emergency demand response (EDR) to lower the loading of
the cable. The impact of the EDR is simulated in the next scenario.
C. Impact of EDR to Load Curve and Cable Temperature
The impact of EDR implementations on the load curve and cable temperature is investigated in this section. A traditional demand-based approach was applied in the Sc-2 as a complementary of the emergency loading, while Sc-3 implemented temperature-based EDR.
Fig. 7. Impact of different EDR triggering methods on system load
Fig. 7 shows the different impacts of each approach to the system load curve. In Sc-2, the DR was instantly triggered as the contingency occurred during the peak period while the demand level exceeded the predefined demand limit. On the other hand, the temperature-based DR started at a later time in Sc-3. The clipping process occurred even if the system demand level was at low demand period. This phenomenon occurred since the temperature of the cable was still higher than the limit because of the enormous thermal inertia of the cable. The restoration process of the temperature-based DR ended later than the demand-based DR.
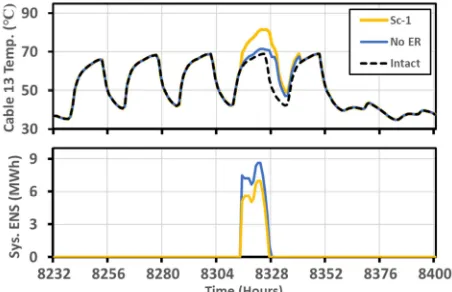
Fig. 8. Impact of different EDR methods on cable 13 temperature
Different modified load curve resulted in distinct temperature curve characteristic. Emergency loading caused a high-temperature elevation as seen in the Fig. 8. This condition occurred in all scenarios. Cable was heating up slowly as seen in the base case scenario. Following the load clipping process, the temperature slightly decreased in Sc-2 and Sc-3 at hour 8316 to 8320. The large thermal inertia of the cable resulted in a delay between cable’s loading reduction and temperature cooling process.
D. Impact of EDR to System Reliability and Ageing
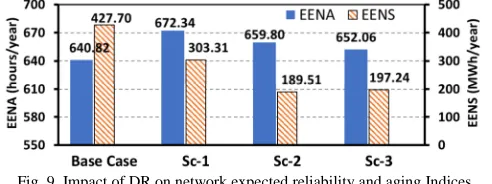
Reliability and aging indices were calculated to assess the impact of the implementation of proposed DR. Fig. 9 represents the result of EENS and EENA calculation.
Fig. 9. Impact of DR on network expected reliability and aging Indices
The implementation of EL in Sc-1 increased the reliability of the system as evidenced by reduction of EENS by 29% compared to the base case. The implementation of the EL during contingency events could minimize the customer demand curtailment by relaxing the network limit. Thus, the operator can maintain the supply to the customer. This reliability improvement, however, needs to be paid by 5% increase of the network aging.
EENA comparison between Sc-2 or Sc-3 with Sc-1 were used to evaluate the effect of DR implementation, which show the reduction of the aging following the implementation of EDR. Compared to EL only, demand-triggered and temperature-demand-triggered were caused 1.7% and 3% reduction in network aging, respectively. The difference was caused by different clipping and restoration time between these two approaches (mentioned in Section III.C).
Due to cable’s large thermal inertia, the restoration process at the beginning of the valley period (Sc-2) can cause cable temperature to rise, followed by the increase of aging. Hence, it is important to restore the energy when the cable is in the cooling period to minimize the risk of aging.
The implementation of EDR has shown lower system EENS compared to Sc-1. There was a 37% reduction recorded in Sc-2, as well as a 34% reduction in Sc-3. The higher reduction in Sc-2 was caused by the ability of demand-triggered DR to reduce the demand even though the cable temperature is in low level. In Sc-3, using temperature-triggered DR, demand was not clipped before the temperature limit is surpassed. The demand-triggered DR enables the system to clip the demand early to avoid possible curtailment, hence, produced lower reliability compared to the temperature-triggered DR approach.
IV.CONCLUSIONS
This study offers a new approach to implementing demand response (DR) to complement emergency loading operation during a contingency event for network reliability and aging improvement. The implementation of the temperature-triggered approach, instead of demand-triggered approach, shows performance improvement in the applied IEEE RTS 14 Bus System network. The study shows that the implementation of Emergency Loading only reduced the EENS by 29%. On the other hand, it increased the EENA by 5%. Thus, Emergency Loading improves the system reliability, with the cost of increasing network aging risk.
The reduction in cable aging occurred as the Emergency Demand Response (EDR) capability is added with ERs. The experiment showed that EDR with demand-triggered caused the EENS to be reduced by 37% while using EDR temperature-triggered cut down the EENS by 34%. However, the temperature-triggered approach showed a reduction in cable aging by 3%. Thus, the latter approach can be applied to old components, where life duration is needed to be extended to postpone reinforcements.
ACKNOWLEDGMENT
This work was supported in part by the EPSRC HubNet EP/N030028/1 and the Indonesian Endowment Fund of Education (LPDP).
REFERENCES
[1] J. Cochran et al., “Flexibility in 21st Century Power Systems,” 21st
Century Power Partnersh., vol. May, p. 14, 2014.
[2] H. Banakar, N. Alguacil, and F. D. Galiana, “Electrothermal coordination Part I: Theory and implementation schemes,” IEEE
Trans. Power Syst., vol. 20, no. 2, pp. 798–805, 2005.
[3] N. Alguacil, M. H. Banakar, and F. D. Galiana, “Electrothermal coordination Part II: Case studies,” IEEE Trans. Power Syst., vol. 20, no. 4, pp. 1738–1745, 2005.
[4] R. Olsen, J. Holboell, and U. S. Gudmundsdot́tir, “Electrothermal coordination in cable based transmission grids,” IEEE Trans. Power
Syst., vol. 28, no. 4, pp. 4867–4874, 2013.
[5] K. Kopsidas, “Impact of thermal uprating and emergency loading of OHL networks on interconnection flexibility,” Proc. 18th Mediterr.
Electrotech. Conf. Intell. Effic. Technol. Serv. Citizen, MELECON 2016, no. April, pp. 18–20, 2016.
[6] D. Huang, R. Billinton, and W. Wangdee, “Effects of demand-side management on bulk system adequacy evaluation,” 2010 IEEE 11th
Int. Conf. Probabilistic Methods Appl. to Power Syst. PMAPS 2010,
pp. 593–598, 2010.
[7] M. Fotuhi-Firuzabad and R. Billinton, “Impact of load management on composite system reliability evaluation short-term operating benefits,” IEEE Trans. Power Syst., vol. 15, no. 2, pp. 858–864, 2000.
[8] T. Eklund, “Impact of Demand Response on Distribution System Operators’ economy,” pp. 1–7, 2014.
[9] D. Huang and R. Billinton, “Effects of load sector demand-side management applications in generating capacity adequacy assessment,” IEEE Trans. Power Syst., vol. 27, no. 1, pp. 335–343, 2012.
[10] M. Abogaleela, K. Kopsidas, C. Cruzat, and S. Liu, “Reliability Evaluation Framework Considering OHL Emergency Loading and Demand Response,” pp. 1–6.
[11] M. Abogaleela and K. Kopsidas, “Reliability Enhancements from Demand Response Considering Interrupted Energy Assessment Rates,” 2016.
[12] R. S. Olsen, J. Holboll, and U. S. Gudmundsdottir, “Dynamic temperature estimation and real-time emergency rating of transmission cables,” IEEE Power Energy Soc. Gen. Meet., pp. 1–8, 2012.
[13] M. Diaz-aguiló, F. D. E. León, S. Member, S. J. Member, and M. Terracciano, “Ladder-Type Soil Model for Dynamic Thermal Rating of Underground Power Cables,” vol. 1, no. November 2014, pp. 21– 30, 2015.
[14] British Standard, “IEC 60287-1-1: Electric cables — Calculation of the current rating,” Br. Stand., vol. 3, pp. 1–31, 1997.
[15] K. Kopsidas and S. Liu, “Power Network Reliability Framework for Integrating Cable Design and Ageing,” IEEE Trans. Power Syst., pp. 1–1, 2017.
[16] C. Grigg and P. Wong, “The IEEE reliability test system -1996 a report prepared by the reliability test system task force of the application of probability methods subcommittee,” IEEE Trans.
Power Syst., vol. 14, no. 3, pp. 1010–1020, 1999.