longitudes 32° 24' 1" to 32° 29' 37" E and latitude 30° 29' 47" to 30° 42' 45" N. The sand sheet is the only landform covering the area, including three units; low, moderate and high. The soils are classified as Typic Torripsamments, with sand being the dominant texture class. The land capability spatial model (LCSM) showed that the fair soils occupy an 208.7 km2, representing 94.6% of the total area, while the poor soils occupy 12.0 km2 and represent 5.4% of the total area. Soil texture is the limiting factor for land capability. The Applied System for Land Evaluation (ASLE) software was used for assessing land suitability for 12 crops; alfalfa, peanut, sugar beet, wheat, onion, tomato, watermelon, citrus, date palm, fig, grape, and olives. The clay content is the limiting factor. The soils would be suitable (S2) and marginally suitable (S3) for the selected crops. The most recommended crops would be peanut, tomato, and date palm, as the soils appeared suitable for their requirements.
Keywords: Land capability,Land suitability, Eastern Suez Canal, Remote sensing, GIS, ASLE.
One of the most significant indices determining agricultural progress is food security (Vink, 2012). The ability for securing food production will remain a global challenge for the next years due to the ever-increasing population and consumption growth that generate a fierce competition on land, water and energy (Godfray et al., 2010). This is vital in the developing countries, where a large portion of the future population growth is expected (Byrnes and Bumb, 1998). Egypt is one of the most heavily populated countries in the world, where about 90 million people live on about 4% of the total area of the country (El-Ramady et al., 2013). Nearly all of such area is arable land lying along the banks of the Nile and its Delta(Darwish et al., 2013); and it is threatened by urbanization (Shalaby and Moghanm, 2015). Hence, the Egyptian government has adopted a policy of encouraging reclamation of desert lands to expand the area of arable land (Adriansen, 2009). Agriculture depends mainly upon adequate irrigation and suitable soils (Lawrence et al., 2002).Thus, defining the proper land for a certain agricultural activity is needed to help decision makers in allocating highly suitable lands for such objective (Kalogirou, 2002).
interpreting benefits and detriments of land use (FAO, 2007). Land capability is the fitness of a given type of land for a nonspecific kind of land use (de la Rosa and van Diepen, 2002). Land suitability as defined by the FAO Framework for Land Evaluation (FAO, 1976) is "the fitness of a certain type of land for a defined use". The high capacity for producing food, fiber, and other agriculture products remains the vital aim for agricultural expansion over barren lands (Mueller et al., 2010). Crop production is a result of many factors including regional climate, land properties, socioeconomic resources, management, market, and other human activities (Li et al., 2011). The current study was carried out on lands east of the Suez Canal, Egypt to assess their capability and suitability based on land resources and soil physiochemical properties. Such assessment would help decision makers in planning to achieve sustainable agriculture.
Materials and Methods
The studied area
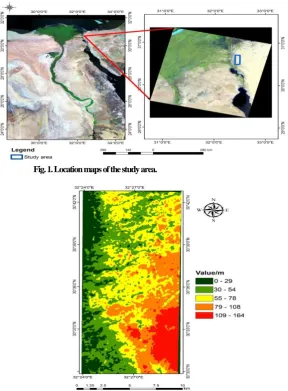
The studied area covers 220.7 km2 located east of Suez Canal (Fig. 1) between and 32° 24' 1" to 32° 29' 37" E and 30° 29' 47" to 30° 42' 45" N. The soils are young Aeolian Quaternary deposits of late Pleistocene to Holocene era, forming sand sheets and/or sand dunes physiographic units (Mohamed et al., 2013). The total annual precipitation is 38.3 mm year-1. Temperature reaches 36.22 °C in July and decreases to 8.0 °C in December with a mean annual value of 22.1 °C. The relative humidity ranges between 65.4% in December and 51.6% in May, with a mean value of 59.8%. The soil temperature regime is Hyperthermic and the soil moisture regime is Torric.
Remote sensing and GIS works
Landsat 8 satellite image (path 176, row 39) was acquired on 21-04-2016. The ENVI 5.1 software (ITT, 2014) was used for digital image processing. The image was geometrically corrected and rectification method (image for map) was followed. The geometric model used in the rectification process was second order polynomial, and the resampling method is the nearest neighbor method. The image was stretched, smoothly filtered, and its histograms were matched for its rectification and restoration according to Lillesand and Kiefer (2007). A digital elevation model (DEM), acquired from the Shuttle Radar Topographic Mission (SRTM) on 21-4-2016, was used as the source data for elevation heights of the study area (Fig. 2). The geomorphologic map was produced using the processed Landsat 8 image and the DEM. GIS works were performed to produce base, geomorphic, capability and suitability maps of the studied area using Arc GIS 10.2.2 software (ESRI, 2014).
Field and laboratory works
Fig. 1. Location maps of the study area.
Fig. 2. Digital elevation model (DEM) of the studied area.
Land evaluation
This procedure was done using two systems. The first system is land capability classification based on the FAO Framework for Land Evaluation (FAO, 1976). Soil texture, soil depth, calcium carbonate status, gypsum content, EC, exchangeable sodium percent (ESP), drainage, and slope were inputted in the Arc GIS 10.2.2 software to design land capability model whereby capability map was produced. Also, the Applied System for Land Evaluation (ASLE) software which has been developed by Ismail
chemical properties of pH, CaCO3, gypsum, CEC, ESP and salinity determine fertility of soil. The capability and suitability classes are shown in Table 1.
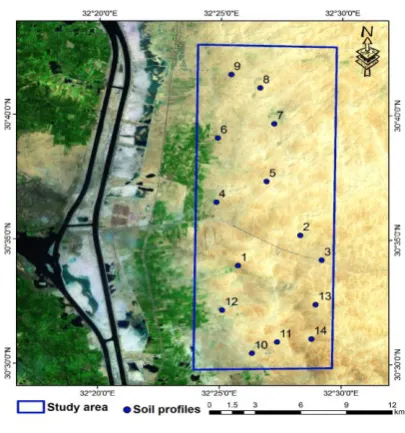
Fig. 3. Locations of soil profiles representing the study area.
TABLE 1. The ASLE capability and suitability indices and classes.
Capability
index Class Description
Suitability index
Clas
s Description
> 80 C1 Excellent > 80 S1 Highly suitable
80 - 60 C2 Good 80 - 60 S2 Suitable
60 - 40 C3 Fair 60 - 40 S3 Moderately suitable
40 - 20 C4 Poor 40 - 20 S4 Marginally suitable
20 - 10 C5 Very poor 20 - 10 Ns1 Currently not suitable
10 C6 Non-agriculture 10 Ns2 Permanently not suitable
Results and Discussions
Geomorphology
Fig. 4. Geomorphic map of the study area.
Soils of the studied area
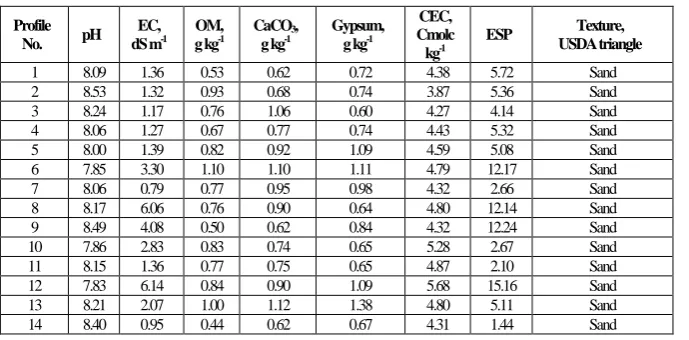
Table 2 shows the weighted mean values of soil characteristics and pH of the surface horizons. Soil pH varied between 7.83 and 8.53, indicating moderately to strongly alkaline reaction. Soil salinity varied from non-saline to slightly saline as EC values ranged from 0.79 to 6.14 dS m-1. Organic matter content was low and did not exceed 1.10 g kg-1 due to the absence of natural vegetation and the aridity conditions. Values of calcium carbonate and gypsum contents varied between 0.62 - 1.12 for the former and 0.60 - 1.38 g kg-1 for the later. The CEC was low and ranged from 3.87 to 5.68 cmolc kg-1 due to low organic matter and clay contents. The soils remained within the safe level of sodicity since ESP was below 15, except for profile No. 12 with ESP of 15.16, indicating a slight hazard. According to the USDA (2014), the soils are TypicTorripsamments.
TABLE 2. Main characteristics for soils of the studied area.
Profile No. pH
EC, dS m-1
OM, g kg-1
CaCO3, g kg-1
Gypsum, g kg-1
CEC, Cmolc kg-1
ESP Texture,
USDA triangle
1 8.09 1.36 0.53 0.62 0.72 4.38 5.72 Sand
2 8.53 1.32 0.93 0.68 0.74 3.87 5.36 Sand
3 8.24 1.17 0.76 1.06 0.60 4.27 4.14 Sand
4 8.06 1.27 0.67 0.77 0.74 4.43 5.32 Sand
5 8.00 1.39 0.82 0.92 1.09 4.59 5.08 Sand
6 7.85 3.30 1.10 1.10 1.11 4.79 12.17 Sand
7 8.06 0.79 0.77 0.95 0.98 4.32 2.66 Sand
8 8.17 6.06 0.76 0.90 0.64 4.80 12.14 Sand
9 8.49 4.08 0.50 0.62 0.84 4.32 12.24 Sand
10 7.86 2.83 0.83 0.74 0.65 5.28 2.67 Sand
11 8.15 1.36 0.77 0.75 0.65 4.87 2.10 Sand
12 7.83 6.14 0.84 0.90 1.09 5.68 15.16 Sand
13 8.21 2.07 1.00 1.12 1.38 4.80 5.11 Sand
Land capability classification
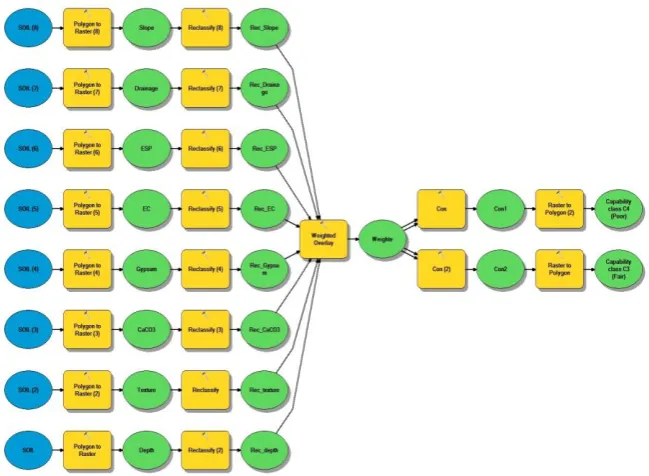
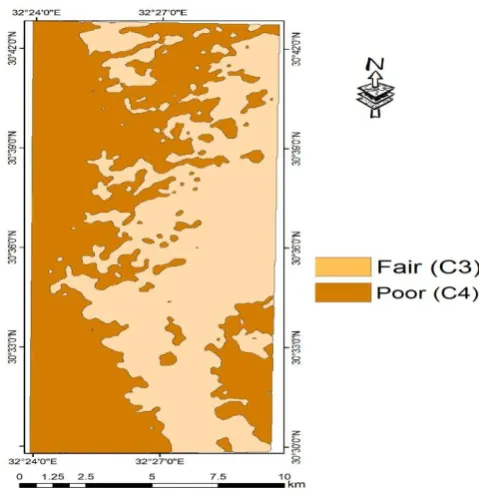
The land capability spatial model (LCSM) is designed for identifying capability classes for the studied area (Fig. 5). Soil properties were ranked and weighted in order to assess land capability. Thereafter, they were constructed and mapped in the geographic information system (GIS) environment. The spatial analysis was done on the GIS layers through running the LCSM to determine the capability classes and a soil capability map was produced. Based on the LCSM (Fig. 6 and Table 3), the soils belong to capability classes fair (C3) and poor (C4). The fair soils occupied an area of 208.7km2 (20870 ha), representing 94.6% of the total area while, the poor soils occupied an area of 12.0 km2 (1200ha), representing 5.4% of the total area. The most limiting factor is soil texture (as the sand is dominant textural class). The significance of coarse soil texture is related to its implications on soil erosion susceptibility, low level of organic matter, low water holding capacity and low nutrient content and retention (Villas-Boas et al., 2016). Based on the ASLE model (Fig. 7), the fair soils occupied 117.6 km2, representing 53.3% of the total area, while the poor soils occupy 103.1 km2, representing 46.7% of the total area. A trial was done to obtain a relation through correlation coefficient analysis for some measurements (areas/km2) of capability obtained from either GIS or ASEL model. After that, the data factors (y) and the correlation coefficient r were calculated as shown in Fig. 8. A positive correlation was observed between the GIS and ASLE models, and hence it could be estimated that capability area form ASLE = 5.18 GIS model.
TABLE 3. Land capability classes and areas based on the GIS and ASLE models.
Capability class GIS model ASLE model
Area (km2) % Area (km2) %
Fair (C3) 208.7 94.6 117.6 53.3
Poor (C4) 12.0 5.4 103.1 46.7
Land suitability classification
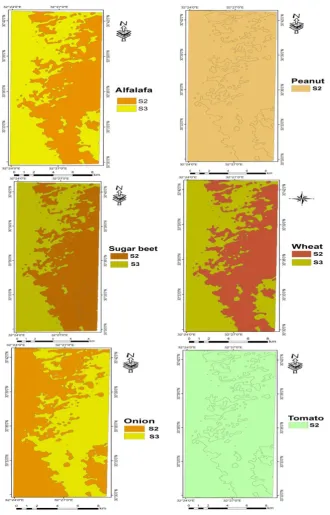
The soils were evaluated for cultivating 12 crops, including field crops; alfalfa, peanut, sugar beet and wheat, vegetable crops; onion, tomato and watermelon, and fruit crops; citrus, date palm, fig, grape and olive (Fig. 9). The clay content is the limiting factor for crop cultivation. With slight salinity in few localities and sodicity (alkalinity) in soil profile No. 12, their occurrence could not pose a major problem. Excessive salt in such sandy soils is not concerned, where it could be leached easily (Barnard et al., 2010). The soils belong to suitable (S2) and marginally suitable (S3) classes. Peanut, tomato and date palm would be the most suitable crops in the studied area (Table 4), as the soils appear suitable (S2).
Conclusion
Fig. 5. Flowchart of the land capability classification spatial model.
Fig. 7. Capability map based on the ASLE model.
Fig. 8. Correlation between capability areas based on the GIS and ASLE models.
Acknowledgment: The authors express their deep thanks to Prof. Dr. Ali Ahmed Abd El-Salam
and the Middle East: Proven practices. Springer Netherlands, Dordrecht.
de la Rosa, D. and van Diepen, C.A. (2002) Qualitative and quantitative land evaluation, In 1.5. Land use and land cover, In Encyclopedia of Life Support System (EOLSS-UNESCO), Eolss Publishers. Oxford, UK
El-Ramady, H.R., El-Marsafawy, S.M. and Lewis, L.N.(2013) Sustainable agriculture and climate Changes in Egypt. In: Lichtfouse, E. (Ed.), Sustainable Agriculture Reviews: Volume 12. Springer Netherlands, Dordrecht.
Estefan, G., Sommer, R. and Ryan, J. (2013) Methods of Soil, Water and Plant Analysis: A Manual for The West Asia and North Africa Region, 3rd ed. Int. Center Agric. Res. In Dry Areas (ICARDA), Beirut, Lebanon
ESRI (2014) Arc Map version 10.2.2 user manual. ESRI, 380 New York Street, Redlands, California, 92373-8100, USA.
FAO (1976) A framework for land evaluation. Soil Bull. No. 32 Food and Agriculture Organization (FAO) of the United Nations, Rome, Italy.
FAO(2006) Guidelines for soil profile description. Food and Agriculture Organization (FAO) of the United Nations, Rome, Italy.
FAO (2007) Land evaluation. Towards a revised framework. Land and Water Disc. Paper No. 6 Soil Bull. No. 32 Food and Agriculture Organization (FAO) of the United Nations, Rome, Italy.
Godfray, H.C.J., Beddington, J.R., Crute, I.R., Haddad, L., Lawrence, D., Muir, J.F., Pretty, J., Robinson, S., Thomas, S.M. and Toulmin, C. (2010) Foodsecurity:thechallenge of feeding 9 billion People. Science, 327, 812-818.
Ismail, H.A., Morsy, I.M., El-Zahaby, E.M. and El-Nagar, F.S. (2001) A Developed expert system for land use planting by coupling and modeling. Alex. J. Agric. Res. 46 (3), 141-154
ITT (2014) ITT corporation ENVI 5.1 software, 1133 Westchester Avenue, White Plains, New York 10604, USA.
Kalogirou, S. (2002) Expert systems and GIS: an application of land suitability evaluation. Computers Environ. Urban Syst., 26, 89-112.
Li, L., Zhao, J. and Yuan, T. (2011) Study on approaches of land suitability evaluation for crop production using GIS. In: Li, D., Liu, Y., Chen, Y. (Ed.), Computer and Computing Technologies in Agriculture IV: 4th IFIP TC 12 Conference, CCTA 2010, Nanchang, China, October 22-25, 2010, selected papers, Part II. Springer. Berlin Heidelberg, Berlin, Germany.
Lillesand. T.M. and Kiefer, R.W (2007) Remote Sensing and Image Interpretation, 5th ed. Paperback, JohnWiley, New York, p. 820.
Mohamed, E., Belal, A. and Saleh, A. (2013) Assessment of land degradation east of the Nile Delta, Egypt using remote sensing and GIS techniques. Arab J. Geosci., 6 , 2843-2853.
Mueller, L., Schindler, U., Mirschel, W., Shepherd, T.G., Ball, B.C., Helming, K., Rogasik, J., Eulenstein, F. and Wiggering, H. (2010) Assessing the productivity function of soils. A review. Agron. Sustain. Dev., 30, 601-614.
Shalaby, A. and Moghanm, F.S. (2015) Assessment of urban sprawl on agricultural soil of northern Nile Delta of Egypt using RS and GIS. Chinese Geogr. Sci., 25, 274-282.
Sharififar, A. (2012) Assessment of different methods of soil suitability classification for wheat cultivation. J. Agrobiol., 29, 47-54.
Sys, C., Van Ranst, E., Debaveye, J. and Beernaert, F. (1993) Land evaluation. Part III. Crop requirements. Agricultural publications No. 7. General administration for development cooperation, Brussels, 199p
U. S. Department of Agriculture (2014) Keys To Soil Taxonomy, 12th ed. USDA-Natural Resources Conservation Service, Washington, DC, USA.
Villas-Boas, P.R., Romano, R.A., Franco, M.A.D., Ferreira, E.C., Ferreira, E.J., Crestana, S. and Milori, D. (2016) Laser-induced breakdown spectroscopy to determine soil texture: A fast analytical technique. Geoderma, 263, 195-202.
Vink, N. (2012) Food security and African agriculture. South African J. Int. Affairs, 19, 157-177.
(Received: 28/4/2016; accepted: 26/10/2016)
سيوسلا ةانق قرش يضارلأا مييقت
-سإب رصم
مظنو دعبلا نم راعشتسلإا مادخت
ةيفارغجلا تامولعملا
ديزوبأ ديعس دمحأ
*
لضف مهدلأا دمحم و
**
* هايملاو يضارلأا مسق -
ةعارزلا ةيلك - و اهنب ةعماج ** ةرمتسملا تاساردلاو يملعلا بيردتلا مسق -
ةئيهلا
ةيموقلا ءاضفلا مولعو دعبلا نم راعشتسلإل
مادختسإ مت تانايب لإا اهردق ةحاسم مييقت يف ةيفارغجلا تامولعملا مظنو دعبلا نم راعشتس ,,0,2 مك , ( ,,020 راتكه ) ةعقاولا يضارلأا نم
سيوسلا ةانق قرش -
ليصاحملا ضعب ةعارزل اهتمءلام ىدمو ةبرتلا ةردق ثيح نم رصم .
ةقطنملا نأ ةيجولوفرومويجلا ةيحانلا نم دجو
ةسوردملا دجوي ب اه و دحاو يضرأ لكش ةيلمرلا تاشرفلا وه
Sand sheets .
ةعومجم تحت ىلإ ةبرتلا يمتنت
Typic
Torripsamments
ةقطنملا يف دئاسلا وه يلمرلا ماوقلا نأ ثيح .
نأ ةبرتلا ةردق مييقتل يغارفلا جذومنلا حضوأ 6,,9
( % ,0820 راتكه )
ةردقلا ةطسوتم يضارأ ةسوردملا يضارلأا نم ( C3 ) امنيب , 4,, ( % 0,00 راتكه ) ةردقلا ةفيعض يضارأ (
C4 .) مييقتلا ماظن مادختسإ مت
ينورتكللإا ASLE ةعرازل ةبرتلا ةمءلام مييقتل 0,
,لصبلا ,حمقلا ,ركسلا رجنب ,ينادوسلا لوفلا ,يزاجحلا ميسربلا يه لوصحم
نوتيزلاو ,بنعلا ,نيتلا ,حلبلا ليخن ,حلاوملا ,خيطبلا ,مطامطلا .
دقو ةحلاص يضارلأا نأ دجو (
S2 ) ةيحلاصلا ةيشماهو , (
S3 ) ليصاحملل