Contents lists available at www.innovativejournal.in
Asian Journal of Computer Science And Information Technology
Journal Homepage: http://innovativejournal.in/ajcsit/index.php/ajcsit
Author(s) agree that this article remain permanently open access under the terms of the
STATISTICAL APPROACH FOR DETECTING DISTRIBUTED DENIAL OF SERVICE
ATTACKS
Rajvirkaur, Gauravdeep
UCOE,Punjabi University, Patiala.
ARTICLE INFO ABSTRACT
Corresponding Author: Rajvirkaur
UCOE,Punjabi university, Patiala
Keywords: chi square (X2), backscatter dataset, CAIDA, DDoS, and IDS.
DOI
:http://dx.doi.org/10.15520/ ajcsit.v7i5.69Over the past decades, network security issues have been raised due to the rapid growth of internet. Security has been becomes an important challenge to secure the network from cyber-attacks. Various tools that are required for security purposes are firewalls, passwords, IDS for the detection of attacks and prevent it from sending out the harmful traffic to the traffic. This paper present statistical based intrusion detection technique based on chi square to detect DDoS attack by calculating the expected and observed frequencies. In this case traffic is containing in a dataset of certain interval. Traffic is contained from a backscatter dataset. This approach can effectively detect the DDoS attack.
©2017, AJCSIT, All Right Reserved. I. INTRODUCTION
IDS are used to secure the system from the unauthorized access through which attackers cannot allow to penetrate into the network. In DDoS attack host or hosts suffer from huge amount of packets from zombies. DDoS simply exploit the tremendous amount of internet resources that is comprised hosts located between themselves and the victims to send a large amount of useless packets towards the victim around the same time.
IDS play a great role in field of security to prevent from DDoS and other certain types of attacks. DDoS attack is major threat to internet, business and large firms and this attack is becoming popular among the hackers as it is very difficult to detect attack. As the speed of internet is increasing internet intrusion detection which is used to programmed the internet intrusion detection system. Intrusion detection system is of two types which are misuse detection and anomaly detection.Anomaly detection is based on finding abnormal data by statistical measurement and misuse detection that is based on predefined signature. Anomaly detection is used to capture the changes in behavior that deviates from the normal behavior. Misuse detection is based on the predefined signatures [1]. Thismethod takes data as input to develop normal data set. Alarms are raised when an anomaly is detected. Nowadays new attacks are generated because of that they cannot be detected by the signature anomaly detection.
Anomalies detection can detect both the known and unknown attacks.
A. Background:
Network intrusion detection system includes a wide range of knowledge like network security and some novelty detection approaches. There are many issued involved in network security but following are the most common:
There are known attacks but unknown vulnerabilities are discovered day to day [2].
In the distributed denial of service attack when a malicious user attacks the all resources of network and it’s very difficult to distinguish between good and bad request.
B.DDoS (Distributed denial of service) attack: A DDoS attack occurs when multiple compromised systems or multiple attackers flood the bandwidth or resources of the targeted system with the useless traffic. DDoS is most serious attack because they target a wide range of important resources, from banks to new websites and presents a major challenge to making sure people can publish and access important information. A DDOS attack generally consist of two issue stages for setting anattack, control stage and the second one is attack stage [3]. In the control stage the attackers looked for the system vulnerabilities and installed masters/handlers and zombies. Handlers are the first level vulnerable hosts controlled by hacker. The second level vulnerable hosts are zombies and they are controlled through the handlers.In controlstage, control messages are single direction from attacker to handler but between handlers and zombies messages are bidirectional. After the control stage vulnerable hosts entered the attack stage and thus launching the DDoS attack.
C. DDoS attack architecture: II. RELATED WORK
by monitoring audit records of system for abnormal patterns of system usage and is able to detect breakings and other types of attacks [5].Ye describes an anomaly detection based on chi square test into information system that has100% detection rate [6].Qayyumet al describes the different areas of applications in statistical based anomaly detection and discusses about the advantages and disadvantages of it [7].
Figure 1: DDoS attack architecture
Statistical based method of anomaly detection chi square is used in research work because of its good performance and clarity. Chi square test is a goodness of fit test N.Ye, S.M Emran finds experimentally that performance of chi square is better than that of Hotelling T2[8].Gavrilies andDermatas presented a detector for DDoS attacks in public networks based on statistical methods based on estimated short time window analysis of incoming data packets. Statistical descriptors are used to describe the behavior of DDoS attacks [8].Cheng et al describes a new system for detection of DDoS attacktraffic that is based on the two sample test t-test. It obtains normal statistics SYN flood arrival rate and then compares it withthe difference between SYN and ACK packets [9]. Cabera et al. introduced a methodology for extracting probable precursors of DDoS attacks using MIB traffic variables. This method is not good as it is unable to solve the problem when attacker and victim are on different sites [10].Mirkovic proposed a source based DDoS attack detection system D-WARD. This system is installed at edge routers of network and work by monitoring the behavior of each peer with which the source network communicates.D-WARD is a system that can detect the common patterns of DDOS attack [11].Peng et al. describes a novel approach to detect bandwidth attacks by analyzing the incoming rate of new source IP addresses which is based on the advanced non parametric change detection method, CUSUM [12].
III. PROPOSED WORK
In this paper, wedetect DDoS attack from a dataset by using statistical method. Chi square test is used to detect the DDoS attack .Tools used for this purpose are
Wireshark and coral reef. We now discuss Chi square test and methodology used for DDoS detection.
A.Chi square test
Chi square is a goodness of fit test that is applied to any univariate data from which cumulative distribution function can be calculated. Chi square test can be applied binned data that is data is divided into classes. This is not restriction as for non-binned data a histogram and frequency table is calculated before generating the chi square test. Chi square test is based upon the assumptions
that it is defined for the hypothesis which are null hypothesis and alternate hypothesis.
H0: It is the data that followed specific distribution. Ha: It is the data that does not follow the specific distribution.
To develop the chi square hypothesis test for distribution of variables one must fulfill the following conditions [13]:
All the expected must be one or should be greater than one.
At most 20% of frequencies should be less than 5. Data is divided into sets and the test statistics is defined by as follow:
X2= 𝑛 𝑂
𝑗− 𝐸𝑗 2
𝑗 =1 /𝐸𝑗
Where: Ojis the observed frequency Ejis the expected frequency
Ej expected frequency is calculated by Ej =N (F (Yu)-F (Yl))
Where F is defined as the cumulative frequency for the distribution for each N samples
B. DDoS Attack Dataset
From the literature survey it is concluded that statistical analysis is good for detection of anomalies. CAIDA backscatter data set is analyzed for the detection of the anomalies. The backscatter dataset contains three hours of processing PCAP file format. Dataset contains attributes which are source address, destination address, number, time, protocol. As data is very large so in our research we divide data that is divided into smaller parts and implemented dataset through queries.
C. Methodology
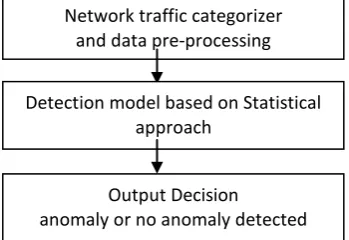
This approach is modeled for detection of DDoS attacks. First of all in this model backscatter data set is analyzed. From the Backscatter dataset network traffic fields like time, source address, and destination address are extracted. The backscatter dataset is provided by the CAIDA. The following figure shows the generalized architecture of intrusion detection model.
Fig2. Generalized architecture of intrusion detection Dataset is contained in the PCAP(packet capture) file format in our dataset it contains the TCP, ICMP, IPV4 protocols. As the dataset contains large PCAP file format, it is not possible for any tool to process whole dataset at a time therefore it is split into smaller parts of three minutes (180 sec) of PCAP format for each one of the TCP, ICMP, IPV4 protocols. The worthless data is eradicated and useful data is extracted from PCAP three minutes and converted into CSV format through the Wireshark tool.
Then the file is run in the database. Find the average packets per second for the whole dataset. And find the relative frequency based on average packets per second for the whole distribution. Further expected and observed frequencies are calculated based upon the intervals.
Network traffic categorizer and data pre-processing
Detection model based on Statistical approach
The relative frequency is calculated the average number of packets per second. Whereas expected frequency is calculated by multiplying the relative frequency with that of total observed frequency. After calculating the expected frequency we want to check the anomaly in the dataset. As we are choosing intervals from 0 to 180 sec .So first interval T1 is choose between 0 and 180sec for the anomaly detection. According the time window we have selected seven different intervals.
H0: Interval T1 has anomaly
H1: in the interval T1 does not have any anomaly
Setting the time interval is a big issue in our research work. In this research work we can do comparatively analysis with other statistical techniques. There are various statistical intrusion detection methods are available.
The following figure shows the proposed model of statistical based chi square method for anomaly detection. D. Tools used
Backscatter dataset contains the large PCAP data files such a large data is difficult to process. To keep only useful information from the dataset tools like Wireshark is used which is used to eradicate all the worthless data from the dataset. In our research we had used Wireshark and coral reef tools for the same.
Wireshark:Wireshark is an open tool for analyzingnetwork traffic and packets capturing in real time. It examines the traffic and provides information of individual packets such as protocol type; transmit time, source and destination. Coral reef:coral reef is a project of CAIDA. It is software which contains package of libraries, device drivers, classes and applications. It monitors traffic of any standard network interface on UNIX like systems. Coral reef
includesreadymade software solutions for monitoring and analysis of live traffic and recorded traffic traces.
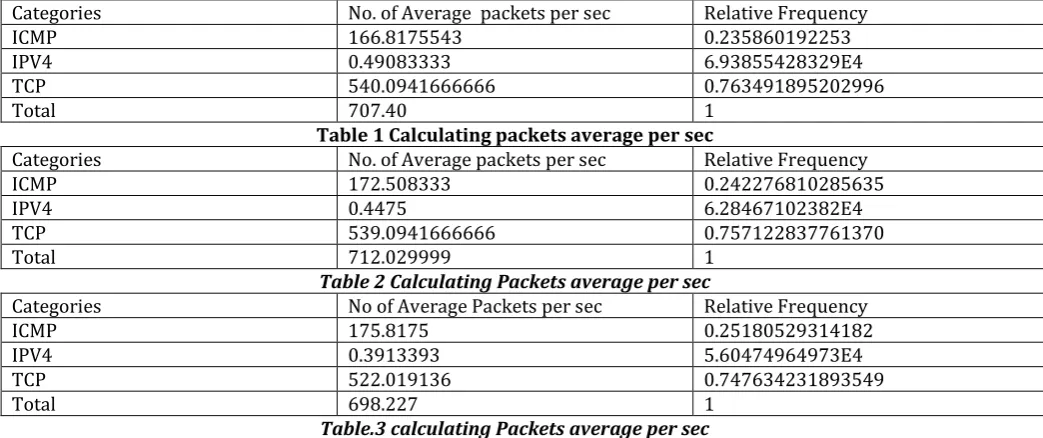
I. RESULTS AND DISCUSSION
In this section we describe the main steps of the experiment carried out. It includes calculating relative frequency,observed and expected frequency. The following tables 1, 2, 3 have shown the different values of number of average packets per second and their relative frequency
Fig3. Flow chart of model
Categories No. of Average packets per sec Relative Frequency
ICMP 166.8175543 0.235860192253
IPV4 0.49083333 6.93855428329E4
TCP 540.0941666666 0.763491895202996
Total 707.40 1
Table 1 Calculating packets average per sec
Categories No. of Average packets per sec Relative Frequency
ICMP 172.508333 0.242276810285635
IPV4 0.4475 6.28467102382E4
TCP 539.0941666666 0.757122837761370
Total 712.029999 1
Table 2 Calculating Packets average per sec
Categories No of Average Packets per sec Relative Frequency
ICMP 175.8175 0.25180529314182
IPV4 0.3913393 5.60474964973E4
TCP 522.019136 0.747634231893549
Total 698.227 1
Table.3 calculating Packets average per sec
The following tables 4, 5, 6 have the different values from interval 0 to 180. First the large PCAP file is converted into smaller parts. All values are calculated and added in the following tables 4, 5, 6 which give one value of interval between 0 to180. The calculating table of the values of is given below:
Categories Relative
frequency(f) Observed Frequency(O) Expected Frequency(E) (O-E) (O-E)
2 (O-E)2/E
ICMP 0.2358601
92253 153.3977 7777 151.0642137 855766 2.3335639 914234 5.4455209 02067910 3.6047727 79023 IPV4 6.93855428
329E4 0.3957222 222 0.44448170 5821272 -1.1102490 574245 1.23265296 8635E04 3.16974932644291E04
TCP 0.763491895
Total 1 640.5979 67745.21605463
Table 4.Frequency Table Categories Relative
frequency(f) Observed frequency(O) Expected frequency(E) (O-E) (O-E)
2 (O-E)2/E
ICMP 0.24227681
0285635 164.1944 44444 184.432979 5531293 -20.238535 109129 409.598303 3634471 2.220851738 467080 IPV4 6.2846710
2382E4 0.533333 333 0.45651633 7183812 0.7681699 6116188 0.59008508 92331444 1.292582633 234113 TCP 0.757122837
761370 551.5222 222222 576.359003 1230051 -24.836780 9010051 616.865685 5245317 1.07028029 7838744
Total 1 761.249 152.1623735
0088636 Table 5. Frequency Table
Categories Relative
frequency(f) Observed frequency(O) Expected frequency(E) (O-E) (O-E)
2 (O-E)2/E
ICMP 0.2518052
9314182 165.19444 444444 174.167677 9391614 -8.973233 4951614 80.518919 35868647 0.46230690 0519237 IPV4 5.6047496
4973E4 0.554444 4444 0.38766708 1872664 0.1667773 2527336 2.7814688 651574 7.17489050 5846513
TCP 0.74763423
1893549 525.92777 7778 517.120654 9792026 8.8071227 987974 77.565411 99309694 0.14999480 5363588
Total 1 7.78719221
11729338 Table 6. Frequency Table
∑(O-E)2/E 67745.216054
152.1623735 7.78719221 67905.16561 Table7. Shows the chi square value
In our research assumption are performed on significance level of 5% which accounts for α=0.05.degree of freedom is m-1 because we have use three different categories namely TCP,ICMP,IPV4. In our case we have degree of freedom is 2. In the decision phase chi square value is compared with the chi square tabular value. If the chi square value is greater than the tabular form then anomaly is raised.
Comparison of the values is given below: Chi square calculated value = 67905.16561 Chi square tabular value for 0.05 = 5.991
In our work calculated value is greater than the tabulated value chi square value, so we accept the hypothesis Ha. Anomaly occurs at the interval 0to180 (T1). We have seen from the literature survey, if observed and expected difference is large than intrusion occurs [14].Further we will check other intervals and will find in which interval the anomalous behavior is detected.
Fig4. Graph of frequency table 4
Fig5. Graph of frequency table 5
Fig6. Graph of frequency table 6
CONCLUSION
In this paper we explored the concept of statistical based chi square test in terms of detecting DDoS attack from a CAIDA backscatter dataset in particularly. DDoS attack has been detected and analyzed through extracted features from network traffic and applied on protocols like ICPM, TCP, and IPV4. Various tools and software are used like Wireshark, coral reef to preprocess the dataset.
Results and analysis shows that if expected and observed frequencies have large difference between them then there is anomaly. In chi square test if calculated value is greater than the tabular value then there is an anomaly detected. In our results calculated value is much greater than the calculated value.
0 100 200 300 400 500
1 2 3
Observed frequency
Expected frequency
0 200 400 600
1 2 3
Observed frequency
Expected frequency
0 200 400 600
1 2 3
ACKNOWLEDGMENT
The authors are thankful to the Punjabi University, Patiala for its kind support to carry out this research work. The authors also acknowledge the expert opinions of their colleagues to complete this research work.
REFERENCES
[1] N. Y. A. Q. CHEN, "AN ANOMALY DETECTION TECHNIQUE BASED ON ACHI-SQUARE STATISTIC FOR DETECTING INTRUSIONS INTO INFORMATION SYSTEMS," QUALITY AND RELIABILITY ENGINEERING INTERNATIONAL, no. 17, pp. 105-112, 2001.
[2] Z. K. M. H. K. Rahul Rastogi, "Network Anomalies Detection Using Statistical Technique : A Chi- Square approach," IJCSI International Journal of Computer Science Issues, vol. 9, no. 2, 2012.
[3] I.-L. L. Fang-Yie Leu, "A DoS/DDoS Attack Detection System Using Chi-Square Statistic Approach," SYSTEMICS, CYBERNETICS AND INFORMATICS, vol. 8, no. 2, 2010.
[4] D. Denning, "An Intrusion Detection Model," IEEE Trans. on Software Engineering, vol. 2, no. 13, pp. 222-232, 1987.
[5] N. Y. a. Q. Chen, "An Anomaly Detection Technique Based on a Chi-Square Statistic for Detecting Intrusions into Information Systems," Quality and Reliability Eng, vol. 17, no. 2, 2001.
[6] M. i. A.Qayyum, "Taxonomy of statistical based anomaly detection techiques for intrusion detection," Emerging Technologies, 2005.
[7] S. E. Q. C. a. S. V. N. Ye, "Multivariate Statistical Analysis of Audit Trails for Host-Based Intrusion Detection," IEEE Trans. on Computers, vol. 51, no. 7, 2002.
[8] D. a. D. Gavrilis, "Real-time detection of distributed denial-of-service attacks using RBF networks and statistical features," ComputerNetworks and ISDN Systems, no. 48, pp. 235-245, 2005.
[9] C. L. Chen, "A new detection method fordistributed denial-of-service attack traffic based on statistical test," Journal of Universal Computer Science, no. 15, pp. 488-504, 2009.
[10] e. a. J. B. D. Cabrera, "“Proactive Detection of Distributed Denial of Service Attacks Using MIB Traffic Variables – A Feasibility Study,”," Proc. of the 7th IEEE/IFIP International Symposium on Integrated Network Management, pp. 1-14, 2001.
[11] G. P. a. P. R. J. Mirkovic, "Attacking DDoS at the source," International Conference on Network Protocols (ICNP’02), 2002.
[12] T. L. C. a. R. K. Peng, "Detecting distributed denial of service attacks using source IP address monitoring," Proceedings of the 3rd International IFIP-TC6 Networking Conference, pp. 771-782, 2004.
[13] R. H. A. H. S. H. S. H. J. Goonatilake, "Intrusion Detection Using Chi-square Goodness-of-Fit Test for Information Assurance Network, Forensics and Software Security," Consortium for Computing Sciences in Colleges, 2007.
[14] Q. s. R jensen, "a rough set-aided system for sorting WWW booking," in web intelligence:Research and Development,Springer Berlin Heidelberg, pp. 95-105, 2001.