Vol.8 (2018) No. 3
ISSN: 2088-5334
Optimization of Fingerprint Indoor Localization System for Multiple
Object Tracking Based on Iterated Weighting Constant - KNN Method
Asti Putri Rahmadini
#1, Prima Kristalina
#2, Amang Sudarsono
#3#
Department of Electrical Engineering, Magister Program of Engineering Techonolgy Politeknik Elektronika Negeri Surabaya (PENS)
Kampus PENS, Sukolilo 60111, Surabaya, Indonesia
E-mail: [email protected], [email protected], [email protected]
Abstract— Indoor localization promises a lot of benefits on the application in various fields. The fingerprint method is often used
because it has high mobility, low network cost, and high compatibility. However, the distance and RSSI relationships are non-linear which decreases the accuracy of the system. KNN is required as a matching algorithm to solve the problem. The error result of Fingerprint-KNN system for indoor localization is still less satisfactory, therefore weighting factor is added in KNN algorithm as a modification to optimize the accuracy and precision of the localization system. The usual W-KNN is adding a value in form of the distance error from estimation result. In this paper, the constant as the result of iteration process within a range is multiplied by the error value which is added to the system as a weighting of KNN algorithm. The iterated weighting constant provides optimization on the system up to 25% better than the conventional system.
Keywords— indoor localization; fingerprint; iterated weighting constant-KNN
I. INTRODUCTION
Localization has been an interest of researchers recently, because it has wide application in daily life. Localization is the process of estimating or determining the location of objects that have been equipped with sensor nodes in wireless sensor network (WSN) [1]. Based on the observation area, in general, the localization is divided into two, they are indoor and outdoor. The current problem of outdoor localization has been solved by the presence of GPS (Global Positioning System) [2]. Whereas for indoor localization it applies various devices that enable to be installed in the indoor environment such as Bluetooth, Wi-Fi, RFID etc [3]. Some method is added in the system to complete the performance of these devices in order to reach an accuracy estimation of object’s position.
The indoor localization method is categorized into two types, namely range-based and range-free [4]. Between these two, range-free has a more excellent performance and often been used because it is easy to apply and the cost is cheaper than range-based device. Fingerprint is a range-free based method that models RSSI (received signal strength indicator) to be converted into distance, so that the coordinates of the object can be identified.
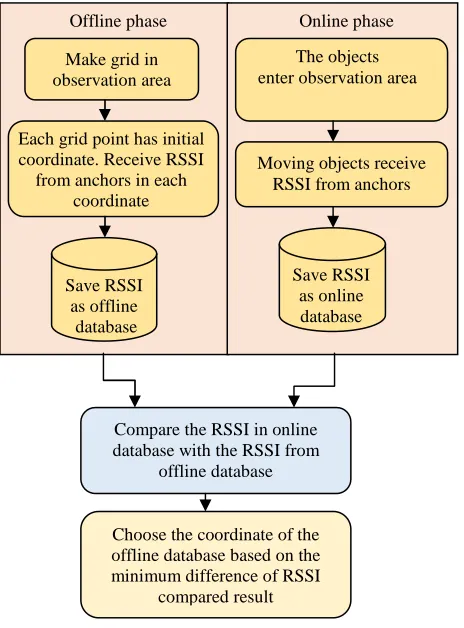
Fingerprint has two stages of process, they are the online and offline [5]. In online stage, the observation area is
mapped by using grid, where each point of the grid intersection is defined as coordinate point. RSSI value will be taken in every coordinate points from the transmitters installed in the observation area. Then these values are stored as an offline database. The next stage is the online stage, which represents a condition when the object that has brought the receiver device, enters the observation area. The receiver device will receive RSSI from the transmitters then the received RSSI will be saved into the online database. The similarity between offline databases and online databases will be searched using the matching algorithms called K-nearest neighbors (KNN) in order to improve the accuracy of the estimated position. The estimation result of the system has been proven in [6]. The result of [6] shows that even though KNN has improved the accuracy of fingerprint system, the error value between the actual position and the position estimation is still quite large due to the non-linear relationship between RSSI and the distance [7]. Therefore, in this paper, an iterated weighting constant algorithm is added in KNN algorithm to optimize the system. Weighting constant is iterated within a certain range to get the appropriate weighting value, so the minimum value of mean square error (MSE) can be achieved.
value is used to determine which constants are the best for a particular position. The results of the proposed system are compared with conventional fingerprint-KNN systems based on their MSE values to determine the estimated error reduction. Calculation time is analyzed to determine the effect of system performance when it is applied to the installed device.
The next section structures in this paper are as follow: Section II presents related work. Section III describes the method of Fingerprint and IWC-KNN. Section IV presents the result of simulation and discussion. Finally, section V concludes the paper.
II. MATERIAL AND METHOD
A. Related Work
Range-based and range-free are the indoor localization methods based on its ranging types. The range-based utilizes the distance or the angle of coming signal to estimate the position of a node in the observation region [8]. The range-based method includes trilateration, Angle-of-Arrival (AoA), Time-of-arrival and Time difference of arrival. Unfortunately, these methods require a lot of hardware additions, such as antenna and speakers, and therefore the installation becomes more expensive, while the accuracy is very dependent on multipath fading around the observation space [9].
On the other hand, the range-free method only requires connectivity information between nodes and anchors. One of the methods using this principle is fingerprint. Some of fingerprint-based has been done by research because of the advantages to an easy application and also it does not require a lot of cost (in relation to additional devices).
The system in [10] uses a modified KNN to improve the fingerprint performance. Modified KNN means the result of distance is adding by a weighting from comparison between the RSSI offline and RSSI online values. The performance of the fingerprint increases, however the system is very sensitive to the K value of KNN.
The authors [11] propose an improvement of accuracy in positioning system by using the fingerprint-KNN method and the moving average filter. In fingerprint-KNN system, the Euclidean values are calculated. The three values that have the smallest Euclidean is given a weighting factor. If the error of estimation result is still high, the moving average is used to filter the final result.
The authors [12] perform iterative weighted KNN on a fingerprint localization scheme. The IW-KNN process is based on SIM (Similarity) classification, where SIM is the cosine between RSSI offline and RSSI online. In this case, iteration is produced by the classification of K values in KNN algorithm. The weighted form is an RSSI value. The result of the system shows that weighted iteration is able to decrease the average error in the experiment.
The authors [13] propose a method to improve the accuracy of the fingerprint–KNN system by clustering the fingerprint based on the smallest enclosing circle and modified the WKNN method. The WKNN is modified by using the logarithm of distance between estimation position and real position. As the result, the accuracy of the WKNN
B. Fingerprint Method
The fingerprint method is an RSSI-based localization method. It accomplishes by matching between the RSSI values in the grid points that have been created in the observation area with the RSSI value of the object which is carrying the receiver device. The fingerprint block diagram is depicted in Fig. 1.
The fingerprint is divided into two stages, an offline stage and online stage. At the offline stage, the researcher performs a grid scenario with a certain grid spacing in observation area and sets the coordinates for every intersection points in grid scenario. Furthermore, the anchor nodes as the signal transmitter are installed at certain points whose the signals can be reached throughout the observation area. The receiver device takes the RSSI values in all coordinates point from all anchors installed in the observation area. Then, the RSSI values are parsed based on the anchor source and stored with their coordinates as the offline database. The RSSI values from each anchor are averaged to generate a RSSI representative value from each anchor for a coordinate point. For example, if there are n grid points in observation area, with i as the number of anchor node and(x,y)nis the coordinates of the grid point, so a coordinate of grid point will have (x,y)n1 = [rssin1 i,1,rssin1 i,2 ,⋯,rssin1,i ], all grid point in observation area will become (1) :
[
]
= i n i n i n i n i n i n i n i n i n n n n rssi rssi rssi rssi rssi rssi rssi rssi rssi y x y x y x , , 2 , 1 2 , 2 , 2 2 , 1 1 , 1 , 2 1 , 1 2 1,( , ) ,...( , ) ) , ( ⋮ ⋯ ⋱ ⋯ ⋯ ⋮⋮ (1)
The next stage is the online stage. In this stage, the observation area has been supported to localize when the objects enter the area. The objects are equipped with node devices as a receiver. So, when the objects enter the observation area, the receiver devices will receive signal along with RSSI data from the anchor nodes.
The RSSI data are parsed based on the anchor source and sent to the database as an online database. If there are m number of object positions in the observation area, the matrix of RSSI for the online stage is as equation (2). Then, in conventional fingerprint method, the localization phase is done by matching RSSI of online database and offline database as in the following equation (3).
[
]
= i m i m i m i m i m i m i m i m i m m m m rssi rssi rssi rssi rssi rssi rssi rssi rssi y x y x y x , , 2 , 1 2 , 2 , 2 2 , 1 1 , 1 , 2 1 , 1 2 1,( , ) ,...( , ) ) , ( ⋮ ⋯ ⋱ ⋯ ⋯ ⋮ ⋮ (2)Fig. 1 Fingerprint block diagram system
Fig. 2 Eucledian Distance measurement
C. K-Nearest Neighbor Algorithm
The fingerprint method obtains an estimation coordinate based on RSSI in offline database that has the smallest difference from RSSI at the online stage. The result of this system still has a quite high error [6]. Therefore an additional matching algorithm is required to improve the accuracy of the system.
The KNN algorithm works by calculating the Euclidean distance of RSSI in the online database with all RSSI in the offline database (4). Fig. 2 shows the KNN algorithm process to measure Euclidean distance.
−
= =
m
i mi ni
rssi rssi Dist Euclidean 0 2 , , )
( (4)
The next step is sorting the Euclidean distance in ascending form. The K value of KNN decides the accuracy of the estimated position. It has an effect in searching process of the smallest value in KNN algorithm. For example, for K=3, the system will take 3 values of the smallest Euclidean distance to be matched again with the average among three of them. The RSSI of three points which has the smallest distance value is selected and the coordinates are taken as the output of the system. The value of K=1, will find the shortest distance (first order of ascending) from the offline RSSI, called as Nearest Neighbour.
D. Iterated Weighting Constant K-NN
Weighting in KNN algorithm is believed can develop the accuracy of estimation position. There are many ways to build the weighting factor, for instance, in some papers they use inverted index [14], dual distance function [15], and Manhattan distance [16] as weighting factors. For the proposed system, weighting is done by two processes, there are weighting by the MSE value and by adding a constant from the iteration process.
1) MSE Weighting
Weighting is done by calculating errors that occur in the system. Suppose the system uses 3-NN for the K-NN algorithm. If there are four anchors in the observation area, each object in the observation area will receive 4 online averaged RSSI as in (5)
1 ) ,
(x y m = [rssim1 i,1,rssim1 i,2,rssim1,i3,rssim1,i4] (5)
Furthermore, based on the fourth values of the online RSSI, the Euclidean distance is calculated among all RSSI in the offline database and online RSSI with an intention to get proximity distance among them. Based on the equation (4), suppose there are 10 positions in the offline database, there will be 40 RSSI in the database because they use 4 anchors, so the equation becomes (6).
) ) ( ) ( ) ( ) (( 2 4 , 1 4 , 1 2 3 , 1 3 , 1 2 2 , 1 2 , 1 2 1 , 1 1 1 1 , 1 i n i m i n i m i n i m i n i m n m rssi rssi rssi rssi rssi rssi rssi rssi Ed − + − + − + − = ) ) ( ) ( ) ( ) (( 2 4 , 2 4 , 1 2 3 , 2 3 , 1 2 2 , 2 2 , 1 2 1 , 2 1 1 2 , 1 i n i m i n i m i n i m i n i m n m rssi rssi rssi rssi rssi rssi rssi rssi Ed − + − + − + − = ⋮ ) ) ( ) ( ) ( ) (( 2 4 , 10 4 , 1 2 3 , 10 3 , 1 2 2 10 2 , 1 2 1 10 1 1 10 , 1 i n i m i n i m i n i m i n i m n m rssi rssi rssi rssi rssi rssi rssi rssi Ed − + − + − + − = − −
Once the Euclidean distance is calculated by the equation (6), then the distance values between all RSSI in offline database with the RSSI of the object are obtained. Using K=3 for 3-NN then the system will take 3 value of the smallest distance from the calculation, for example, the three distances are Ed1,Ed2,Ed3 . Based on these values, weighting factor W , can be defined as (7).
Make grid in observation area
Offline phase Online phase
Moving objects receive RSSI from anchors
The objects enter observation area
Compare the RSSI in online database with the RSSI from
offline database
Choose the coordinate of the offline database based on the minimum difference of RSSI
compared result Save RSSI as online database Save RSSI as offline database (6) Each grid point has initial
coordinate. Receive RSSI from anchors in each
coordinate
%-EUCLEDIAN DISTANCE MEASUREMENT--- 1. Initializing the number of object (m) and the
number of grid point (n).
2. Calculating the Euclidean distance (EU (m, n)) between object’s RSSI and RSSI in fingerprint database.
3. Sorting the Euclidean values based on the smallest values.
=
= = 3
1 3 1
2 2
) (
) (
1
k
k k
k
Ed Ed
W (7)
Where :
W = weighting coefficient
k
Ed = Euclidean distances k = value of K in K-NN
To maximize the weighting result, the MSE value is added as a weighting factor. This method is expected can increase the accuracy of the system. The process of MSE weighting requires a reference position, whereas for this research the reference position is assumed as the actual position of the object.
The error value is calculated between the reference position with the estimated position based on MSE equation (8).
(
)
( )
| | xi x2 yi y2MSE= − + −
(8)
in which :
xi = estimation x coordinate x = refereence x coordinate
yi = estimation y coordinate
y = reference y coordinate
Based on equation (8), if MSE is added in weighting factor (7), it can be defined as (9):
+ =
= = 3
1 3 1
2 2
) ( ) (
1
k
k k
k
Ed MSE Ed
W (9)
Where :
W = Final weighting coefficient
k
Ed = Euclidean distances k = value of K in K-NN MSE = MSE of system
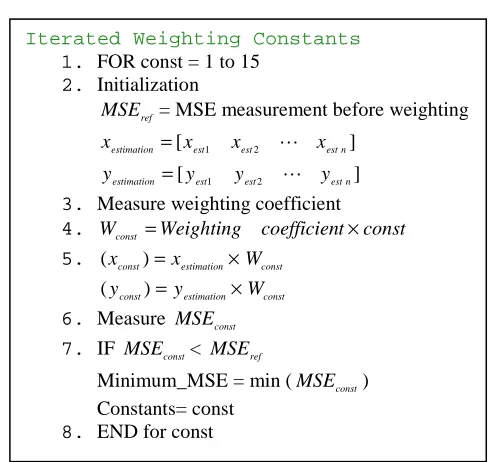
2) Iterated Weighting Constants
Weighting W gives a fairly good performance in the
system by the increase of accuracy results. The addition of a constant as weighting factor is expected to be able to reduce the value of error that occurs better than the regular weighting method. However, not all constant values can reduce errors in the system. The iterated weighting method is proposed to obtain suitable constants to reduce errors in estimation.
The corresponding constants are iterated starting from 1 to 15, with an increase of 0.1. This value is set according to the test, which concludes that the suitable constant values for
the system are no more than 15. The algorithm of iterated weighting constant (IWC) is shown in Fig. 3.
Fig. 3 Iterated Weighting Constants Algorithm
From the process of IWC, the system will get the best constant value for each object position. Thus, in the localization process, to obtain the estimation coordinates (x, y) of the object, it can be calculated by (10).
)) , ( (
)) , ( ( )) , ( ( ) ,
( 1 1 1 2 2 2
n est n est n const
est est const est
est const est wic
y x W
y x W y x W y
x × +
+ ×
+ ×
=
− ⋯
(10)
The result of coordinates (x, y) becomes the final output of the system. The result of IWC-KNN is compared with the conventional system to analyze the performance of the system.
III.RESULTS AND DISCUSSION
This section describes the overall system design, procedures, and scenarios of the localization system. System and analysis results are presented in this section based on estimation error and time computation.
A. Measurement
In this paper, the discussed system is based on real conditions in indoor locations. Obtaining the RSSI value for the fingerprint method is conducted at Pascasarjana PENS 4th floor. Several stages are needed in this process including: scenario of anchors placement, scenario of mapping grid in observation area, data retrieval, and fingerprint computation process.
The anchor placement scenario depends on the module used and the coverage area that can be reached by the device. The module used on this system is Raspberry Pi3 which is carried by the object as an unknown node to receive signals from the transmitter. Bluetooth Low Energy (BLE) as anchor node and as the signal transmitter on the system is installed in the observation area. The parameter of measurement is shown in Table 1.
Iterated Weighting Constants 1. FOR const = 1 to 15
2. Initialization
ref
MSE = MSE measurement before weighting ]
[ est1 est2 estn
estimation x x x
x = ⋯
] [ est1 est2 estn
estimation y y y
y = ⋯
3. Measure weighting coefficient
4. Wconst =Weighting coefficient×const
5. (xconst)=xestimation×Wconst
× = estimation
const y
y )
( Wconst
6. Measure MSEconst
7. IF MSEconst< MSEref
Minimum_MSE = min (MSEconst) Constants= const
Fig. 4 is an illustration of the 4th-floor map of Pascasarjana PENS building with the yellow area as the observation area. The area of observation is 443.52 m2.
Fig. 4. Map of 4th floor Pascasarjana PENS building.
TABLEI MEASUREMENT PARAMETER
Measurement Parameter
Mapping grid 3 m × 3 m
Area observation 443.53 m2
Transmitter bluetooth low energy
Receiver Raspberry PI3
Number of objects 4 objects
Amount of grid coordinates 28 coordinates
Four anchor nodes are installed in the corner of the observation room. This is related to the coverage of BLE as transmitter with region 50 m2.
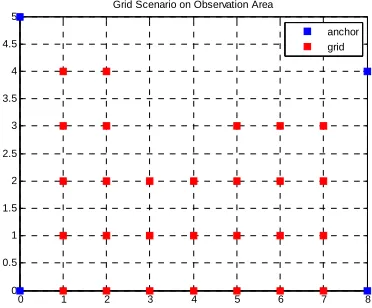
The next stage is to do a grid scenario in the observation area for the fingerprint method. A grid with the area 3 m × 3 m is built in the observation area, and in each grid intersection point is assigned with a coordinate value. Fig. 5 illustrates the grid in the observed area.
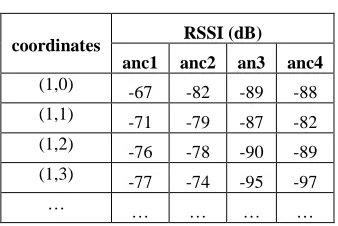
After building the grid scenario, the data retrieval is done by carrying a Raspberry PI3 device at the coordinate points of the grid scenarios from the grid mapping stage. The devices receive the Bluetooth signals from four BLE transmitters installed in the observation area. Ten RSSI values are taken and averaged for each coordinate from each anchor. The result of the averaging process represents the RSSI value of each point for each anchor as shown in Table 2. Then, offline database which contains the coordinates and their RSSI values in observation area can be created.
Offline data retrieval is completed and followed by online data retrieval. Online data is the RSSI data when an object with unknown position enters the observation area, then gets RSSI from all four anchor nodes. The RSSI value of online data is stored in the online database. Once the offline and online databases are fulfilled, the IWC-KNN fingerprint localization simulation can be done in the following stage.
B. Fingerprint KNN Simulation
Fingerprint KNN simulation has been done in [6]. After the offline and online database is built, KNN measures the Euclidean distance between the RSSI in offline and online database. Then, the result of measurement is sorted in ascending form. The nearest neighbor (K=1) in offline database based on the k-value is chosen as the estimation position. The previous research result [6], the fingerprint-KNN system could improve performance more than 50% better than the fingerprint system. The efficiency of time computation for fingerprint-KNN system also increased until 0.92 seconds faster than the fingerprint system.
C. Fingerprint IWC-KNN Simulation
The simulation is done by using MATLAB program. The result of the measurement is processed to get the estimated position of the object with the minimum error. The fingerprint algorithm process the data from offline database which is contained RSSI values and the grids along with their coordinates, and the online database which is contained averaged RSSI values of objects from all anchors.
Table 2 is illustrated the body of database. Both the position of the object and the position of the grid point coordinates have four RSSI representative values, there are RSSI from the first anchor, RSSI from the second anchor, RSSI from the third anchor and RSSI from the fourth anchor. The proximity of the object’s RSSI (online data) is calculated to all RSSI values in offline database with Euclidean distance equation.
The Euclidean distance results are sorted from the smallest value to the largest value. K-NN algorithm determines the output coordinate by doing a simple K-weighting. Euclidean values that have been sorted is taken based on the smallest value of K. Suppose if we use 3-NN, then 3 RSSI is taken from the offline database that produces the smallest Euclidean distance from the online database.
An output coordinate is calculated the MSE value with the reference coordinates. This MSE result is used as a weighting factor for the IWC-KNN algorithm.
0 1 2 3 4 5 6 7 8
0 0.5 1 1.5 2 2.5 3 3.5 4 4.5 5
Grid Scenario on Observation Area
anchor grid
TABLEII
RECEIVED RSSI IN DATABASE ILUSTRATION
In a system with the IWC-KNN algorithm, after obtained K possible coordinate values as output, the weighting factor is constructed using equation (7). This weighting is called the MSE weighting because it involves the MSE from the previous estimation process. Furthermore, the IWC-KNN algorithm is performed by multiplying the MSE weighting value with the value of the iterated constant until it reaches the optimum value for the system. Optimum value is dedicated when the iteration constant can reduce errors until a minimum point, before the turning point of curve happen. The iteration constant on the IWC-KNN forms a different curve pattern for each of the estimated positions, therefore the optimum constant for each object position may be different. Fig. 6 is shown the change of constants with step 0.1. There are three positions perform that the MSE curves turn down gradually until minimum peak, then the MSE values rise as the iteration increases. The constant value at the peak of the curve is the most appropriate of the constant value to use for optimization, since it can reduce the error until the minimum value. In the first object in Fig.6, it has a minimum peak point when the number of constant is 3, with a value of MSE 0.6708 m. the second object has a minimum MSE with a value of 1.5652 m for the constant number is 2.03. The third object has a minimum peak of constant in 6.4, with the minimum MSE 0.4485 m.
In Fig. 6 also shows that in different positions, the constants have the different effect on changes of MSE. After obtaining the accurate constant, the constant is multiplied by the MSE weighting result and generate the final weighting. This final weighting is multiplied by the estimated coordinates of the system results before the weighting process (conventional process).
In a previous research [6], KNN algorithms have been applied to the Fingerprint system for indoor localization in order to improve the accuracy of fingerprint system. The results show that the addition of KNN algorithm can improve the accuracy of the fingerprint system up to 66%. In this paper, the fingerprint-KNN system is modified by using an iterated weighting constant.
The expected result by adding IWC-KNN, the system can optimize the accuracy of fingerprint-KNN system when estimating the objects positions, which automatically reduce the errors occurred.
Fig. 6 Optimization constants curve for IWC-KNN
D. Performance Analysis
This chapter discusses the performance analysis of the system. Some conditions are simulated to test the reliability of system. Performance tests are done based on MSE percentage and computation time that impact on implementation system.
1) Simulation Result
The first simulation is done using IWC-KNN with K value modified with K=2, K=3 and K=4.
Fig.7 describes the change positions of an object. It can be seen that IWC-KNN at K=2, K=3 and K=4 has generally reduced the error value better than systems without IWC-KNN. In K=3 Error occurs once at position 22, while the value without weighting generates an error 0.177 m better than the IWC-KNN. In K=4 there are 7 from 22 positions that have similar errors. At K=2 there are 6 positions of 22 positions which are not reduced the error. Based on the results it can be concluded that the most effective error-reduction occurs when using K=3 compared to other K. Therefore for the next session, simulations use IWC-3NN to do the weighting.
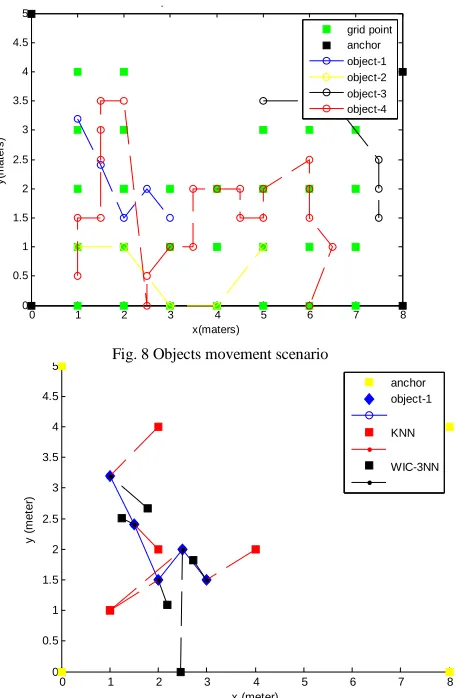
In the scenario of system there are 4 moving objects with different changes positions. In Fig. 8 illustrate the changes position scenario of the four objects. The first object (object-1) is marked by blue colour, which has a moving line starting from the coordinate (1,3.2), the second object (object-2) with the yellow marked, moves starting from the coordinate (1,1), the third object (object-3) with the black line starts the movement from the coordinate (5,3.5) and the fourth object (object-4) with the longest movement starts from the coordinate (1,0.5).
Fig. 7 MSE reduction in IWC-KNN coordinates RSSI (dB)
anc1 anc2 an3 anc4 (1,0) -67 -82 -89 -88
(1,1)
-71 -79 -87 -82 (1,2) -76 -78 -90 -89
(1,3)
-77 -74 -95 -97
… … … … …
0 5 10 15
0 2 4 6 8 10 12 14 16 18 20
Optimation Constant Curve
constants
M
S
0 1 2 3 4 5 6 7 8 0
0.5 1 1.5 2 2.5 3 3.5 4 4.5 5
x(maters)
y
(m
a
te
rs
)
Objects movement scenario
grid point anchor object-1 object-2 object-3 object-4
Fig. 8 Objects movement scenario
0 1 2 3 4 5 6 7 8
0 0.5 1 1.5 2 2.5 3 3.5 4 4.5 5
x (meter)
y
(
m
e
te
r)
anchor object-1
KNN
WIC-3NN
Fig. 9 Object-1 estimation simulation
TABLEIII
ESTIMATION RESULT FOR OBJECT 1 IN SYSTEM KNN AND IWC-KNN OBJECT-1
Real
KNN
-estimation MSE –KNN
(m)
IWC-KNN -estimation
MSE-IWC KNN (m)
X Y X Y X Y
1 3.2 2 4 1.2806 1.78 2.67 0.943 1.5 2.4 2 2 0.6403 1.25 2.50 0.2689 2 1.5 1 1 1.118 2.18 1.09 0.4476
2.5 2 1 1 1.8028 2.47 0 2.0003
3 1.5 4 2 1.118 2.73 1.82 0.4192
The movement of the objects in the scenario becomes the reference position to calculate the error value of the estimated position. Simulation results are shown for each object movements in order to obtain the differences clearly.
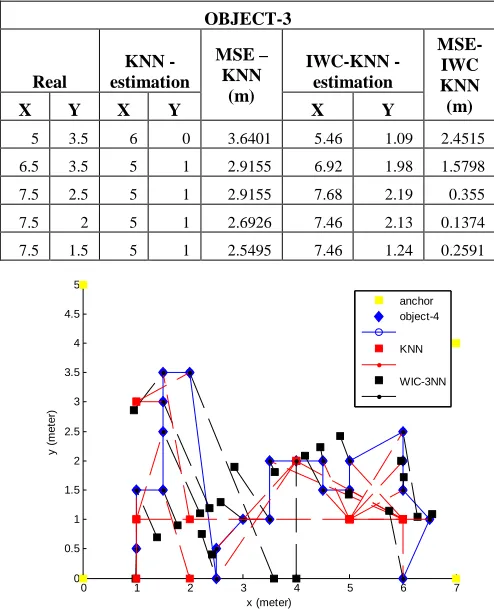
The estimation results for object-1 movements are shown in Fig.9. The object-1 has a tendency to stop between the grid points within the observation area. The first position of the object-1 is on coordinate (1,3.2). By using KNN algorithm the object is estimated at coordinate (2,4) while using IWC-KNN is estimated at (1.7,2.6). The second position, the object-1 is at (1.5,2.4), object-1 is estimated at (2,2) by the KNN method system, while using the IWC-KNN, object-1 is estimated closer to the real position, it is in (1.2,2.5). The third position when the coordinate is in (2,1.5), the KNN system estimate the object at (1,1), and it is
optimized with the IWC-KNN system becomes (2.1,1). The fourth position is in the coordinates (2.5,2), the object is estimated at (1,1) by KNN, while on the IWC-KNN the object is estimated at (2.4,0). In this estimation, optimization does not occur because there is no improvement done by IWC-KNN. In the fifth position is (3,1.5), KNN system estimates object-1 at coordinate (4,2), and it is optimized by IWC-KNN at (2.7, 1.8). The result of this system, if it is labeled, will be like Table 3.
The estimation result of the object-2 movements is illustrated in Fig. 10. The change positions scenario of object-2 have tendency to stop at the points of the fingerprint grid. In object-2 movements, IWC-KNN can optimize all movement positions that KNN has generated as shown in Table 4. For the first position is in (1,1), the estimation result by KNN algoritm is in (2,1). This position is optimized by IWC-KNN, then the estimation position become (0.99,0). The second position is in (2,1), it is estimated in (2,0) by using KNN, the IWC-KNN optimize and the estimation position becomes (1.5,1.5). The third position is in (3,0). By the KNN method, it is estimated in (1,0) and in (2.4,1.2) by IWC-KNN. The fourth position in is estimated in (1,1) by KNN algorithm and in (3.74,0.94) by IWC-KNN. The fifth position is estimated in (6,0) by KNN algorithm, and in (4.94,0.99) by IWC-KNN algorithm.
TABLEIV
ESTIMATION RESULT FOR OBJECT 2 IN SYSTEM KNN AND IWC-KNN
0 1 2 3 4 5 6 7 8
0 0.5 1 1.5 2 2.5 3 3.5 4 4.5 5
x (meter)
y
(
m
e
te
r)
WIC-3NN Estimation vs KNN Estimation
anchor object-2
KNN
WIC-3NN
Fig. 10 Object-2 estimation simulation OBJECT-2
Real
KNN
-estimation MSE –KNN
(m)
IWCKNN -estimation
MSE-IWC KNN (m)
X Y X Y X Y
1 1 2 1 1 0.99 0 1
2 1 2 0 1 1.50 1.50 0.7071
3 0 1 0 2 2.40 1.20 1.3416
4 0 1 1 3.1623 3.74 0.94 0.9704
0 1 2 3 4 5 6 7 8 0
0.5 1 1.5 2 2.5 3 3.5 4 4.5 5
x (meter)
y
(
m
e
te
r)
WIC-3NN Estimation vs KNN Estimation anchor object-3
KNN
WIC-3NN
Fig. 11 Object-3 estimation simulation
TABLEV
ESTIMATION RESULT FOR OBJECT 3 IN SYSTEM KNN AND IWC-KNN
0 1 2 3 4 5 6 7
0 0.5 1 1.5 2 2.5 3 3.5 4 4.5 5
x (meter)
y
(
m
e
te
r)
anchor object-4
KNN
WIC-3NN
Fig. 12 Object-4 estimation simulation
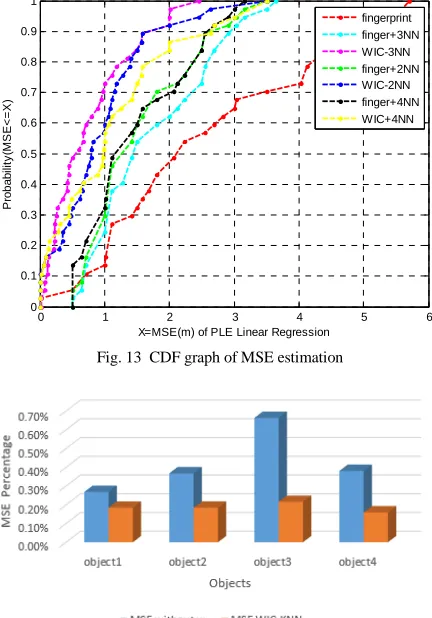
In object-3, there are five changes positions. The object-3 positions tend to be in an area outside the grid. The first position, the object is at the point (5.3.5), which is estimated at point (6.0) by KNN algorithm, then the position is optimized with IWC-KNN and the estimated position become (5.46, 1.09). The second position is estimated KNN at coordinates (5,1), whereas after IWC-KNN performs optimization the position becomes (6.92,1.98). The third position is in (7.5,2). It is processed by KNN and estimated in (5,1), while by IWC-KNN, it is estimated in (7.68,2.19).
whereas by IWC-KNN they are estimated in sequence (7.46, 2.13), (7.46,1.24). The IWC-KNN performs well in object-3. The estimation performance of the third object is illustrated in Fig.11 and tabled in Table 5.
The object-4 has 22 changes positions within the area of observation. In a large number of changes positions, there is no tendency where the object stopped and estimated. The movement object-4 is illustrated in Fig.12, with the estimation results shown in Table 5.
2) Performance Analysis
Based on the simulation results, the performance of the system can be analyzed based on several aspects, including the average error estimation value shown in MSE, the percentage of optimization performed by the IWC-3NN system, and computation time discussed in the subsequent chapter.
Fig. 13 shows the cumulative distribution function (CDF) of the MSE value for each method.
TABLEVI
ESTIMATION RESULT FOR OBJECT 4 IN SYSTEM KNN AND IWC-KNN OBJECT-4
Real
KNN
-estimation MSE KNN (meters)
IWCKNN -estimation
MSE-IWC KNN (meters)
X Y X Y X Y
1 1 1 1 0.500 0.99 0.00 0.500
1 2 1 0 1.500 1.40 0.70 0.894
2 2 2 0 0.707 1.79 0.89 0.671
2 3 1 1 2.550 2.19 1.10 1.565
2 3 1 3 3.041 2.37 1.19 2.013
2 4 2 1 0.707 0.95 2.86 0.606
2 4 1 3 3.500 3.59 0.00 0.224
3 0 4 2 2.500 2.24 0.75 0.791
3 1 4 2 2.121 2.43 0.41 0.115
3 1 6 1 1.414 2.59 1.29 0.424
4 1 1 1 2.500 2.84 1.89 1.111
4 2 6 1 2.693 3.60 1.80 0.224
4 2 6 1 2.236 4.01 0.00 2.000
5 2 5 1 1.118 4.46 2.23 0.232
5 2 5 1 0.707 4.17 2.09 0.672
5 2 6 1 1.118 5.00 1.43 0.072
5 2 6 1 1.414 4.83 2.42 0.449
6 3 5 1 1.803 6.28 1.05 1.480
6 2 5 1 1.414 5.98 1.99 0.024
6 2 5 1 1.118 6.02 1.72 0.220
7 1 5 1 1.500 6.56 1.09 0.113
6 0 6 1 1.000 5.74 1.15 1.177
Based on the Fig. 13 graphs, the system which has the smallest and highest MSE value can be known. The systems using IWC-based have the smallest MSE of systems in CDF graph. Based on the graph, the system using fingerprint OBJECT-3
Real
KNN -estimation
MSE – KNN (m)
IWCKNN -estimation
MSE-IWC KNN (m)
X Y X Y X Y
5 3.5 6 0 3.6401 5.46 1.09 2.4515 6.5 3.5 5 1 2.9155 6.92 1.98 1.5798
7.5 2.5 5 1 2.9155 7.68 2.19 0.355
7.5 2 5 1 2.6926 7.46 2.13 0.1374
IWC -2NN. The system using IWC-4NN becomes the third of the smallest MSE. The IWC systems have the MSE better than all the fingerprint and KNN system. The highest MSE based on the CDF graph is the system using a conventional fingerprint.
Fig. 14 is shown the percentage of MSE average. In object-1, a system use KNN without weighting has an average error percentage of 0.27%. After optimized using IWC-KNN, the average percentage of errors decreased to 0.18%. In object-2, the average error on the system with conventional KNN is 0.37%, then IWC-KNN decreases the MSE value until 0.18%. Object-3 has the average error of 0.66%, it is reduced to 0.22% by using IWC-KNN. The object-4 has 0.38% of MSE with KNN system, while using IWC-KNN its value drops to 0.16%.
Based on the percentage of MSE average comparison, the optimization of KNN system using IWC-KNN is shown in Fig. 15. The highest optimization occurs in object-3, which has the distribution of positions outside the grid area. Optimization occurs 48% for object-3. This may be caused when the displacement of the object position outside the grid causing a high error value, so the optimization of IWC-KNN provide a big influence.
The second highest optimization is in object-4, which has 22 positions changes. It has an optimization percentage of 24%. In object-2 the optimization of the system is 20% and the smallest optimization value occurs in object-1 with the value of 9%.
Based on the optimization percentages occur on each object, if it is averaged, the systems with IWC-KNN can optimize the conventional system up to 25%.
0 1 2 3 4 5 6
0 0.1 0.2 0.3 0.4 0.5 0.6 0.7 0.8 0.9 1
X=MSE(m) of PLE Linear Regression
P
ro
b
a
b
ili
ty
(M
S
E
<
=
X
)
fingerprint finger+3NN WIC-3NN finger+2NN WIC-2NN finger+4NN WIC+4NN
Fig. 13 CDF graph of MSE estimation
Fig. 14 Percentage of MSE average for objects estimation
Fig. 15 Percentage of optimization average
3) Computation Time Performance Analysis
The computing time of the system is analyzed to find out the time required to process and analyzed system whether it is decreasing or increasing in speed. This becomes something critical to be analyzed because it will affect the implementation of the system in real time conditions.
The reality is computational time can be influenced by many things other than the algorithm used, such as devices and software performed for computing. In this simulation, device and software specifications are shown in Table 6.
The system computing will be compared by the computation time between systems that use IWC-KNN with the conventional system.
Based on Fig. 16, it shows the computing time required for each object for both systems. In a system that uses KNN, object-1 takes 6.618114 seconds, whereas with the system using IWC-KNN the required time is 6.618415 seconds.
There is a difference of computing time between both of algorithm but not significant. In the second object, with the KNN system, the system takes a computation time of 6.197704 seconds, while with the IWC-KNN process, computing becomes 6.197986. The third object with KNN produces computation time 6.674234 seconds, while IWC-KNN needs 6.674525 seconds. Based on these result the three objects with 5 changes positions, have the same average computation time. The fourth object with 22 changes position, the computation time changes considerably to 19.71084 on the system with KNN, and 19.75066 on the IWC-KNN system.
Based on the observation of time computation, it is shown that although IWC-KNN can optimize KNN with high accuracy IWC-KNN time computation system takes longer time than the system using KNN. This may happen because there is an additional process of weighting on the system.
TABLEVI
DEVICE AND SOFTWARE SPESIFICATION IN SIMULATION
Tools Remarks
Hardware Processor : AMD APU E1 RAM : 6 GB
Software MATLAB R2013A
Fig. 16 Time computation graph
IV.CONCLUSIONS
This paper discusses a Fingerprint-based localization system with an iterated weighting constant algorithm. This scenario requires RSSI measurements performed by using Raspberry PI 3 as the mobile node and BLE as the communication module. There are three stages in this system, the first is the fingerprint method that generates offline and online databases. The second stage is the two databases are processed by KNN. The output position of KNN process as the estimated coordinate and the MSE value becomes the initial input for the IWC-KNN algorithm. The third is to build a weighting factor on the estimated position by using the MSE value before weighting then multiplying it by the constant which is produced by the iteration algorithm in order to optimize the KNN estimation until it reaches the minimum error. The comparison results show that the fingerprint IWC-KNN system is able to optimize the fingerprint-KNN system up to 25%. However, due to the weighting process, IWC-KNN computation time takes 0.01 seconds longer than KNN.
REFERENCES
[1] Rafina Destiarti, Prima Kristalina, and Amang Sudarsono, "Modified Iterated Extended Kalman Filter for Mobile Cooperative Tracking System", International Journal on Advanced Science Engineering Information Technology, vol.7, no.3, 2017.
[2] Shreyanka B. and Sayed Abdulhayan, "Indoor Localization Solution for GPS", International Journal of Research Granthaalayah, vol.5, issue: 4, April 2017.
[3] Pei Jiang, Yunzhou Zhang, and Wenyan Fu, "Indoor Mobile Localization Based on Wi-Fi Fingerprint’s Important Access Point", International Journal of Distributed Sensor Networks, vol.2015, 8 pages, March 2015.
[4] Prima Kristalina and Aries Pratiarso, "An Adaptive Connectivity- based Centroid Algorithm for Node Positioning in Wireless Sensor Networks", EMITTER, vol.3 no.1, June 2015.
[5] Tom Van Haute and Eli De Poorter, "Performance Analysis of Multiple Indoor Positioning System in a Health Environment", International Journal of Health Geographics 2016, vol.15, no.7, February 2016.
[6] Asti Putri Rahmadini, Prima Kristalina, and Amang Sudarsono, "An Improved Fingerprint Method Based on K-NN Algorithm for Indoor Multiple Object Tracking", proceeding on IES 2017, 26-27 September 2017.
[7] Xiaoyong Yan, Aiguo Song, and Hao Yan, "A Graph Embedding Method Based on Sparse Representation for Wireless Sensor Network Localization", International Journal of Distributed Sensor Network, vol.2014, 13 pages, July 2014.
[8] Haroon Rashid and Ashok Kumar Turuk, "Dead Reckoning Localization Technique for Mobile Wireless Sensor Network", IET Wireless Sensor System, pp: 87-98, April 2015.
[9] Sandy Mahfouz, Farah Mourad-Chehade, Paul Honeine, Joumana Farah, and Hichem Snoussi, “Target Tracking Using Machine Learning and Kalman Filter in Wireless Sensor Networks”, IEEE Sensors Journal, vol.14, issue:10, pp:3715-3725, October 2014. [10] Xiaomei Liang, Xueoung Gou, and Yong Liu, "Fingerprint-Based
Location Positioning Using Improved KNN", 3rd IEEE International Conference on Network Infrastructure and Digital Content, pp: 57-61, 2012.
[11] Min-Seok Choi and Beakcheol Jang, "An Accurate Fingerprinting based Indoor Positioning Algorithm", International Journal of Applied Engineering Research, vol.12, no.1, 2017.
[12] Yiran Peng, Wentao Fan, Xin Dong, and Xing Zhang, "An Iterative Weighted KNN (IW-KNN) Based Indoor Localization Method in Bluetooth Low Energy (BLE) Environment", IEEE, France, 2017. [13] Wen Liu, Xiao Fu, Zhongliang Deng, Lianming Xu, and Jichao Jiao,
“Smallest Enclosing Circle-based Fingerprint Clustering and Modified-WKNN Matching Algorithm for Indoor Positioning”, International Conference on Indoor Positioning and Indoor Navigation (IPIN), Spain, October 2016.
[14] Mouhammd Alkasassbeh, Ghada A. Altarawneh, and Ahmad B. Hassanat, "On Enhancing The Performance of Nearest Neighbour Classifiers Using Hassanat Distance Metric", Canadian Journal of Pure and Applied Sciences (CJPAS), vol.9, issue: 1, Feb 2015. [15] Jianping Gou and Taisong Xiong, "A New Distance-Weighted
k-Nearest Neighbor Classifier", Journal of Information & Computational Science, vol.9, no.6, 2012.