An efficient optic cup segmentation
method decreasing the influences of blood
vessels
Chunlan Yang
1*, Min Lu
1, Yanhua Duan
1and Bing Liu
2Background
Optic cup is an important retinal structure in ophthalmologic diagnosis such as glau-coma [1, 2]. Glaucoma is the second leading disease to blindness worldwide [3]. Given the lack of visual symptoms in the early stages, several studies showed that more than 90% of the patients were unaware of this disease until it has developed into the severe stages [4–6]. Since it is time cost and the precision of diagnosis by manual is limited, then the automatic technique for disease detection such as computer aided diagnosis (CAD) system is strongly needed [7].
With the development of computer science, medical image processing technique has been successfully applied to clinical diagnosis and treatment. Currently, digital fundus
Abstract
Background: Optic cup is an important structure in ophthalmologic diagnosis such as glaucoma. Automatic optic cup segmentation is also a key issue in computer aided diagnosis based on digital fundus image. However, current methods didn’t effectively solve the problem of edge blurring caused by blood vessels around the optic cup.
Methods: In this study, an improved Bertalmio–Sapiro–Caselles–Ballester (BSCB) model was proposed to eliminate the noising induced by blood vessel. First, morpho-logical operations were performed to get the enhanced green channel image. Then blood vessels were extracted and filled by improved BSCB model. Finally, Local Chart-Vest model was used to segment the optic cup. A total of 94 samples which included 32 glaucoma fundus images and 62 normal fundus images were experimented.
Results: The evaluation parameters of F-score and the boundary distance achieved by the proposed method against the results from experts were 0.7955 ± 0.0724 and 11.42 ± 3.61, respectively. Average vertical optic cup-to-disc ratio values of the normal and glaucoma samples achieved by the proposed method were 0.4369 ± 0.1193 and 0.7156 ± 0.0698, which were also close to those by experts. In addition, 39 glaucoma images from the public dataset RIM-ONE were also used for methodology evaluation.
Conclusions: The results showed that our proposed method could overcome the influence of blood vessels in some degree and was competitive to other current optic cup segmentation algorithms. This novel methodology will be expected to use in clinic in the field of glaucoma early detection.
Keywords: Optic cup, Digital fundus image, Segmentation, Blood vessel, BSCB model
Open Access
© The Author(s) 2018. This article is distributed under the terms of the Creative Commons Attribution 4.0 International License (http://creat iveco mmons .org/licen ses/by/4.0/), which permits unrestricted use, distribution, and reproduction in any medium, provided you give appropriate credit to the original author(s) and the source, provide a link to the Creative Commons license, and indicate if changes were made. The Creative Commons Public Domain Dedication waiver (http://creat iveco mmons .org/publi cdoma in/zero/1.0/) applies to the data made available in this article, unless otherwise stated.
RESEARCH
image has been widely used in many hospitals. Thus, it is possible to develop the CAD system used for ophthalmologic diagnosis based on fundus image processing technique [8–11].
The OD includes two distinct parts, namely, a circumjacent zone called the rim and a central bright region called the optic cup [12]. The optic cup can be divided into nasal and temporal regions. The former is generally occluded by the main blood vessels. Phys-iologically, the loss in optic nerve fibers (ONF) leads to the enlargement of optic cup which is called large cupping, and atrophy of neuroretinal rim which is called rim loss. Large cupping and rim loss are two important indicators of glaucoma. They could be detected by measuring the vertical optic cup-to disc ratio (CDR) [13]. Once more ONF disappear, the optic cup will become larger with respect to the optic disc, which corre-sponds to CDR increasing. In generally, an abnormal vertical CDR indicate a high risk of glaucoma. Therefore, automatic segmentation of the optic cup is crucial for CAD system for glaucoma.
To date, there are few studies on optic cup segmentation algorithms, which include thresholding-based methods [14–16], region growing [17, 18], model-based methods (active contour models or snakes [19, 20], level sets [21, 22], and elliptical shape model [23]), anatomical evidence-based methods [24], and superpixel classification [25–27]. Optic cup segmentation is challenged because the intensity has a sudden change in areas which blood vessels pass across the cup-disc boundary. However, most studies haven’t solved this problem effectively. Thus, inpainting of the blood vessels is an important step in optic cup segmentation.
This study aims to develop an efficient method to overcome the aforementioned prob-lem in optic cup segmentation. Morphological operations were first performed to get the enhanced green channel image. Then, blood vessels were extracted and filled by using an improved Bertalmio–Sapiro–Caselles–Ballester (BSCB) model. Finally, local chart-vest (LCV) model was used to segment the optic cup.
The remainder of this paper is organized as follows: first, we introduced the image data used in this study and presented the proposed methodology, an efficient optic cup seg-mentation method decreasing the influences of blood vessels. The experimental results are then provided, followed by discussions and conclusions.
Methods Data acquisition
and diabetes. Their ages were ranged from 31 to 63 years old (43.51 ± 5.27 years). In addition, 39 glaucoma images from the public dataset RIM-ONE (An Open Retinal Image Database for Optic Nerve Evaluation) were also used for evaluation [28].
Optic cup segmentation
The edge of optic cup is more difficult to identify compared with that of optic disc, primarily because the image is blurred where the blood vessels pass across the optic cup. After preprocessing such as image enhancement, blood vessels were extracted and inpainting. Then the optic cup was segmented by using LCV model.
Preprocessing
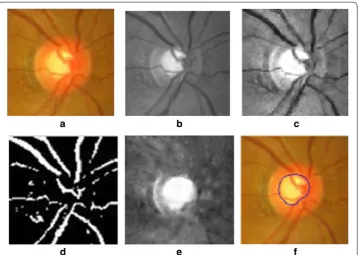
Among the image components of color which are red (R), green (G) and blue (B), the G channel shows the optimal image contrast for the optic cup (see Fig. 1). Therefore, the G channel image UG was selected for the subsequent processing.
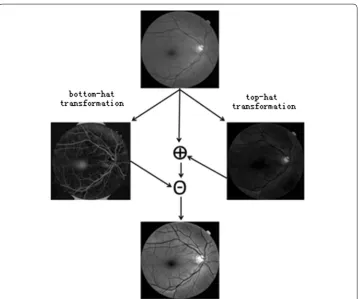
In the proposed algorithm, both top-hat and bottom-hat transformations were applied to enhance the image contrast [27]. Top-hat transformation refers to the sub-traction of the opening operation result from the image itself. By contrast, bottom-hat transformation refers to the subtraction of the image from the result of closing operation. Both top-hat and bottom-hat transformations are based on a predefined neighborhood or structuring element (SE). The above two transformations are illus-trated as Eqs. (1) and (2), respectively.
Here, a structuring element with a size of 5 × 5 pixels was used (more details of size selection were provided in “Results” section). The above two transformations could be represented as Eq. (3), the boundary of optic cup become clearer after the operations (see Fig. 2).
(1) That(UG)=UG−(UG◦SE)
(2) Bhat(UG)=(UG·SE)−UG
(3) U =(UG+That(UG))−Bhat(UG)
Blood vessel extraction
Since the intensities of blood vessels were lower than those of background and other structures, the intensities of blood vessels will become higher after median filtering. Therefore, the blood vessels could be possibly identified based on the intensity differ-ence. In order to capture the change of image intensity, the contrast enhanced image
U was subtracted from the median filtered image Umed. Then the intensity differential image could be acquired which was represented by Eq. (4).
The binary image UD was generated according to the value of Usub [29]. Only the intensities of pixels with corresponding Usub > 0 were set to 1 according to Eq. (5). These pixels were considered belonging to blood vessels (see Fig. 3d).
In this study, the size of median filtering was set to 9 × 9 pixels (more details of size selection were provided in “Results” section).
(4)
Usub=Umed(i, j)−U(i, j)
(5) UD(i, j)=
1, ifUsub>0
0, otherwise .
Blood vessels inpainting
Bertalmio et al. [30] proposed the novel BSCB model for image inpainting in 2000 based on theory of partial differential equation (PDE). The BSCB model uses Laplace operator to measure the neighborhood information for image inpainting. It smoothly propagates the information to the same region along the direction of isophote. At the same time, an anisotropic diffusion function is adopted to prevent the prolonga-tion lines from crossing one to another. Generally, the model comprises two steps: inpainting and diffusion. In this study, the improved BSCB model was developed, that is, the neighborhood intensities were used as the propagation information, instead of using only one single pixel.
After the above processing, the intensity will become more uniform within the area of optic cup. The influence caused by the blood vessels will be decreased. The following were the detailed descriptions about the processing procedure.
Assuming Ω is the region to be inpainted and ∂D is the boundary of Ω. The BSCB model can be described by Eqs. of (6) and (7) [31, 32].
Equation (6) represents inpainting, where ∇L is the propagation information and T is the isophote direction. Equation (7) is used for diffusion, where k is the Euclidean curvature
(6) ∂U
∂t = ∇L· �T
(7) ∂U
∂t =gεk|∇U|.
of the isophote and Ωɛ is the dilation of Ω with a balling radius of ε, and gɛ is a smooth-ing function of Ωɛ.
To be easier understanding, Eqs. of (6) and (7) can be comprehensively described as follows.
Here Un+1(i, j) is the value of pixel intensity located at (i, j) in the n-th iteration image which Un
τ(i, j)= ∇L· �T . Notably, U0(i, j) =U(i, j) and nlim→∞Un
i, j = Ur
i, j
, where
U0(i, j) is the input image, U
r(i, j) is the output of the algorithm, and Δt is the improve-ment rate.
In the traditional BSCB model, propagation information Ln(i, j) is substituted by the discrete Laplace operator, which is shown in Eq. (10).
Although texture could be the transfer information for image inpainting, it is not necessary in optic cup segmentation. In contrast, local image information is more effective. Therefore, using neighborhood mean value as transfer information may eliminate the influence of noise. According to the above deduction, unxx
i, j
and unyy
i, j
were replaced by un xx
i, j
and un yy
i, j
in the following vascular inpainting, represented by Eqs. (11) and (12) respectively. In this study, the size of neighborhood was set to 3 × 3 pixels.
Optic cup boundary identification
Wang et al. [33] proposed a LCV model which included local statistical information in level set based segmentation framework. In the algorithm, extended structure ten-sor (EST) was combined which intensity inhomogeneity could be decreased effec-tively. In this study, the above-mentioned LCV model was used for the following optic cup segmentation.
First, the centroid (xc, yc) was selected from the region with relative high intensity, which was acquired according to the following criteria represented as Eq. (13)
(8)
Un+1
i, j
=Un
i, j
+�tUτn
i, j , ∀ i, j ∈�, (9) Un+1
i, j =Un
i, j +�tgε
i, j
k
i, j, n ∇U
i, j, n , ∀
i, j ∈�ε,
(10)
Ln
i, j
=unxx
i, j
unyy
i, j . (11) un xx i, j
= 1
9
i+1
m=i−1 j+1
n=j−1
unxx(m, n)
(12) un
yy
i, j = 1
9
i+1
m=i−1 j+1
n=j−1
unyy(m, n)
(13) xc=
1 N
N
i=1
xi, yc=
Here N is the total number of pixels within the target region.
In this step, two parameters need dynamic adjusted in the LCV model, i.e., α and μ. Commonly, α was set to 0.1 or 1, depending on whether the image has intensity inho-mogeneity. For μ, two corresponding values are adopted: 0.01 × 2552 and 0.1 × 2552. If several targets need to be detected, μ should be small, and vice versa. Because the optic cup area has intensity inhomogeneity and only the optic cup be the target, the values of α and μ were then set to 0.1 and 0.1 × 2552 respectively.
Evaluation
The experimental results were evaluated by three statistical criteria, namely, F-score (area-based), distance (curve-based) and vertical CDR, which were explained in “F-score (F)”, “Distance (D)”, and “Vertical CDR” sections.
Besides the proposed algorithm, the experiments were also performed by two other known methods, proposed by Joshi et al. [17] and Liu et al. [21]. There are two rea-sons why the above methods were selected to be compared. First, since the optic cup segmentation could be classified into framework of region based, edge based and hybrid, the proposed algorithm and another two selected methods all belong to region based method. Second, the proposed method aimed at decreasing the influ-ence of blood vessels, which was similar to the other selected methods putting for-ward to the solutions.
In details, Joshi et al. [17] imposed the expected symmetry of optic cup region by setting threshold to recover the under-segmentation areas located in the blood ves-sels. Liu et al. [21] used ellipse to redraw the optic cup boundary after employing a combinative algorithm with level set and threshold setting, which was to weaken the noising by blood vessels.
For each method, the evaluation of F-score and distance were compared. The ver-tical CDR values were presented against manual segmentation results achieved by experts.
F‑score (F)
The pixel-wise precision and recall values were computed to assess the overlap area between the computed region and the ground truth. These values were defined as Eqs. (14) and (15),
where TP, FP, and FN represented the number of true positive, false positive, and false negative pixels respectively. The harmonic mean of the precision and recall values, called F-score (F), was computed to better appreciate the results. The F-score was expressed in Eq. (16),
(14)
precision= TP TP+FP
(15) recall= TP
Given that both recall and precision are evenly weighted, the F-score value lies between 0 and 1, and the recall, precision, F-score should be all ideally close to 1.
Distance (D)
To assess the accuracy of the boundary, a curve-based evaluation is performed. Let Ce be the boundary identified by the ophthalmologist and Cm be the boundary achieved by the proposed algorithm. The distance (D) which was computed in pixels between two curves was expressed as Eq. (17),
Here, n is the number of angles, the distance from centroid of Ce to the points on Ce in direction of θ was defined as deθ, similar with the definition of dmθ. D should be close to 0 for an accurate algorithm.
Vertical CDR
To estimate the vertical CDR, the optic disc must be segmented ahead. Compared to optic cup, optic disc segmentation is relatively easier. In this study, to ensure the accu-racy of the CDR and evaluate the effectiveness of the proposed algorithm, the optic disc was manually delineated by experts. The vertical CDR was calculated by Eq. (18) pro-posed by Gloster et al. [34],
where CV represented the vertical diameter of optic cup, and DV represented the vertical diameter of optic disc. CV and DV were determined by the distances from the top to the bottom of these diameters, as shown in Fig. 4. In clinic, the risk of suffering glaucoma increases with the value of CDR.
Results
A total of 94 digital fundus images, including 32 glaucoma images, were experimented using the proposed algorithm. The algorithm was individually evaluated against manual segmentation results by expert-1 and expert-2, and also against the average expert mark-ing called expert-X. For comparison, the results obtained by two other known methods of Joshi et al. [17] and Liu et al. [21], were also presented in evaluation of F-score and distance.
The optic cup segmentation results were shown in Fig. 5. In order to compare with the other above mentioned methods, more examples were shown in Fig. 6. The evalu-ation results of F-score and distance were shown in Tables 1 and 2. The values of CDR achieved by experts and the proposed method were also compared shown in Fig. 7. The statistical results of CDR for normal and glaucoma data were listed in Table 3.
(16)
F=2precision·recall
precision+recall
(17) D= 1
n
θn
θ=1
deθ−dθm ,
(18)
The selections of parameters used in the algorithm were also evaluated. For the SE used in morphometric operations of preprocessing, the size from 2 × 2 pixels to 15 × 15 pixels have been experimented. Representative results were shown in Fig. 8 and
Fig. 4 Illustration of vertical CDR measurement criteria
Table 4. Representative results of median filtering (window size is from 3 × 3 pixels to 15 × 15 pixels, interval of 2 × 2 pixels) were shown in Fig. 9 and Table 5.
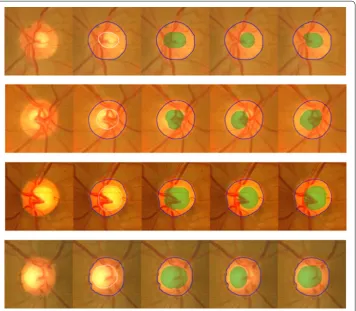
From the results of Figs. 5 and 6, the proposed algorithm achieved the satisfied seg-mentation results which were better than the methods proposed by Joshi et al. [17] and Liu et al. [21]. Although both of them also considered the influence caused by blood vessels and proposed the corresponding ways trying to decrease the influence, our pro-posed method showed competitive to overcome the difficulty in areas with a lot of blood
Fig. 6 Illustration of comparisons among the segmentation results. From left to right are original images, results achieved by experts, by Joshi et al., by Liu et al. and our proposed method
Table 1 F-score acquired by different methods
Expert Joshi et al. [17] Liu et al. [21] Proposed
Expert-1 0.6125 ± 0.1139 0.7010 ± 0.0901 0.7955 ± 0.0724
Expert-2 0.6235 ± 0.0999 0.7245 ± 0.1032 0.7780 ± 0.0794
Table 2 Boundary distance in radial direction acquired by different methods (in pixels)
Expert Joshi et al. [17] Liu et al. [21] Proposed
Expert-1 22.82 ± 5.00 16.78 ± 3.95 11.42 ± 3.61
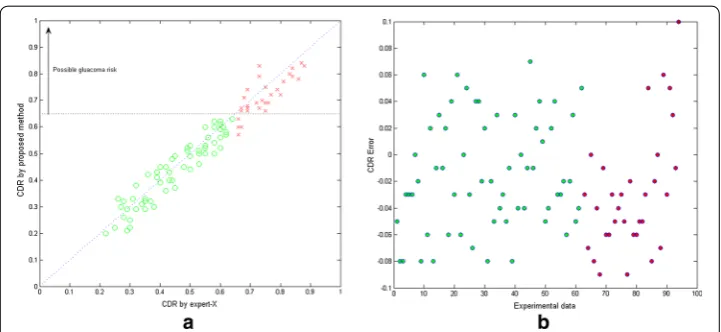
Fig. 7 Comparison results of CDR achieved by experts and the proposed method. a CDR values achieved by experts vs. by proposed method, b errors between the results by experts and the proposed algorithm
Table 3 Average CDR values for normal and glaucoma
Method Normal Glaucoma
Proposed 0.4369 ± 0.1193 0.7156 ± 0.0698
Expert 0.4516 ± 0.1176 0.7444 ± 0.0666
Fig. 8 Comparison results with different SE size. From left to right are optic cup segmentation results acquired without morphometric operation, with size of 2 × 2 pixels, 5 × 5 pixels, 10 × 10 pixels, 15 × 15 pixels and by the experts
Table 4 The precisions of optic cup segmentation with different size of structuring element used in the morphometric operations
Image type 2 × 2 pixels 5 × 5 pixels 10 × 10 pixels 15 × 15 pixels
Normal 0.7950 ± 0.0600 0.8914 ± 0.0300 0.6964 ± 0.0600 0.5900 ± 0.1600 Glaucoma 0.5753 ± 0.2000 0.7218 ± 0.0400 0.4415 ± 0.2100 0.2519 ± 0.1100
vessels. In addition, both the maximum F-score and minimum distance of our proposed method were acquired. That is, the accuracy of the proposed method is better than the other two. Furthermore, the standard deviations of F-score and distance were also lower which showed the robustness of the proposed method.
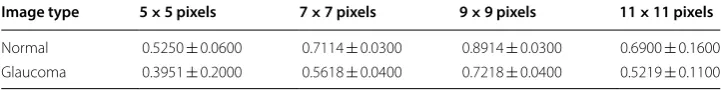
From results of Fig. 8 and Table 4, the size of SE was suggested to be selected as 5 × 5. From results of Fig. 9 and Table 5, the window size of median filtering was suggested to be selected as 9 × 9.
In order to evaluate whether our proposed method is feasible and comparable to the most recent published optic cup segmentation algorithms [35–37], also 39 glau-coma images from the public database RIM-ONE were experimented. F-score and CDR acquired by our proposed method and these referenced algorithms were listed in Table 6. From the results, F-score acquired by our proposed method is acceptable and the corresponding CDR is more close to the manual results by experts.
Discussion
The proposed algorithm and the other two above mentioned methods used for com-parison all put forward the solutions aimed at reducing optic cup segmentation errors caused by blood vessels. Given the figures listed in results, it can be concluded that the proposed method will give rise to higher F and lower D, which was hence bet-ter in optic cup segmentation. Joshi et al. [17] imposed the expected symmetry of cup region in nasal and temporal side after threshold processing to recover the vessel errors. A vertical axis of symmetry passing through optic disc center was considered and nasal region was obtained by mirroring the temporal region. Therefore, the seg-mentation results were decided completely by the segseg-mentation quality of temporal region. However, most of the cups are not symmetrical about the vertical axis pass-ing through optic disc center. What is more, as the acquisition conditions like pho-tographic angle changes, the shapes of both sides are various which also causes the uncertainty of the relative size on both sides, leading to under-segmentation or over-segmentation of nasal side after the operation of symmetry. Liu et al. [21] applied ellipse fitting to redraw the cup boundary for weakening vessel influence in the seg-mentation process. Nevertheless, the ellipse fitting was implemented after employing combinative algorithm of level set and color intensity thresholds which didn’t take
Table 5 The precisions of optic cup segmentation with different size of median filtering
Image type 5 × 5 pixels 7 × 7 pixels 9 × 9 pixels 11 × 11 pixels
Normal 0.5250 ± 0.0600 0.7114 ± 0.0300 0.8914 ± 0.0300 0.6900 ± 0.1600 Glaucoma 0.3951 ± 0.2000 0.5618 ± 0.0400 0.7218 ± 0.0400 0.5219 ± 0.1100
Table 6 Comparison with the recent algorithms based on public database RIM-ONE
Criteria Haleem et al. [35] Al-Bander
et al. [36] Bechar et al. [37] Proposed Expert
F-score – 0.6903 0.8643 0.8127 –
the vessel into account because of its low intensity. Thus only the minor remission of the errors caused by vessels could be reached after fitting, serious under-segmenta-tion still cannot be avoided. By contrast, the proposed scheme firstly fills the blood vessels by an improved BSCB model, making the whole cup area more uniform for the following segmentation,then the optic cup is determined through the LCV model approach which can capture the unsharp boundary of cup, reducing under-segmenta-tion or over-segmentaunder-segmenta-tion to a great extent compared with other methods.
For the CDR evaluation in Table 3, the CDR values by the proposed algorithm are little smaller than those by expert, which indicates that the cup region determined by the proposed method was little smaller toward upper cup edge and lower cup edge than that determined by expert. The CDR values are little too small caused the mis-diagnosis of four patients with glaucoma as normal in the experiment. The reason is that, for the dense vascular area near the cup edge, the grayscale is close to that of the neuroretinal rim after inpainting, leading to little local insufficient segmentation. But the difference of CDR between the proposed method and expert is small, thus the CDR was in the range of normal.
To sum up, we have proposed a novel automatic optic cup segmentation algorithm based on inpainting of blood vessels in this study. Compared with other techniques, the proposed methodology has several advantages.
1. The proposed algorithm repaired the vascular regions by using an improved BSCB model, reducing the errors caused by blood vessels to a large degree and improving the segmentation accuracy;
2. In LCV model, the centroid point located in area with higher intensity was selected as the starting point, which realized the automatic selection of the seed point. In addition, the loose selection of circular radius make the initial contour easily be auto-matically selected.
3. The proposed algorithm realized fully automatic segmentation with high accuracy, which reduced the human intervention of the traditional semi-automatic method.
The proposed method also has some limitations. First, the region of optic cup seg-mented by the proposed method was slightly smaller than that identified by experts, especially in the dense vascular area. It may be because parts of the image intensities near the edge of optic cup are close to these of the neuroretinal rim after inpainting. Accordingly, local insufficient segmentation will be happened. Second, the robustness of the algorithm is expected to improve. Since the used experimental data were col-lected from the same type of camera, more data from different type of camera should be tested and the robustness of the algorithm will be improved.
Conclusion
Authors’ contributions
CY, ML and YD made contributions to the conception, design and analysis of data. ML, YD and BL made contributions to the data processing. CY made contributions to the revision of the final manuscript. All authors read and approved the final manuscript.
Author details
1 College of Life Science and Bioengineering, Beijing University of Technology, Beijing 100124, China. 2 Department of Ophthalmology, Hospital of Beijing University of Technology, Beijing 100124, China.
Acknowledgements
This work was supported by Beijing Excellent Talents Project (No. 2011D005015000008) and project grants from Beijing Nova Program (xx2016120), National Natural Science Foundation of China (81101107), Natural Science Foundation of Beijing (4162008) and Beijing Municipal Education Commission (PXM2017_014204_500012), program for top young innovative talents of the Beijing Educational Committee (CIT&TCD201404053).
Competing interests
The authors declare that they have no competing interests.
Publisher’s Note
Springer Nature remains neutral with regard to jurisdictional claims in published maps and institutional affiliations.
Received: 18 April 2018 Accepted: 15 September 2018
References
1. Weinreb RN, Aung T, Medeiros FA. The pathophysiology and treatment of glaucoma: a review. JAMA. 2014;311(18):1901–11.
2. Lee S, Young M, Sarunic MV, et al. End-to-end pipeline for spectral domain optical coherence tomography and morphometric analysis of human optic nerve head. J Med Biol Eng. 2011;31(2):111–9.
3. Chen SLJ. Detection of the optic disc on retinal fluorescein angiograms. J Med Biol Eng. 2011;31(6):405–12. 4. Shen SY, Wong TY, Foster PJ, et al. The prevalence and types of glaucoma in Malay people: the Singapore Malay Eye
Study. Invest Ophthalmol Vis Sci. 2008;49(9):3846–51.
5. Cheng JW, Cheng SW, Ma XY, et al. The prevalence of primary glaucoma in mainland China: a systematic review and meta-analysis. J Glaucoma. 2013;22(4):301–6.
6. Dirani M, Crowston JG, Taylor PS, et al. Economic impact of primary open-angle glaucoma in Australia. Clin Exp Ophthalmol. 2011;39(7):623–32.
7. Michelson G, Wärntges S, Hornegger J, et al. The papilla as screening parameter for early diagnosis of glaucoma. Dtsch Arztebl Int. 2008;105(34–35):583–9.
8. Hatanaka Y, Noudo A, Muramatsu C, et al. Automatic measurement of vertical cup-to-disc ratio on retinal fundus images. In: International conference on medical biometrics. Berlin: Springer; 2010. p. 64–72.
9. Xu Y, Hu M, Jia X, et al. Computer-aided diagnosis of glaucoma using fundus images. In: Proceedings of the 2014 international conference on mechatronics, electronic, industrial and control engineering; 2014.
10. Fujita H, Uchiyama Y, Nakagawa T, et al. CAD on brain, fundus, and breast images. In: International conference on medical imaging and informatics. Berlin: Springer; 2008. p. 358–66.
11. Yin F, Liu J, Wong DWK, et al. Automated segmentation of optic disc and optic cup in fundus images for glaucoma diagnosis. In: IEEE CBMS 2012: 25th international symposium on computer-based medical systems (CBMS). New York: IEEE; 2012. p. 1–6.
12. Zhang Z, Srivastava R, Liu H, et al. A survey on computer aided diagnosis for ocular diseases. BMC Med Inform Decis Mak. 2014;14(1):1.
13. Bock R, Meier J, Nyúl LG, et al. Glaucoma risk index: automated glaucoma detection from color fundus images. Med Image Anal. 2010;14(3):471–81.
14. Tangelder GJM, Reus NJ, Lemij HG. Estimating the clinical usefulness of optic disc biometry for detecting glaucoma-tous change over time. Eye. 2006;20(7):755–63.
15. Nayak J, Acharya R, Bhat PS, et al. Automated diagnosis of glaucoma using digital fundus images. J Med Syst. 2009;33(5):337–46.
16. Babu TRG, Shenbagadevi S. Automatic detection of glaucoma using fundus image. Eur J Sci Res. 2011;59(1):22–32. 17. Joshi GD, Sivaswamy J, Karan K, et al. Optic disk and cup boundary detection using regional information. In: 2010
IEEE international symposium on biomedical imaging: from nano to macro. New York: IEEE; 2010. p. 948–51. 18. Xiao D, Lock J, Manresa JM, et al. Region-based multi-step optic disk and cup segmentation from color fundus
image. In: SPIE medical imaging. International Society for Optics and Photonics; 2013. p. 86702H–8.
19. Madhusudhan M, Malay N, Nirmala SR, et al. Image processing techniques for glaucoma detection. In: International conference on advances in computing and communications. Berlin: Springer; 2011. p. 365–73.
20. Joshi GD, Sivaswamy J, Krishnadas SR. Optic disk and cup segmentation from monocular color retinal images for glaucoma assessment. IEEE Trans Med Imaging. 2011;30(6):1192–205.
• fast, convenient online submission •
thorough peer review by experienced researchers in your field • rapid publication on acceptance
• support for research data, including large and complex data types •
gold Open Access which fosters wider collaboration and increased citations maximum visibility for your research: over 100M website views per year •
At BMC, research is always in progress.
Learn more biomedcentral.com/submissions
Ready to submit your research? Choose BMC and benefit from:
22. Liu J, Wong DWK, Lim JH, et al. ARGALI: an automatic cup-to-disc ratio measurement system for glaucoma analysis using level-set image processing. In: 13th International conference on biomedical engineering. Berlin: Springer; 2009. p. 559–62.
23. Zhang Z, Liu J, Cherian NS, et al. Convex hull based neuro-retinal optic cup ellipse optimization in glaucoma diag-nosis. In: 2009 annual international conference of the IEEE engineering in medicine and biology society. New York: IEEE; 2009. p. 1441–4.
24. Wong DWK, Liu J, Lim JH, et al. Automated detection of kinks from blood vessels for optic cup segmentation in reti-nal images. In: SPIE medical imaging. Bellingham: Internatioreti-nal Society for Optics and Photonics; 2009. p. 72601J–8. 25. Cheng J, Liu J, Xu Y, et al. Superpixel classification based optic disc and optic cup segmentation for glaucoma
screening. IEEE Trans Med Imaging. 2013;32(6):1019–32.
26. Cheng J, Liu J, Tao D, et al. Superpixel classification based optic cup segmentation. In: International conference on medical image computing and computer-assisted intervention. Berlin: Springer; 2013. p. 421–8.
27. Xu Y, Liu J, Cheng J, et al. Efficient optic cup localization based on superpixel classification for glaucoma diagnosis in digital fundus images. In: 2012 21st international conference on pattern recognition (ICPR). IEEE; 2012. p. 49–52. 28. Fumero F, Alayón S, Sanchez JL, et al. RIM-ONE: an open retinal image database for optic nerve evaluation. In: 2011
24th international symposium on computer-based medical systems (CBMS). IEEE; 2011. p. 1–6.
29. Dougherty ER, Lotufo RA, The International Society for Optical Engineering SPIE. Hands-on morphological image processing. Washington: SPIE Optical Engineering Press; 2003.
30. Bertalmio M, Sapiro G, Caselles V, et al. Image inpainting. In: Proceedings of the 27th annual conference on com-puter graphics and interactive techniques. New York: ACM Press/Addison-Wesley Publishing Co.; 2000. p. 417–24. 31. Perona P, Malik J. Scale-space and edge detection using anisotropic diffusion. IEEE Trans Pattern Anal Mach Intell.
1990;12(7):629–39.
32. Catté F, Lions PL, Morel JM, et al. Image selective smoothing and edge detection by nonlinear diffusion. SIAM J Numer Anal. 1992;29(1):182–93.
33. Wang XF, Huang DS, Xu H. An efficient local Chan–Vese model for image segmentation. Pattern Recogn. 2010;43(3):603–18.
34. Gloster J, Parry DG. Use of photographs for measuring cupping in the optic disc. Br J Ophthalmol. 1974;58(10):850. 35. Haleem MS, Han L, van Hemert J, et al. A novel adaptive deformable model for automated optic disc and cup
segmentation to aid glaucoma diagnosis. J Med Syst. 2018;42(1):20.
36. Al-Bander B, Williams BM, Al-Nuaimy W, et al. Dense fully convolutional segmentation of the optic disc and cup in colour fundus for glaucoma diagnosis. Symmetry. 2018;10(4):87.