Introduction:
Deafblind people have three different functional areas that are severely impaired: mobility (ability to move around in an environment and physically orient oneself), communication (exchange of in-formation) and monitoring of surrounding activi-ties. In the present context, monitoring refers to the detection, identification and directional per-ception of an event (1).
Monitoring the environment is a problem that deafblind people consider important. Some have
residual hearing and may benefit from hearing aids, for instance aids with transposing algo-rithms. Others may have cochlear implants, CI, (2-4). For those who have severely impaired hearing and vision, other senses are especial-ly important. Vibrations produced by events, odours, and draughts are used to detect and iden-tify environmental events (5). Even deaf people with adequate visual functioning have problems with monitoring and can benefit from technical aids (6).
Case Report / series
Iranian Rehabilitation Journal , Vol. 6, No.7 & 8,2008
Vibrotactile detection,identification and directional perception of
signal-processed sounds from environmental events: A pilot field
evaluation in five cases
Parivash Ranjbar, PhD student; Agneta Anderzén Carlsson, PhD; Örebro University, Sweden
Lennart Neovius, Techn. Lic. Saven Hitech AB, Sweden
Camilla Johansson, MS; Erik Borg, PhD Örebro University Hospital, Sweden
Objective: Conducting field tests of a vibrotactile aid for deaf/deafblind persons for detection, identifica-tion and direcidentifica-tional percepidentifica-tion of environmental sounds.
Subjects & method: Five deaf (3F/2M, 22–36 years) individuals tested the aid separately in a home en-vironment (kitchen) and in a traffic enen-vironment. Their eyes were blindfolded and they wore a headband and holding a vibrator for sound identification. In the headband, three microphones were mounted and two vibrators for signalling direction of the sound source. The sounds originated from events typical for the home environment and traffic. The subjects were inexperienced (events unknown) and experienced (events known). They identified the events in a home and traffic environment, but perceived sound source direction only in traffic.
Results: The detection scores were higher than 98% both in the home and in the traffic environment. In the home environment, identification scores varied between 25%-58% when the subjects were inexperienced and between 33%-83% when they were experienced.
In traffic, identification scores varied between 20%-40% when the subjects were inexperienced and be-tween 22%-56% when they were experienced. The directional perception scores varied bebe-tween 30%-60% when inexperienced and between 61%-83% when experienced.
Conclusion: The vibratory aid consistently improved all participants’ detection, identification and direc-tional perception ability.
A portable vibratory aid for monitoring events in the environment could help the deafblind to better comprehend the world around them, thus increas-ing their feelincreas-ing of security and improvincreas-ing their control over their surroundings. The restricted frequency range and poor selectivity of the skin, however, limit tactile detection and particularly identification of events, especially those emit-ting high frequency sounds. Thus, sounds must be processed and adapted to the properties of the vibratory sense (7,8).
Sentiphone, MiniVib II and Tactaid VII are three examples of tactile aids designed for speech per-ception for profoundly hearing impaired persons who receive insignificant or no benefit from conventional hearing aids for perceiving speech (7,9,10). The aids are also used to improve the hearing impaired person’s speech reading, and as a side effect they also improve perception of environmental sounds (11). In a study by Traunmüller, when subjects used Sentiphone as a speech reading aid, their average fault rate de-creased from 24%, when they used only visual information, speech reading, to 3.3%, when they combined the visual information and the tactile information from the Sentiphone (10,12). Re-garding perception of environmental sounds, the deaf subjects’ subjective rating of their handicap, on a scale from 0% (no handicap) to 100% (total handicap), was 36.6% when they were aided by MiniVib II compared to 60.5% when they were unaided (7).
Reed and Delhorne (11) evaluated the ability of experienced deaf users of the vibrotactile aid, Tactaid VII, to identify environmental sounds. The test-sounds were four different closed sets of 10 sounds each, representing different envi-ronmental situations (Home, Kitchen, Office and Outdoors). The results showed that after training the subjects could identify almost 60% correct-ly on each of the four sets in a laboratory study. In addition, electrotactile stimulation has been tested for transmission of articulatory informa-tion (13), but so far not used for environmental information.
Tactile aids are an alternative to CI in
postlin-gually deaf persons who can obtain improved environmental perception, but not successful oral speech communication through cochlear implan-tation. Such individuals can also avoid the surgery required for cochlear implantation and thereby its negative side effects, such as infections (14-18). The general purpose of the present study is to develop a vibrotactile aid for monitoring of the environment, i.e. a device designed for environ-mental sounds, but not for speech. A laboratory prototype of a three-microphone system for real-time directional analysis of sound sources has been developed within the research team. This first prototype (1,19,20) was mounted on eye-glasses. Sound source direction was determined by a cross-correlation algorithm (calculation method), and eight directions were coded to two vibrators placed behind the ears, signalling eight directions.
Identification of the events has been studied in normal hearing (21) and deaf subjects (22,23). These subjects have been tested with environmen-tal sounds processed with selected algorithms in order to determine which algorithm(s) gives the best condition for vibrotactile event identifica-tion.
ex-periment, the 45 environmental sounds (the same sounds as used in the previous study (22)) were preprocessed, recorded and presented off-line. In the second and third experiment, the sounds were reproduced in an acoustic test room, with or without background noise, and processed in real time. The subjects iden ti fied the sti mu li by choo-sing one of the 45 event alter na tives. The results showed that four algorithms, one transposing and three modulating algorithms, produced equally good scores, and they were chosen as candidates for implementation in a portable vibratory aid to be evaluated under realistic conditions indoors and outdoors. The new contribution in the present study is the use of real environments. One pos-sible draw back of testing in such environments is that confounding factors, such as unplanned events, may interfere.
The specific purpose of this present study was to evaluate a vibrotactile monitoring aid for the deaf and deafblind for detection, identification and di-rectional perception of environmental sounds in a home and in a traffic environment.
Method:
The vibrotactile monitoring aid was tested with equipment identical to that used in the acoustical laboratory (23) in the home and in a traffic en-vironment for detection, identification and direc-tional perception of environmental sounds under two conditions:
The subjects were inexperienced (the events were unknown to them)
The subjects were experienced (they had previ-ously experienced the events), and the aid was in either the on or off position.
Subjects:
Five volunteers (3F/2M) tested the aid (see Table I). They were profoundly hearing impaired or to-tally deaf, between 22–36 years of age and had participated in the previous studies(22,23). Three of the subjects were using hearing aids and one had a CI. The subjects were not aided during the tests. They had good visual acuity, but were blindfolded during the tests.
Test sounds:
In the present study, important events that each produced a sound were selected and presented a different number of times.
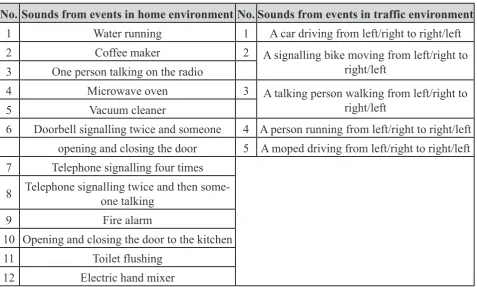
Twelve sounds from events often occurring in the home environment and five sounds often oc-curring in a traffic environment were used as test stimuli (see Table II). In traffic, the sounds from the events came from different directions.
The sounds were chosen on the basis of studies by Borg et al. (5) and Ranjbar et al. (21). Most of the sounds had been rated by deafblind subjects as representing important environmental events and also by the authors as a relevant sample of eco lo-gi cal ly valid environmental events (sounds).
Equipment:
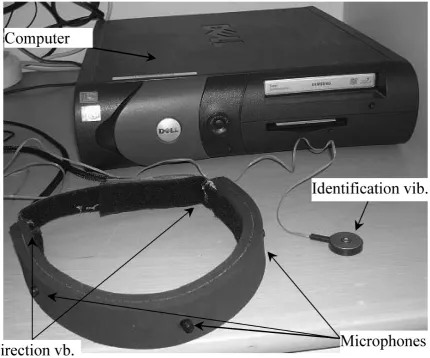
Prior to the current field study, the equipment (see Figure 1) was developed and tested in a se-ries of laboratory studies with a heavy stationary vibrator (22) and a portable vibrator (23). The sounds were picked up by microphones (AKG C 417). The signals were processed in the signal-processing program, Aladdin Interactive DSP 3.0 (in a stationary computer), using a sampling frequency of 8,000 Hz, or when possible 12,000 Hz. The processed signal was sent to the narrow-band vibrator (C2 Tactor) to be identified using the vibratory sense (the spectrum of the vibrator was equalized using an anti-filter according to the data in the manufacture’s specification). The vibrations were presented on the thenar eminence and the fingers (using their fingers, the subjects held the vibrator on the thenar eminence) of the dominant hand for identification.
The direction of the event was coded by two vi-brators (Coin/Pancake Vibration Motors KE2 684) positioned behind the ears. The three mi-crophones and the two vibrators for directional perception were mounted in a headband.
the events were presented according to the fol-lowing scheme:
If both vibrators gave short or long pulses, the sound was from the front or back, respectively. If the right vibrator emitted two pulses in a se-quence like, short short, short long or long long, the sound was from the front right, right or back right side, respectively.
If the left vibrator emitted two pulses in a se-quence like, short short, short long or long long, the sound was from the front left, left or back left side, respectively.
Signal-processing algorithms:
Signal processing in the monitoring aid was ac-complished using four different algorithms, which had previously been chosen as good can-didates for use in a field study. The algorithms are listed in Table III.
In Algorithm TRHA, the eight frequency com-ponents with the highest amplitude in the range 100–4000 Hz were transposed to the frequency range 187–437 Hz using approx. 31 Hz between components, Df»31Hz.
In Algorithm AM, a 250 Hz sine signal was am-plitude modulated by the envelope of the in put signal.
In Algorithm AMMC, the input signal was band-pass filtered (Butterworth three-pole) in six dif-ferent frequency ranges (120–240, 240–480, 480– 960, 960–1920, 1920–3840 and 3840–6000 Hz, res pec tively). Thereafter, the envelope (extracted by first rectifying and then low-pass filtering at 10 Hz) of the output signal from each filter was used to am pli tude modulate sine signals with the frequencies, 55, 105, 215, 335, 445 and 650 Hz, res pec tive ly.
The difference between frequency components was chosen to be larger than 30% (Df/f> 30%), as the frequency discrimination Df/f of the skin is about 30% (9,24,25).
In Algorithm AMMC(A), the signal was pro-cessed using Algorithm AMMC and also adapted to the vibratory threshold of the skin using the transfer function representing the average vibra-tory thre shold of the skin (the frequencies
be-tween 200 and 450 were attenuated while remain-ing frequencies under 1000 Hz were amplified), in line with Verrillo (26) and Ranjbar (22). The level of the signal to the identification vibra-tor was individually adjusted for each subject in the beginning of the tests. The subjects experi-enced that the level was comfortable and suffi-cient.
Each subject was tested with a randomly cho-sen algorithm (one of the four algorithms with highest identification scores in a previous labo-ratory study (23)), i.e. Subject 4 (S4) with Algo-rithm TRHA, S1 and S5 with AlgoAlgo-rithm AM, S2 with Algorithm AMMC, and S3 with Algorithm AMMC(A).
Procedure:
The design was basically a case study with non-parametric statistical evaluations. It is character-ized by a partly double blind design, as the test subjects were unaware of the test conditions and two of the three experimenters (AA and PR) did not know the status of the vibratory aid (on or off). The subjects were provided with written and verbal information about the test procedure. The experimenters PR and CJ gave the verbal infor-mation in sign language when it was needed (one subject was a good lip reader and used a hear-ing aid and one subject could hear while ushear-ing a CI when receiving the information). The menters PR and CJ have several years of experi-ence in sign language.
and off position.
The subjects were filmed during the test-sessions as extra documentation to allow close analysis of their responses, in cases of indistinct respond-ing.
In the conversation with the subjects (after they had conducted the tests), they were asked about their attitudes towards the aid.
Tests in a home environment:
Each subject was seated in a relaxed fashion in an unfamiliar kitchen (4mx5m) with her/his eyes blindfolded, wearing the headband and holding the vibrator in her/his dominant hand. All events (see Table II) were conducted inside the kitchen except Toilet flushing and Doorbell signalling twice and someone opening and closing the door, which occurred inside the bathroom with an open door and in the hall, respectively, both almost seven meters from the test room, the kitchen. Three experimenters (AA, PR and CJ) were in-volved in the test. Experimenter AA initiated most of the events, Experimenter PR observed the test situation and made some of the sounds. Experimenter CJ controlled the signal-processing program (choosing the relevant algorithm and switching the aid on and off) and signalled to AA or PR to begin each event. PR and CJ, who could interpret sign language, also noted the subjects’ responses.
In the inexperienced (training) part, the subjects were informed that they were to sit quietly when AA tapped twice on their leg and to begin signing their detection (by raising their hand) and iden-tification of the event after AA had tapped once. After the subject’s response was noted, (s)he was told whether the response was correct or incorrect and what the correct response was (subjects re-ceived feedback). The subjects were encouraged to memorize the events, which would be repeated in the experienced (main) part of the test.
In the experienced part, the 12 events from the inexperienced part were presented twice in ran-dom order for each subject, once with the vibra-tor in the on position and once with the vibravibra-tor in the off position. Each experimenter had access
to the same sound list, but the status (position) of the vibrator (on or off) was only known to CJ. The experimenter and the subject communicated in the same way as in the inexperienced part, but without any feedback. In the experienced test, the experimenters continued to the next event if the subject did not detect an event.
Every test took up to 1 hour and could be inter-rupted if the subject wished to take a break.
Tests in traffic environment:
Before starting the test, the subjects practiced and learned the eight directional codes. The direc-tions of the events were presented according to a simple scheme with short and long pulses (see section equipment). The sound sources moved from left/right to right/left at different distances from the subject. The events A car driving… and A moped driving… started at 50 m, the event A signalling bike… started at 25 m, and the events A person running… and A talking person walk-ing… started at 15 m distance from the subject. When the event moved from, e.g., left to right, the direction vibrators coded the following se-quence: left, left-forward, forward, right-forward and right (see section Assessment and Figure 2). The car used for event A car driving… was a small, quiet car and was driven smoothly.
When testing the aid, the subjects were sitting on a chair, with their eyes blindfolded, near a rela-tively calm street, which was almost 200 meters away from a freeway. The traffic noise from the freeway varied from 50 to 80 dBA. If there was an unusual or very loud sound in addition to the test sounds, such as from a power lawn mower or a passing train, a break was introduced.
Experimenter AA and four other persons produced the events causing the test sounds. Experimenter PR observed and noted the subject’s responses; experimenter CJ also noted the responses and co-ordinated the tests.
left) and were asked to detect and identify the event as well as to indicate the direction of the event. They received feedback on their response and the correct answer was given.
In the experienced part, four events (A signal-ling bike, A talking person walking, A person running and A moped driving) were presented at least four times for each subject, two presenta-tions (one from right and one from left) when the vibrator was in the on position and two presenta-tions when the vibrator was off (four events, two positions of the vibrator, two directions = 16 sentations). The event A car driving… was pre-sented 20 times for each subject, 10 times (five from right and five from left) when the vibrator was in the on position and 10 times when the vi-brator was off (one event presented five times, two positions of the vibrator switch, two direc-tions = 20 presentadirec-tions). The total number of presentations in traffic was 36 for each subject, 18 with the vibrator off and 18 with the vibrator on. The events were presented in random order for each subject.
Like in tests in the home environment, each ex-perimenter had access to the same sound list (dif-ferent for each subject), but the status of the aid (on or off) for every event was predetermined (known only to CJ). The subjects were informed that they had to raise their hand to show that they had detected an event. The subjects were encour-aged to use all of their senses (except vision and hearing). After the subject had lowered his/her hand, PR tapped once on him/her, showing it was time for the subject to sign or indicate the iden-tity and direction of the event. When the subject had identified the event and indicated its direc-tion, the experimenter tapped twice on her/him to indicate that (s)he should be prepared to focus on the next event.
When Subject 1 (S1) was being tested it was windy, and therefore a knitted scarf was used to cover the microphones.
When S3 was being tested with the aid in the experienced part in traffic, there were technical problems with the vibrators presenting the direc-tional information, and these observations were
excluded. Every test took up to two hours and could be interrupted if the subject wished to take a break.
Assessment:
Both experimenters PR and CJ noted the sub-jects’ answers regarding identification and direc-tion. Two of the three experimenters who evalu-ated the results were unaware of the status of the vibratory aid (PR and AA). When there were dif-ferences in interpretation, the answers were ob-tained from the videotape.
After completion of all the tests, the three ex-perimenters first judged the responses/statements from the tests individually and then jointly as-signed points to the responses. A correct response (detection, identification or direction perception) resulted in one point and an incorrect response re sul ted in zero points.
A correct detection means that the subjects signed their detection of the events by raising their hand.
A correct identification means that the subjects identified the event exactly (not partly) correct. A correct perception of the direction means that the subjects could perceive the main direction the event was coming from. For example, each of the responses A car coming from right-back, A car coming from right, or A car coming from right-forward were correct and assigned one di-rectional perception point if the car came from the right.
sounds other than those on the list.
For the test in traffic, detection, identification and directional perception scores were computed sep-arately (see Table IV). The test resulted in nine scores: three detection scores (inexperienced de-tection score aid on, experienced dede-tection score aid on, experienced detection score aid off), three identification and three directional perception scores (inexperienced, experienced aid on, expe-rienced aid off). The maximum number of points for each variable (detection, identification and di-rection) in the parts inexperienced, experienced aid on and experienced aid off was 10, 18 and 18, respectively (i.e. the maximum number of points for the variable, e.g., detection in the parts inex-perienced, experienced aid on and experienced aid off was 10, 18 and 18, respectively).
In the experienced part, the guessing probability for correct identification of an event was 20% (one of the five test sounds). The guessing probability for correct perception of direction was 37.5%, which was determined by summing up the prob-abilities for correct perception of events coming from right-back/left-back (one of eight directions, 12.5%), left/right (one of eight, 12.5%) and left-forward/right-forward (one of eight, 12.5%). For the inexperienced part, no guessing prob-ability is determined because the subjects did not have access to the sound list (unlimited number of possible responses).
Determination of guessing probability when the aid was off was irrelevant, as the subjects were asked for identification/directional perception only if they had raised their hand to sign detec-tion of the events. Otherwise the test was contin-ued with the following event in the sound list. A descriptive non-parametric statistical analysis was presented.
Results:
Home environment
Vibratory detection and identification scores were calculated for the 12 signal-processed environmental sounds for each subject.
Detection score:
The detection score was 100% for all five sub-jects in the inexperienced part.
In the experienced part when the aid was on, the detection score for S1, S2, S3 and S4 was 100% and for S5, who did not detect the event Toilet flushing, the score was 92% (11 of the 12 events). The total detection score was 98.3% (59/60, five subjects and 12 events) when experienced and aid on. When the aid was off, the detection scores were 25% (three of the 12 events), 8%, 0%, 0% and 8%, respectively. S1, S2, and S5 could de-tect the event Opening and closing the door to the kitchen. S1 could also detect the events Coffee maker and Vacuum cleaner.
Identification score:
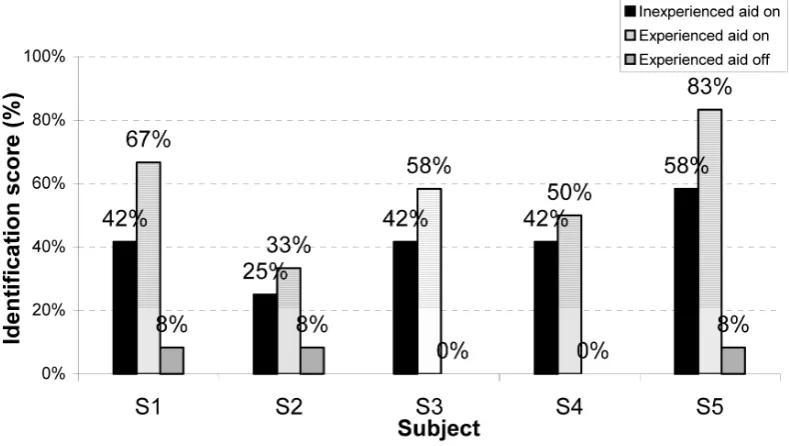
The subjects’ identification scores in the inex-perienced and exinex-perienced parts of the tests are shown in Figure 3. As seen in the figure, in the inexperienced part (aid on), the identification scores for S1, S2, S3, S4, and S5 were 42% (five of the 12 events), 25%, 42%, 42% and 58%, re-spectively (median 42%). The corresponding fig-ures in the experienced part, when the aid was on, were 67% (eight of the 12 events), 33%, 58%, 50% and 83%, respectively (median 58%). Thus, all subjects improved with experience (improved by 8-25 percentage units). When the aid was off, the identification scores were 8%, 8%, 0%, 0% and 8%, respectively, and S1, S2, and S5 could identify the event Opening and closing the door to the kitchen.
All subjects performed better when the aid was on than when it was off.
In the experienced part of the test when the aid was on, the subjects’ identification results were consistently better than the guessing probability (8.3%).
40%, median=30%).
Confusions of the events in home environment are shown in confusion matrix, Table V.
The events Microwave oven and Fire alarm were confused with each other, and the event Tele-phone signalling twice and then someone talking was confused with the event One person talking on the radio.
Traffic environment:
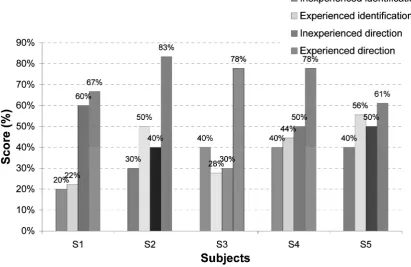
The vibratory detection, identification and direc-tional perception scores for five signal-processed environmental sounds were determined by sum-ming up the points of each participant for each part of the test (inexperienced, experienced aid off and experienced aid on) and creating a de-tection, identification and directional perception score, respectively. The subjects’ identification and directional perception scores in the inexpe-rienced and expeinexpe-rienced part in traffic are shown in Figure 4.
Detection score:
Both in the inexperienced and experienced part (when the aid was on), the detection score for all subjects, except for S3 in the experienced part, was 100%. The detection score for S3, who did not detect the last presented event, was 94.4% (17 of 18) when experienced. The detection score in total was 98.8% (89/90, five subjects and 18 presentations) when experienced and aid on. In the experienced part of the test, when the aid was in the off position, the detection score for S1, S2 and S4 was 0%, while the detection score for S3 and S5 was 5.6% (the subjects could detect one of the 18 presentations: A person running).
Identification score:
As seen in Figure 4, the inexperienced identifica-tion scores for S1, S2, S3, S4 and S5 were 20% (two of the 10 presentation), 30%, 40%, 40% and 40%, respectively. The corresponding figures in the experienced part when the aid was on were 22% (four of the 18 presentations), 50%, 28%, 44% and 56%, respectively. All subjects had bet-ter scores than the guessing probability, 20%,
when they were experienced.
In the experienced part of the test, when the aid was in the off position, the identification score for S1, S2 and S4 was 0% (the subjects did not detect any presented event), and for S3 and S5 it was 5.6% (the subjects could identify one of the 18 presentations: A person running).
The identification scores for all experienced sub-jects (except S3) were better (when the aid was on) than when they were inexperienced (improved by 2-20 percentage units). The scores were also bet-ter when subjects were experienced and the aid was on than when it was off.
Subject 5, S5, could identify in detail the events and their direction. For example, the subject said, “first cars reversed, then someone talked and then a moped drove by from right to left”.
The events A talking person walking…, A person running…, and A moped driving… had the highest identification scores (scores 50%, median=50%), while the events A car driving…, and A signal-ling bike moving…had the lowest identification scores (scores40%, median=32%).
Confusions of the events in traffic environment are shown in confusion matrix, Table V.
The event A car driving (50 presentations, 5 sub-jects and 10 presentations for each subject) was confused with the events A signalling bike mov-ing…, A moped driving… and the event A talking person…. Interestingly, all the presented events were identified a few times as the same event A talking person… (see Table V)
Directional perception score:
de-tect any event), while direction score for S3 and S5 was 5.6% (for one of the 18 presentations, A person running, the subjects could recognize the direction of the event).
The directional perception scores for S1, S2, S4 and S5 were better when the subjects were expe-rienced than when they were inexpeexpe-rienced. The directional scores were improved by 7-43 per-centage units and were better than the guessing probability, 37.5%.
Attitudes towards the vibratory aid
In conversations with the participants, they ex-pressed attitudes towards the aid. All of the sub-jects had very positive attitudes towards the aid and believed it could help deafblind as well as deaf persons. S1, who is a good lip reader, was very optimistic, and one impression was that he sometimes could identify speech with the vibra-tor in the on position and without lip reading. S4 appreciated the aid a great deal and wanted to use it to identify, e.g., the telephone signal, the door-bell, the alarm clock or to feel music. S1 and S4 only liked the identification part of the aid, be-cause they did not like wearing the headband.
Discussion:
The purpose of the present study was to provide a preliminary evaluation of a tactile aid for the deaf and deafblind for detection, identification and di-rectional perception of environmental sounds in realistic environments. Below, first some aspects of the methods and then the results will be dis-cussed. The results of individual cases are finally treated separately.
Methodological aspects: Subjects
The subjects were familiar with the vibratory aids, as they had participated in similar tests in previous laboratory studies (22,23). They were few in number, but sufficient for a case study (27).
In some respects, it would have been better to use deafblind instead of deaf and blindfolded subjects,
because the vibratory aid is primarily intended as a monitoring aid for the deafblind. However, we had difficulties communicating with deafblind persons (none of us knew sign language for the deafblind). Using interpreters may have made the test time longer, and the procedures may have been exhausting for deafblind subjects. This may have resulted in confounding factors, which, in turn, may have negatively affected the results. On the other hand, deafblind subjects are more used to interpreting vibrations (28,29), and there-fore they may have obtained better identification scores. The choice of deaf subjects made the test-ing technically easier, and decreased the risk of confounding factors. On the other hand it can be assumed that is was harder for the deaf subjects to interpret the vibratory information than it would have been for deafblind persons, who have more experience of using vibrations. In further tests, the fully portable vibrotactile aid will be evalu-ated by deafblind subjects and use of the aid will include long-term training.
Events:
The present authors and deafblind subjects in the study by Borg et al. (5) selected the test sounds (see Table II) and regarded them as ecologically relevant, and as sounds that signal important en-vironmental information. The sound Doorbell signalling twice … occurred outside the hall and the sound Toilet flushing inside the bathroom with an open door. These events occurred in al-most 7 meters from the test room, the kitchen. The sounds had a low intensity level, which caused some difficulties in sensing and identify-ing them. This was a drawback, but the situation was realistic and therefore included.
Signal processing algorithms:
vibrot-actile aid and deafblind participants. Such tests should include long-term training. After traing, algorithms that preserve more spectral in-formation (e.g., Algorithms TRHA, AMMC and AMMC(A)) can be expected to produce better scores compared to algorithms with poor spectral information (e.g., Algorithm AM), despite the poor frequency discrimination and resolution of the skin (9,30).
Equipment, design and procedure:
We have found no better small vibrator on the market than the C2 Tactor used in the present study with respect to bandwidth (large bandwidth with minimal peaks) and weight. The wideband vibrator of the type used in our laboratory study (22) weighed 1.1 kg and is obviously too heavy for a portable aid. A small vibrator with an even larger bandwidth than the C2 Tactor would im-prove the aid and probably imim-prove the effects of training.
The frequency response of the vibrator was equal-ized using an anti-filter according to the data in the manufacture’s specification. The equalization, however, did not sufficiently compensate for the high frequency attenuation of the vibrator.
The sounds from the events were signal pro-cessed using a stationary computer, which need-ed a power supply and thereby limitneed-ed the choice of test locations. The test environment, both in a home and in a traffic environment, was unfamil-iar to the subjects. Use of the same unfamilunfamil-iar test environments and the same test sounds increased the probability that the participants would have the same baseline knowledge. The scores might have been higher if the tests had been conducted inside or outside the subjects’ own homes. We re-garded it as impractical and ethically dubious to have at least three strangers in one participant’s home, to blindfold her/him and produce events that were outside her/his control.
The study was designed as a partly double blind study. In the experienced parts, only one of the experimenters (CJ) knew the status of the vibra-tor, on or off. By using a fully double blind de-sign (none of the experimenters know the status
of the vibrator), the otherwise undesired subjec-tive components could be further decreased. Before the test in traffic, the subjects practised the directional code as long as they needed (it took a maximum of 20 minutes to learn). The ex-perimenter evaluated the subjects several times to ensure that they had learned the codes.
The weather conditions were not the same for all subjects. The temperature, wind, etc., which can affect the sensitivity of the skin (9), were not controlled for. Still the situation was realistic, be-cause the user of the aid (e.g., a deafblind per-son) cannot control the weather conditions. The weather, however, did not differ greatly across subjects. However, after the test session, S1 re-vealed that it had been difficult to differentiate the wind touching his left cheek from the feeling of the vibrator indicating direction. The test hours were almost identical for all subjects.
The two experimenters PR and CJ, who inter-preted throughout the tests, were not profession-al interpreters, but had good knowledge of sign language. In addition, they worked together and could correct each other, thereby increasing re-liability (31). The tests were filmed, and in one case where the experimenters PR and CJ noted different reactions s, the film was used to identify the correct response.
or from the right. They were very detailed and described every presented direction code they sensed, which indicates that they did not guess.
Assessment:
In the tests in traffic, if the correct direction was recognized, the response resulted in one point, otherwise it resulted in zero points, although a background sound from another direction could have caused the subjects to recognize a correct direction for the interfering event (which result-ed in zero points) rather than the direction pro-duced by the test event. Giving both alternatives to directional perception (perception of direction throughout the event and perception of where the sound started from) a full point is based on the fact that deafblind persons consider information (warning) about when a person or a vehicle is ap-proaching to be highly important, as such infor-mation allows them to move away or stay in a safe position (5).
The guessing probabilities for correct identifi-cation of an event in a home and a traffic envi-ronment were estimated to 8.3% and 20%, re-spectively. These values would be correct if the subjects had access to the sound list. Because no lists were used, the guessing values were (con-siderably) lower, as the subjects may not have re-membered all sounds presented in inexperienced part.
The identification results of all five subjects with the aid on both when inexperienced and when experienced were better than the corresponding guessing probabilities. The detection and identi-fication results of all five subjects were also bet-ter when they were experienced than when they were inexperienced.
All the subjects had better identification scores in the home than in the traffic environment. The lower identification scores in traffic could depend on several factors. One factor is that the subjects had to focus simultaneously on identifying the event and perceiving the direction of the same event in traffic. This requires greater concentra-tion and training. The second factor was the back-ground noise from the freeway; both the general
acoustic interference and other interfering events could have misled the subjects. The subjects could often correctly identify intervening events not belonging to the test protocol. For example, the subjects often identified the sound from the presented event A signalling bike… or A talking person… as the sound from an unexpected car or motorbike from the freeway. The sound from A signalling bike… was lower in amplitude than the sound from the unexpected cars on the free-way, and the lower sound may have been masked. Sometimes the subjects identified an unexpected interfering event prior to the scheduled event, for example cars on the freeway or bird song, and therefore identified a sound direction different from that related to the event setup by the experi-menters, and this resulted in zero points.
A third factor was the wind, which increased the noise level and masked the sound of the events. This factor obviously affected S1 more than the others.
Another factor that may also have affected the directional perception results negatively is due to the technical limitations of the directional per-ception algorithm. It works best when the SNR is higher than 8 dB (19). The sound from the back-ground traffic and wind probably decreased the SNR ratio below 8 dB.
Aspects of the results of the individual partici-pants
Subject 1, S1, had the second best identification results in the home environment, but lowest in the traffic environment. This subject had also ob-tained high identification scores in previous stud-ies (22,23). The subject was born deaf and was used to hearing aids, probably to the vibrations produced by the low frequency components of the environmental sounds, and was therefore ex-pected to have good results, as in previous labo-ratory study (23). S1’s low identification scores in traffic are probably partly due to the windy weather conditions, which were not totally com-pensated for by the knitted scarf used to cover the microphones.
lowest scores also in previous studies, which suggests that she might not have been used to in-terpreting vibrations. The subject had also better effects of training in traffic than in the home en-vironment. The subject was not used to hearing aids or CI.
Subject 3, S3, had the lowest scores in previous studies, but not in the present study. In the ex-perienced part of the test in traffic, there were technical problems with the vibrators represent-ing direction, therefore the directional perception score of S3 was not calculated. The test could have been repeated, but then the subject would have been more experienced and had a different knowledge foundation (baseline) than the other subjects. The subject did not detect the last-pre-sented event when the aid was on. The test time was longer because the test had been interrupted twice and the subject may therefore have been frustrated and tired. Such factors may explain the lower identification scores for S3 when experi-enced than when inexperiexperi-enced.
The scores of Subject 4, S4, were good in the present study, just as in previous studies. No spe-cific reason was found for his good results, but the subject was born deaf and therefore used to vibrations (used to vibrations from hearing aids). Subject 5, S5, had the best identification scores in the home environment. The subject had high scores in previous studies as well. In the inexpe-rienced part of the test in traffic, the subject iden-tified the events and their direction in detail by responding for example “first cars reversed, then someone talked and then a moped…” (see results section). The subject was correct, because when the vibrator was switched on before the moped started, there were sounds from the freeway, and then a group of birds flew by, which she identified as speech. The subject was skilful (perhaps too ambitious) and explained in detail even though she had been told to focus on the same events as presented in the inexperienced part. Because the subject indicated several directions, it was diffi-cult for the experimenters to decide which direc-tion referred to the direcdirec-tion of the event, and this resulted in zero points.
The subjects differed individually in their results, which can partly be explained by individual prop-erties (motivation, age of onset of deafness, hear-ing aid use or how used the subject is to vibra-tions), weather conditions (S1, poor weather) and technical issues (S3). The directional perception algorithm may not generate a 100% correct direc-tion all the time due to disturbing noise (20).
Attitudes towards the vibratory aid
All of the subjects had very positive attitudes to-wards the aid, even if they had good vision and could compensate for their hearing impairments. They wanted to use the aid to detect events result-ing in only sound (and not movement or changes in light), e.g. the telephone signal, the doorbell, the alarm clock or to feel music, in addition to using the vibrations as a complement to lip read-ing.
S1 and S4 only liked the identification part of the aid. A headband or eyeglasses are needed for mounting the three microphones used to indicate sound direction. A vibrotactile aid with only one microphone placed close to the processor could be designed for subjects who prefer to abstain from the directional information and to only use the information to identify the events. Two alter-native designs are therefore likely in the future: one with and one without directional informa-tion.
us-ing environmental sounds and/or they have not been tested under conditions similar to those in the present study.
The vibratory aid Tactaid VII has been tested by Reed and Delhorne (11) using four environmental sound settings (kitchen, home, outdoors and of-fice) and two groups of subjects (normal hearing and profoundly deaf). The tests were conducted in a laboratory using a closed set of 10 sounds, where subjects had access to a sound list (which increases the guessing chance) and were trained on 600 items with feedback. The average results for the profoundly deaf subjects (who are com-parable to participants in the present study) was 58%, 59%, 64% and 52% for tests in the general home, kitchen, office and outdoors, respectively. The average results in the general home are equal to the median result in a home environment in the present study (58%), despite the fact that subjects in the present study had trained only once and had no access to the sound list. The monitoring aid in the present study can generate additional directional information that is valuable for deaf-blind people with small residual visual fields. A comparison of different tactile aids would be more informative if they were evaluated under similar conditions and if the tests included (long-term) training.
The CI (32-34) also improves the sound moni-toring and speech perception of deaf and deaf-blind subjects, but it requires functioning audi-tory nerves and surgery. Furthermore, CI are most effective in prelingually deaf subjects if the implantation occurs before the critical period (under 2 years of age) (35) and is combined with post-implantation therapy; time is also required for the brain to adapt to hearing new sounds. In a comparison of CI, tactile aids (Tactaid II) and hearing aids, subjects with early onset deafness (before 2 years of age) who received their CI be-fore 10 years of age showed the highest speech intelligibility scores. Subjects who received their device after 10 years of age had poorer speech in-telligibility scores, and there were no significant differences in the speech scores of subjects (with hearing levels between 100 and 110 dB HL and
limited hearing in the high frequencies) using CI, tactile aids and hearing aids (36). In a CI study by Reed and Delhorne (34), the identification scores for environmental sounds were related to NU-6 word perception (which in turn was related to, e.g., duration of deafness). Subjects with NU-6 word scores below 34% had greater difficulties (their identification scores for environmental sounds ranged from 45% to 75%) than did sub-jects with NU-6 word scores higher than 34% (their identification scores ranged from 80% to 94%) when testing four different closed sets of 10 sounds, each representing different environ-mental situations (general Home, Kitchen, Office and Outdoors). The above results are difficult to compare to the present results, as the tests were conducted under different conditions. Reed and Delhorne’s CI subjects had long experience with their aid and had access to a 10-item closed-set sound list during testing, in contrast to the present subjects (37).
Because cochlear implantation has some disad-vantages, e.g. there is a risk for Meningitis in pa-tients and the costs are high, implantation might not be considered when the expected result is limited to improved detection of environmental sounds (events). The monitoring aid presented here could be seen as an alternative when cochle-ar implantation is not feasible.
Features of the sounds
be explained by the fact that the car sound was of low intensity and was therefore often confused with the events A signalling bike moving…or A talking person walking…. It may also imply that the deaf subjects in the present study did not use their sense of smell or draughts when trying to identify the events, as a passing car is likely to cause more odours and draughts than a per-son passing by on foot or bicycle is. Deafblind subjects might have used their other senses to a greater extent.In general, the temporal pattern of environmental sounds is important to identi-fication of sounds/events. Sounds with a typical temporal pattern are easiest to identify and events with a similar temporal pattern are confused with each other.
Conclusion:
In both a home and a traffic environment, the subjects were able to detect more than 98% of the events when the aid was on, while subjects could detect only one or two of the events when the aid was off. The identification scores for experienced subjects in a home environment and in traffic and their directional perception scores in traffic were
consistently better than when they were inexpe-rienced or when the aid was off. The subjects differed individually in their results, but all has positive attitudes towards further application of the aid, and thus the results show the promise of extended application.
Acknowledgement
This study is part of the project ”Sensing the en-vironment, a perceptual and psychosocial analy-sis of events in the surrounding from handicap perspective”, which is being run by Ahlséns Research Institute at University Hospital Öre-bro, Örebro. The project is being financed by the Swedish Council for Working Life and So-cial Research (FAS), University Hospital Örebro and Örebro University. The project was approved by the “Regional Ethics Committee in Uppsala, Sweden, Reg. no. 2006:AÄ16”.
We are very thankful to Ingeborg Stenström and Margareta Möller for their help in design-ing the tests, Hamid Moafi, Pantea Moafi, Ce-cilia Lerneus, Jonas Karlsson for producing the events, and Professor Dag Stranneby for his con-stant support.
Subject Age Sex Hearing Loss (age) Hearing aid/CI
S1 33 M Birth Hearing aid
S2 22 F Birth No hearing aid or CI
S3 36 F 24 CI
S4 26 M Birth Hearing aid
S5 26 F Birth Hearing aid
Table II: Sounds from events used in the tests in a home and in a traffic environment No. Sounds from events in home environment No. Sounds from events in traffic environment
1 Water running 1 A car driving from left/right to right/left
2 Coffee maker 2 A signalling bike moving from left/right to
right/left 3 One person talking on the radio
4 Microwave oven 3 A talking person walking from left/right to
right/left
5 Vacuum cleaner
6 Doorbell signalling twice and someone 4 A person running from left/right to right/left opening and closing the door 5 A moped driving from left/right to right/left 7 Telephone signalling four times
8 Telephone signalling twice and then some-one talking
9 Fire alarm
10 Opening and closing the door to the kitchen
11 Toilet flushing
12 Electric hand mixer
Algorithm Description
TRHA TRansposing the eight frequency components with Highest Amplitude in the range 100–4000 Hz to the range 200–440 Hz
AM Amplitude Modulation of a 250 Hz carrier wave
AMMC Amplitude Modulation with Multiple Channel
AMMC(A) Amplitude Modulation with Multiple Channel and Adapted to the vibratory thresh-olds of the skin
Test in traffic
Inexperienced Experienced
Detection Identification Direction perception Detection Identification Direction perception
Aid on Aid on Aid on Aid on Aid off Aid on Aid off Aid on Aid off
MS=10 MS=10 MS=10 MS=18 MS=18 MS=18 MS=18 MS=18 MS=18
Table III: Brief description of the algorithms
Table IV: The flow chart of the study design in traffic. The maximum scores (MS) of the param-eters detection, identification and directional perception, when the subjects are inexperienced and
Figure 2: Eight different directions represented by combining long/short pulses from vibrators be-hind the left and right ear.
Figure 4: Identification scores for events (sounds) and their direction in traffic for 5 profoundly hear-ing impaired or deaf subjects ushear-ing the vibratory aid. The bars from left to right represent the identi-fication scores of subjects when they were inexperienced, experienced and the directional perception scores of subjects when they were inexperienced and experienced. The directional perception score for S3 was not determined (due to technical failure).
References:
1.Borg E, Rönnberg J, Neovius L, Kjellander M. Moni-toring the environment: sound localization equipment for deaf-Blind people. Acta Otolaryngol (Stockh) 1999;119(2):146-9.
2.Johansson B. A new coding amplifier system for the severely hard of hearing. In: Third International Con-gress on Acoustics; 1959; Stuttgart; 1959. p. 655-7. 3.Plant G, Gnosspelius J, Spens K-E. Three studies us-ing the KTH speech trackus-ing procedure. STL-QPSR STL-QPSR 1994;35(1):103-34.
4.Rosenhouse J. A new transposition device for the deaf: a case study. Hear J 1990;43(11):20-5.
5.Borg E, Möller K, Rönnberg J, Neovius L. Monitor-ing environmental events: problems, strategies and sen-sory compensation. In: ISAC’00 Conference; 2000 May 23-6, 2000; Exeter; 2000.
6.Sundström B, Borg E. Gravt hörselskadade och
vux-endövas nytta och/eller besvär med hörapparat. Report. Örebro: Ahlséns Forskningsinstitut; 2004. Report No.: Rapport / Ahlséns forskningsinstitut; 8
7.Spens K-E. To “hear” with the skin (dissertation). Stockholm: Kungliga Tekniska Högskolan; 1984. 8.Traunmüller H. The Sentiphone: a tactile communica-tion aid for deaf. Technology report Stockholm Depart-ment of Speech Communication and Music Acoustics; 1977 Mars 1977.
9.Summers I, R, editor. Tactile aids for the hearing im-paired. London: Whurr Publishers; 1992.
10.Traunmüller H. The sentiphone: a tactual speech communication aid. J Commun Disord 1980; 13(3):183-93.
11.Reed CM, Delhorne LA. The reception of environ-mental sounds through wearable tactual aids. Ear Hear 2003;24(6):528-38.
Stock-holm: Department of Speech Communication and Music Acoustics; 1977 Mars 1977.
13.Piroth HG. Incorporation of the fortis-lenis feature in a quasiarticulatory system of tactile speech synthesis by adding temporal variations. (The Eleventh International Congress of Phonetic Sciences. In: The Eleventh Intena-tional Congress of Phonetic Sciences; 1987 August 1-7; Tallinn, Estonia, USSR; 1987 p. 369-72.
14.Komazec Z, Lemajic-Komazec S, Dankuc D, Vlas-ki L. (Cochlear implantation--risk and complications). Med Pregl 2008;61 Suppl 2:27-30.
15.Rihkanen H, Jauhiainen T, Linkola H, Palva T. Co-chlear implants, vibrators and hearing aids in the re-habilitation of postlingual deafness. Scand Audiol 1990;19(2):117-21.
16.Tyler RS. Cochlear implants: audiological founda-tions San Diego, Calif: Singular Publishing Group; 1993.
17.Clark G. Cochlear implants: fundamentals and appli-cations. New York: Springer; 2003.
18.Spencer PE, Marschark M. Cochlear implants: issues and implications. In: Marschark M, Spencer PE, editors. Oxford handbook of deaf studies, language and educa-tion. Oxford: Oxford University Press; 2003. p. 434-50. 19.Borg E, Rönnberg J, Neovius L. Vibratory-coded directional analysis: evaluation of a three-microphone/ four-vibrator DSP system. J Rehabil Res Dev 2001; 38(2): 257-63.
20.Borg E, Neovius L, Kjellander M. A three-micro-phone system for real-time directional analysis: toward a device for environmental monitoring in deaf-blind. J Rehabil Res Dev 2001;38(2):265-72.
21.Ranjbar P, Borg E, Philipson L, Stranneby D. Au-ditive identification of signal-processed environmen-tal sounds: Monitoring the environment. Int J Audiol 2008;47(12):724 - 36
22.Ranjbar P, Borg E, Stranneby D. Vibrotactile identi-fication of signal-processed sounds from environmental events. J Rehabil Res Dev 2009;46(3).
23.Ranjbar P. Vibrotactile identification of signal-pro-cessed sounds from environmental events presented by a portable vibrator: A laboratory study. Under review 2009.
24.Goff GD. Differential discrimination of frequen-cy of cutaneous mechanical vibration. J Exp Psychol 1967;74(2):294-9.
25.Franzin O, Nordmark J. Vibrotactile frequency dis-crimination. Percept Psychophys 1975;17(5):480-4. 26.Verrillo RT. Effect of contactor area on the vibrotac-tile threshold. J Acoust Soc Am 1963;35(12):1962-6. 27.Yin RK. Case study research: design and methods. 3rd ed. Thousand Oaks: Sage Publications; 2002. 28.Arnold P, Heiron K. Tactile memory of deaf-blind adults on four tasks. Scand J Psychol 2002;43(1):73-9. 29.Eling P, Janssen M, Nota S. The advantage of en-coding tactile information for a woman with congenital deaf-blindness. Journal of Visual Impairment & Blind-ness 2007;101(10):653-8.
30.Goble AK, Hollins M. Vibrotactile adaptation en-hances frequency discrimination J Acoust Soc Am 1994;96(2 Pt 1):771-80.
31.Wallin A-M, Ahlström G. Cross-cultural interview studies using interpreters: systematic literature review. J Adv Nurs 2006;55(6):723-35.
32.Tyler RS. Cochlear Implants: Audiological Founda-tions Singular Publishing Group; 1992.
33.Clark G. Cochlear implants: fundamentals and appli-cations New York: Springer; 2003.
34.Reed CM, Delhorne L. Reception of environ-mental sounds through cochlear implants. Ear Hear 2005;26(1):48-61.
35.Almli CR, Finger S. Neural insult and critical period concepts. In: Bornstein MH, editor. Sensitive periods in development: interdisciplinary perspectives. Hillsdale, N.J.: Lawrence Erlbaum; 1987. p. 123-43.
36.Osberger MJ, Maso M, Sam LK. Speech intelligibil-ity of children with cochlear implants, tactile aids, or hearing aids. J Speech Hear Res 1993;36 (1):186-203. 37.Reefhuis J, Honein MA, Whitney CG, Chamany S, Mann EA, Biernath KR, et al. Risk of bacterial menin-gitis in children with cochlear implants. N Engl J Med 2003;349(5):435-45.