R E S E A R C H
Open Access
Integrating automatic question
generation with computerised adaptive test
Yuni Susanti
*†, Takenobu Tokunaga
†and Hitoshi Nishikawa
†*Correspondence:
[email protected] †Equal contributor
†Yuni Susanti, Takenobu Tokunaga
and Hitoshi Nishikawa contributed equally to this work.
Department of Computer Science (W8E-6F), Tokyo Institute of Technology, 2-12-1 Oookayama, Meguro-ku, Tokyo 152-8552, Japan
Abstract
The present study focuses on the integration of an automatic question generation (AQG) system and a computerised adaptive test (CAT). We conducted two experiments. In the first experiment, we administered sets of questions to English learners to gather their responses. We further used their responses in the second experiment, which is a simulation-based experiment of the AQG and CAT integration. We proposed a method to integrate them with a predetermined item difficulty that enables to integrate AQG and CAT without administering the items in a pretesting. The result showed that all CAT simulations performed better than the baseline, a linear test, in estimating the test taker’s true proficiency.
Keywords: Automatic question generation, Computerised adaptive test, English vocabulary question, Multiple-choice question
Introduction
One of the prominent research in the computer-assisted language testing field is an effec-tive measurement of the test taker’s proficiency. Computerised adapeffec-tive testing (CAT) has been studied as a solution to this, which is a method of testing where the test is adjusted according to the test taker’s proficiency. CAT aims at a precise and reliable measure of test taker’s proficiency by presenting items1 that are appropriate to their
proficiency (van der Linden and Glas2000). For example, a high-proficiency test taker would receive items that are more difficult compared to low-proficiency test takers. That way, the test taker would not be frustrated by questions that are too difficult or too easy for them. Therefore, CAT leads to a more precise measurement of their pro-ficiency. CAT evaluates the test taker’s proficiency after the response of each item and updates the estimated proficiency to select the next item to present to the test taker. This can also subside the drawback of the conventional linear test where all test tak-ers answer the same set of items in the same order regardless of the difference in their proficiency.
However, successful implementation of CAT often relies on a large collection of previously administered items called the item bank. The item bank consists of items
1Hereafter, we use the term ‘item’ interchangeably with ‘question’ and ‘question item’.
with their item parameters2 estimated from the test taker responses in a pretesting phase. Estimating the item parameters is called item calibration. As a result, CAT leads to a considerable cost in the item development, pretesting, and item calibra-tion processes (Veldkamp and Matteucci 2013). In addition, conducting a pretesting poses a risk of exposing the items before they are used in a real test. Integrat-ing CAT with an automatic question generation (AQG) could possibly mitigate the problems of costly item development in CAT. AQG enables a generation of many questions with their item difficulty to make it possible to eliminate the pretesting phase.
However, attempts in the integration of CAT and AQG are scarce. One early attempt by Bejar et al. (2002) assessed the feasibility of an approach to adaptive testing based on item models. They selected several item models and used them to produce isomor-phic items. They further calibrated the item models and applied the model calibration to all instances of the model. Another study by Hoshino (2009) developed an item difficulty predictor using machine learning and applied the predictor to assign the difficulty to newly generated items. In those related studies, the items still need to be calibrated by administering the items to test takers, either to obtain the model calibration or to train the difficulty predictor. Consequently, the cost of the cali-bration process could not be avoided. Unlike previous research, the present study discusses the possibility of integrating CAT with AQG without any item calibration process. It means that the item parameter is estimated during the question generation process.
To sum up, the contributions of this study is proposing the AQG and CAT integra-tion that makes item calibraintegra-tion unnecessary. Our proposal estimates item difficulty while generating the questions based on their components. We validate the feasibil-ity of the integration through a simulation-based experiment using data collected by administering the generated items to English learners. In the research and practice of technology-enhanced environment, this study contributes to the development of an effec-tive measurement of language learner’s proficiency using CAT. This study also potentially mitigates the problem of costly item development and pretesting by integrating the CAT with an AQG, which can produce as many questions as possible in a relatively short time.
In this study, we conducted a simulation-based evaluation of AQG and CAT integra-tion. Thus, the main research question is on the performance of the proposed method (CAT using predetermined item difficulty) compared to the common practice of CAT (using the estimated item difficulty from test taker responses) and linear test. To compare the performance, we plan to use the mean squared error (MSE) between the true profi-ciency of the test takers and the profiprofi-ciency estimated by the simulations as an evaluation metric.
The remainder of this paper is organised as follows. The next section presents a brief overview of the related work, including the AQG system, item difficulty control and CAT. Then, we present the evaluation experiments including the description of the proposed methods and their results and discussions. Finally, we conclude the paper and provide future research directions.
Related work
Automatic question generation (AQG)
There has been a considerable number of studies on automatic question generation, par-ticularly for the English test purposes (Brown et al.2005; Lin et al.2007; Smith et al.2010; Sakaguchi et al.2013; Susanti et al. 2015; Satria and Tokunaga 2017). Multiple-choice question, in particular, has received extra attention because it appears in standard-ised English proficiency tests such as TOEFL, TOEIC and IELTS. In the present study, we focus on multiple-choice vocabulary question since this type is the majority in the aforementioned standardised tests.
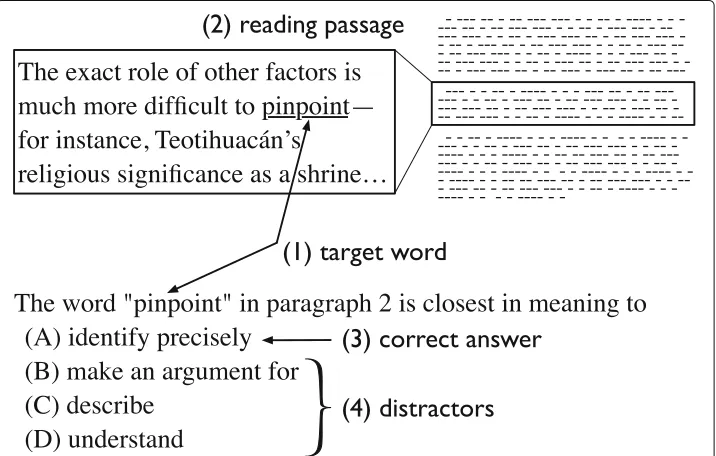
Figure1shows an example of the vocabulary questions used in the present study. They are modelled after the TOEFL vocabulary question. A question is composed of four com-ponents: (1) a target word which is the word being tested in the question, (2) a reading passage where the target word appears, (3) a correct answer and (4) distractors. This type of questions intends to measure a test taker’s ability to understand a meaning of the tar-get word when it is used in a particular context provided by the reading passage. There is only one correct answer among the four options.
We implemented the automatic generation system introduced by Susanti et al. (2015) to generate vocabulary questions as shown in Fig.1. Given a target word and one of its word senses (meaning) as the input, the process of generating a question starts with retriev-ing a readretriev-ing passage containretriev-ing the target word with the given sense from the Internet. The retrieved reading passage and a lexical dictionary are utilised to generate the correct answer and distractors.
Item difficulty control
In the AQG system, item difficulty can be controlled during the process of generating each component. For instance, the AQG system retrieves an easy reading passage for an
easy item, whereas it retrieves a difficult reading passage for a difficult item. Susanti et al. (2017) introduced a method to control the difficulty of an item based on the characteris-tics of the question components (reading passage, correct answer and distractors) during the item generation. Susanti et al. (2017) determined three factors including the reading passage difficulty, similarity between the correct answer and distractors, and the word difficulty level of the distractors.
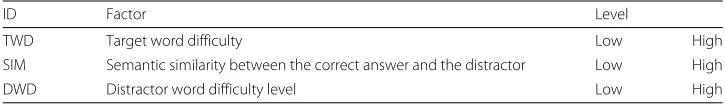
Following the work on item difficulty control proposed by Susanti et al. (2017), we gen-erated questions with various level of difficulty with respect to the following three factors: (1) target word difficulty (TWD), (2) similarity between correct answer and distractors (SIM) and (3) distractor’s word difficulty level (DWD). For each of these factors, we define two levels, high and low, as shown in Table1.
Susanti et al. (2017) reported that the reading passage difficulty (RPD) did not affect the item difficulty since most of the test takers might not read the reading passage to answer the questions. Therefore, instead of RPD, we utilise the target word difficulty (TWD) in the present study. We leveraged the JACET 8000 word difficulty list (Ishikawa et al.2003) for the TWD. In this study, we set the JACET 8000 level less than or equal to 3 as low and greater than or equal to 4 as high considering the target word difficulty distribution in our list of target words. As with the TWD, we used JACET 8000 for DWD where the three candidates with the lowest level are adopted as the low-level distractors, and the three highest level candidates are adopted as the high-level distractors. By setting the two levels, high and low, we can easily define each level like this: a fixed number of highest-scored candidates as high-level distractors, and a fixed number of lowest-scored candidates as low-level distractors. This simple definition of low level and high level for every factor is the reason why we considered only two levels in this study.
We employed the word embedding technique, GloVe (Pennington et al.2014), for calcu-lating the semantic similarity between the correct answer and distractors (SIM), following the implementation of Susanti et al. (2017). The three candidates with the lowest simi-larity are chosen for the low-level distractors, and the three candidates with the highest similarity are chosen as the high-level distractors.
Computerised adaptive test
In computerised adaptive test (CAT), emerged in the 1970s, items are chosen to present to examinees based on their previous responses. Initially, this concept was calledtailored testing by Lord et al. (1968). When computer technology facilitated implementation of this concept, the name was changed into computerised adaptive testing. Unlike the con-ventional paper-and-pencil test (i.e. linear test), CAT prepares different tests for different test takers.
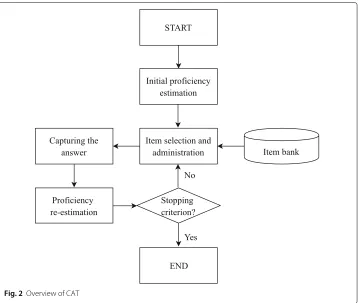
The procedure of administering CAT is illustrated in Fig.2. The test starts with setting the initial proficiency of a test taker. Then, the CAT selects the first item according to the initial proficiency. The items are selected from the item bank, which is a collection of
Table 1Factors to control the item difficulty
ID Factor Level
TWD Target word difficulty Low High
SIM Semantic similarity between the correct answer and the distractor Low High
Fig. 2Overview of CAT
items. The proficiency of the test taker is then re-estimated concerning their response to the first item. This estimation is then used to determine the next item. The cycle of the process continues until it reaches a certain stopping criterion. The following is a detailed description of the four main steps of CAT, summarised from Davey and Pitoniak (2006).
1.Initial proficiency (θ0) estimation.Ideally, the closer initial proficiency is to the true
proficiency, the faster it converges to the test taker’s true proficiency value. The initial proficiency may be set in various ways, including (1) a standard value for all test takers and (2) a random value according to a probability distribution.
2.Item selection.An item is selected based on the current estimation of the test taker’s proficiency. We listed several strategies in the following.
• Maximum information selection (Weiss1974): it selects an item that maximises the information gain. This method guarantees a faster decrease of standard error, but it can cause overexposure of items in the bank. In one-parameter models, an item is most informative when its difficulty parameter is close to the test taker’s proficiency (matched difficulty). This is the oldest and widely used item selection method.
• Cluster selection (De Rizzo Meneghetti and Thomaz Aquino Junior2017): the item selection begins by clustering the items according to their parameter values and selects the items from the cluster that contains either the most informative (discriminating) item or item with the highest average information gain.
3.Proficiency (θ) re-estimation.The test taker’s proficiency is re-estimated after the response to the administered item. This proficiency reflects the test taker’s proficiency up to that item in the test. Common methods for the proficiency re-estimation include (1) maximum-likelihood estimation and (2) Bayesian estimation which uses prior knowledge of the distributions of the test taker’s estimated proficiencies.
4.Stopping criterion.In CAT, a test ends when it reaches a predefined threshold of the standard error or when a fixed number of items is administered.
Evaluation experiment
In this study, we conducted a simulation-based evaluation of AQG and CAT integration. First, we asked the English learners to complete sets of questions with various difficulty generated in advance by the automatic question generated system equipped with a dif-ficulty control mechanism. Next, we used their responses on every item to conduct the CAT simulation. Therefore, the evaluation consists of two experiments: (1) experiment 1: gathering the response data and (2) experiment 2: CAT simulation, as explained in the following.
Experiment 1: gathering response data
The research question in experiment 1 is whether the automatically generated question items measure test taker proficiency. In this experiment, we generated the question items using the AQG system explained in the ‘Automatic question generation (AQG)’ section and administered them to the English learners.
Experimental design
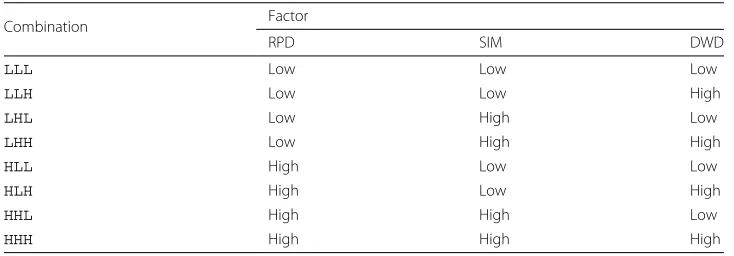
Questions We created all eight possible combinations of the three factors affecting diffi-culty (Table1) with two levels each, as shown in Table2. We prepared 24 question items for each combination in Table 2, generating 192 question items in total. Note that we used 192 different target words for these question items. We divided the 192 items into six question sets (QS_A to QS_F), taking into account the balance of the combinations and parts-of-speech of the target words. Our participants are 116 first-year Japanese high school students, 27 female and 89 male students. We divided them into six groups (C_A to C_F) based on their class at the high school. Each group worked on each question set. One question set consists of 32 question items with four items for each combination. The target words were selected from the Oxford3000 words3and GSL4word lists.
Experimental procedure We conducted the experiment as an online test. The partici-pant took the test using computer. Each group worked on the assigned question set. The test was 30 min long. All participants in each group worked on the question set together in the same classroom.
Table 2Combinations of three factors
Combination Factor
RPD SIM DWD
LLL Low Low Low
LLH Low Low High
LHL Low High Low
LHH Low High High
HLL High Low Low
HLH High Low High
HHL High High Low
HHH High High High
Result and discussion
We verified whether the automatically generated question items measure test taker pro-ficiency by calculating the correlation of the test taker scores on the test with their real latest term exam scores. We have several reasons why we used the latest term exam scores as the reference for participant English proficiency.
• It was the most recent English exam that the participants took.
• Since they are high school students, it was the only score that all of them have. Some students have scores of English standardised tests such as TOEIC or TOEFL, but not all of them have.
We also analysed the item difficulty of the generated question items since it will be used in experiment 2.
Correlation of the test taker’s scores We have 22,272 responses in total for all ques-tion items (116 participants worked on 192 quesques-tion items). We calculated the test taker’s score of our experiment by dividing the number of their correct responses by the total number of questions in the question set, i.e. 32. The overall correlation between scores of all participants is 0.384, and the Cronbach alpha value is 0.515. Table3shows Pear-son correlation coefficients between the student test scores and their scores on the latest English term exam in each group.
As we can see in Table3, we do not have strong correlations between the test taker’s score of the experiment and their term exam scores in all classes. The latest term exam includes different types of questions (reading, grammar, vocabulary, etc.) to assess overall English skill, while our test focuses on vocabulary. This would be the main reason for the low correlation scores. The correlation is particularly low in class B, in which the
Table 3Correlation of test taker’s scores in the experiment with their latest term exam scores
Question set Group Correlation coefficient No. of students
QS_A C_A .405∗ 21
QS_B C_B −.190 20
QS_C C_C .289 18
QS_D C_D .521∗ 19
QS_E C_E .579∗ 19
QS_F C_F .301 19
average .301 116
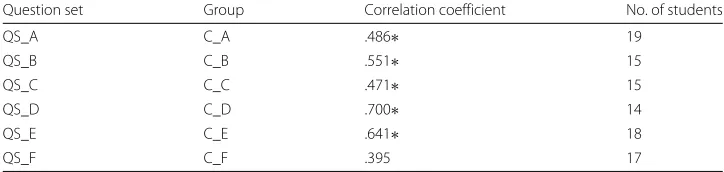
Table 4Correlation of test taker’s scores (extreme cases removed)
Question set Group Correlation coefficient No. of students
QS_A C_A .486∗ 19
QS_B C_B .551∗ 15
QS_C C_C .471∗ 15
QS_D C_D .700∗ 14
QS_E C_E .641∗ 18
QS_F C_F .395 17
*Statistical significance atp<.05
correlation coefficient is negative. The error analysis in the class B data shows that there are several extreme cases where the test takers with the high exam score did not perform well in our experiment, and vice versa. Table4shows all correlation coefficients after we remove in total 18 extreme cases from all groups (where the difference of the scores is more than 30 points).
Estimating the item difficulty There are several ways of estimating item difficulty from the test taker’s responses. In test theory such as Classical Test Theory (CTT) and Item Response Theory (IRT), the difficulty is defined as the likelihood of correct responses, not as the perceived difficulty nor necessary amount of effort (DeMars2010). We calculated the estimated item difficulty of all question items using both CTT and IRT (using R5 software and the lazyIRT package6). We found that the item difficulties estimated by CTT
(P) and IRT (b) are strongly correlated (averager= .825). Hence, for further analysis, we use only the CTT difficulty (P). Table5presents the descriptive statistics of the estimated item difficulties from CTT.
Analysis of variance on combinations The purpose of the analysis of variance (ANOVA) is to see if the differences in the mean difficulty index between combinations are significant. If they are different, it means that the item difficulty can be controlled using the combination of the three factors.
Figure3shows the box plot of the average difficulty indexPfor each combination. The box plot shows that the means (red circles) are different for each combination. However, the difference varies greatly depending on the combinations. Hence, these differences in means could have come about by chance. We performed a one-way ANOVA on the combinations to see if the differences between them are statistically significant. We sub-sequently looked at thepvalue of the ANOVA results to determine to what extent the differences between the means are significant.
We performed the ANOVA on (1) the eight combinations shown in Table2and (2) four regrouped combinations, as explained below.
• Eight combinations. The one-way ANOVA was performed on the eight combinations, yielding in ap value less than .01. This indicates that the mean differences in the difficulty between the eight combinations are statistically significant at a significance level of .01, suggesting that the three factors did affect the item difficulty.
5https://www.r-project.org
Table 5Descriptive statistics of the estimated item difficulty
P(CTT)
QS_A QS_B QS_C QS_D QS_E QS_F
n 32 32 32 32 32 32
¯x .507 .509 .460 .454 .507 .434
sd .091 .095 .083 .098 .089 .085
max .687 .687 .562 .625 .656 .594
min .375 .312 .219 .281 .312 .312
rwithb(IRT) .789 .782 .830 .840 .891 .816
• Four regrouped combinations. We reduced the combinations into four groups based on the number of ‘high’ factors: (1)H0 (LLL), (2)H1 (LHL, LLH, HLL), (3)H2 (LHH, HHL, HLH)and (4)H3 (HHH). The rationale behind this regrouped combinations is that the combination with more ‘high’ factors are expected to be more difficult than the one with fewer ‘high’ factors. The result of ANOVA shows that the difficulty differences between these four new groups are statistically significant (p value<.01). This indicates that setting the factors to high or low influences the item difficulty; to be more concrete, the items with more ‘high’ factors are more difficult than those with fewer ‘high’ factors. Therefore, we can control the item difficulty by varying the investigated factors. Figure4shows the box plot of the regrouped combinations.
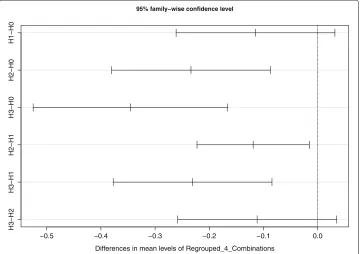
We also conducted a post hoc test (TukeyHSD) at a 95% confidence level on the pairs of the four regrouped combinations. Figure5shows the result that the mean
differences are statistically significant for four (H2-H0, H3-H0, H2-H1, H3-H1) out of the six pairs.
Fig. 4Box plot for four regrouped combinations
The correlation between the test taker scores in the experiment and their latest exam scores (Table3) shows that the automatically generated question items can measure the proficiency of the test takers in every class except for one where the correlation is negative. Thus, we have an affirmative answer to our research question. However, the correlation is not so strong. Further investigation with more participants is necessary to reinforce the answer to our research question.
In this study, we propose the use of predetermined item difficulty for conducting the CAT simulation to demonstrate the feasibility of integrating AQG with CAT without item calibration. Looking at the result of the ANOVA in the eight combinations (Fig.3), even when it yielded statistically significant mean differences, we are not sure how to interpret the item difficulty into eight levels since we are not sure of the total order of the eight com-binations. Whereas for the four regrouped combinations, we can make the order based on the number of ‘high’ level factors, and the result also shows a statistically significant result. Thus, we experiment on the predetermined item difficulty using the result of the four regrouped combinations as explained in experiment 2.
Experiment 2: CAT simulation
The research question in experiment 2 is on the performance of the proposed method (CAT using predetermined item difficulty) compared to the common practice of CAT (using the estimated item difficulty from test taker responses).
Method: variation of item difficulty
To conduct an AQG-CAT integration simulation, we need three main elements: (1) items with their item parameters, (2) test taker’s responses on every item and (3) test taker’s real proficiency to calculate the error of the proficiency measurement.
For the elements (1) and (2), we use the result of experiment 1. In experiment 1, we administered the machine-generated questions to 116 high school students as the test takers. As a result, we obtained the test taker’s responses to 192 items. We use these items as the element (1) and the test taker’s responses as the element (2). However, we excluded the data from group C_B for experiment 2 since the correlation between test takers’ scores on the experiment and their exam scores is negative, as explained in the result and discussion of experiment 1. Hence, we used 160 items in total.
In this paper, we adopt a one-parameter logistic model which considers only the item difficultyb(Appendix); thus, for element (1), we only need to define the item difficulty for every item. Usually, item difficulty is estimated from the test taker’s responses. In this study, we also use the item difficulty that is predetermined from the question compo-nents. The predetermined item difficulty is calculated in advance without any test taker’s response; it means we do not need to administer the item to the test takers beforehand.
Accordingly, we prepared the following variations of item difficulty including the gold standard for the element (1).
b. REG item difficulty.We calculate the item difficulty by using linear regression in this variant. We controlled the item difficulty of the questions used in experiment 1 by combining the three factors of question components: TWD, SIM and DWD. To apply the linear regression, we normalise the numeric value for each factor, as follows.
• TWD: we use the target word difficulty level of JACET 8000, with normalisation into range [0, 1].
• SIM: we use the average similarity score between the correct answer and distractors. The similarity score, ranging over [0,1], is calculated with cosine similarity on the GloVe word embedding.
• DWD: we use the average distractor word difficulty level of JACET 8000, with normalisation into range [0, 1].
Using the above numeric values for each factor and the CTT-based item dif-ficulty calculated from the test taker’s responses, we run a linear regression to get the regression coefficients. We use the coefficients to calculate the predeter-mined item difficulty for all items. This method is similar to the work done by Hoshino (2009). However, the work by Hoshino (2009) used a binary clas-sification approach where it can only classify the item difficulty into ‘easy’ and ‘difficult’.
c.ORD item difficulty.We represent the predetermined item difficulty by an ordinal value from 1 to 4 in this variant, following the result of the analysis in experiment 1. In experiment 1, we generated each item with one of the combinations of the three fac-tors as listed in Table2. Further analysis showed that we could group the items into four difficulty levels based on the number of the ‘high’ factor in the combinations. The result also showed that the items with more high factors are more difficult than those with fewer high factors. The four groups are (1) H0: no high factor, (2) H1: only one high factor, (3)H2: two high factors and (4)H3: all high factors. Figure4illustrates the grouping.
We further represent the item difficulty of the items in each group with an ordinal value from 1 (H0) to 4 (H3). Hence, the items in the same group are assigned the same value representing the item difficulty.
d. AVG item difficulty.We replace the ordinal values of ORD with the average item difficulty of the items in each group. We estimate the difficulty index for all items using CTT and average them in each group to calculate the item difficulty of the group as shown in Fig.4. Since the item difficulty index increases as the item becomes easier, we invert them for this variant. Thus, we have four average values, one for each group. Note that the AVG item difficulty requires the test taker’s responses as the REG item difficulty; that means a pretesting is necessary.
The AVG and REG item difficulty are included in the experiment to show the feasibility of using predetermined item difficulty which are not calculated from test taker responses as in the EST item difficulty. For example, in the case of the REG item difficulty, we can set up the weight (coefficient) manually for every factor that made up a question and create an item with its item difficulty calculated with the weight.
Experimental design
We conducted the simulation using a CAT simulation package namedcatsimdeveloped by De Rizzo Meneghetti and Thomaz Aquino Junior (2017) and adjusted it to our exper-iment setting. Using the test taker’s responses collected in experexper-iment 1, we conducted both CAT and linear test simulations. We prepared the following simulation settings.
1. Linear test simulation (LIN_EST). In this setting, we simulate the linear test as in experiment 1. We use the EST item difficulty as described in the ‘Method: variation of item difficulty’ section. We use the same order of items in the test as in experiment 1. The test stops when 20 out of 32 items are administered (test size = 20). This setting serves as the baseline.
2.CAT simulation with EST item difficulty (CAT_EST).This is the CAT simulation using the EST item difficulty. This setting serves as the gold standard because it simulates the common setting of CAT. The test size for this simulation is 20.
3. Supervised CAT simulation. In this CAT simulation, we use the REG and AVG item difficulties. These two item difficulties are not estimated directly from the test taker’s responses using CTT nor IRT as opposed to the EST item dif-ficulty. They are calculated from the test taker’s responses, as explained in the ‘Method: variation of item difficulty’ section; therefore, we call this simulation ‘supervised’. We performed two supervised CAT simulations: with the REG item difficulty (CAT_REG) and with the AVG item difficulty (CAT_AVG). To make the evaluation more reliable, cross-validation is a commonly used cross-validation technique for assessing the generalisation of a method/ experiment in a supervised setting. In our experiment, we performed the cross-validation by taking two ways of dividing data into the training and test data: the test taker-based division and item-based division. By performing those two approaches, we can investigate the model robustness against test taker variation and item variation.
(a) Test taker-based division. We conducted four-fold cross-validation (CV) by dividing data regarding test takers, i.e. we divided the test takers into three quarters and one quar-ter, and used the responses to each item by the three quarter test takers for training and the rest for testing. The quarters were rotated four times. At each fold, we used the train-ing data for calculattrain-ing the average difficulty of each group in theCAT_AVGsimulation and the regression coefficients (the item difficulty regression model) for theCAT_REG simulation. The average difficulty calculated in the training set was further used to con-duct the CAT_AVG simulation which is performed only on the data in the test sets. The test size for this simulation is 20. (b) Item-based division. In this setting, instead of divid-ing by the responses, we divide the data based on the items. We conducted two-fold cross-validation by dividing data regarding items, i.e. forCAT_AVG, we split the 32 items in half, 16 items, in each question set and used the responses for one of them as train-ing and the rest for testtrain-ing and vice versa. At each fold, we used the traintrain-ing data for calculating the average difficulty of each group in theCAT_AVG. ForCAT_REG, we con-ducted the two-fold cross-validation on all items (total 160 items). At each fold, we used the training data for calculating the regression coefficients for theCAT_REGsimulation. The CAT simulation is then performed only on the data in the test set. The test size for bothCAT_AVGandCAT_REGin this item-based division is 10.
‘Method: variation of item difficulty’ section, we represent the ORD item difficulty by an ordinal value from 1 to 4. The test size is 20.
For the CAT simulation, we initialised the proficiency of the test takers to a standard fixed value for all test takers (initial proficiency = 0). We used the maximum informa-tion selecinforma-tion strategy for the item selecinforma-tion and the maximum-likelihood estimainforma-tion for the proficiency re-estimation. We provide the summary of the abbreviation of the item difficulties and simulations used in the experiment in Table6for readability.
Result and discussion
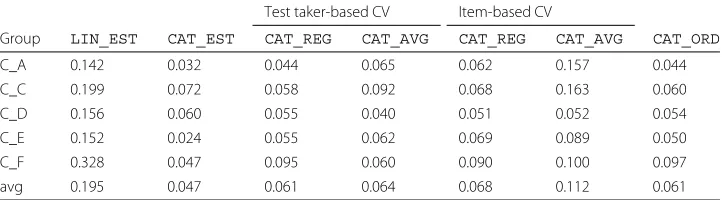
We conducted seven CAT simulations including one linear test simulation as the baseline, one gold standard CAT simulation and five CAT simulations. We com-pared the result of all simulations based on the mean squared error (MSE) cal-culated between the estimated proficiency at the end of each simulation and the proficiency of the test takers based on their latest term exam scores. Table 7 sum-marises the result. The smaller MSE indicates the better simulation because it means that the estimated item difficulty converges closer to the true proficiency of the test takers.
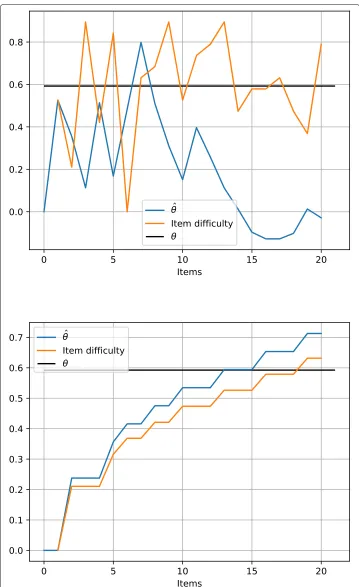
TheLIN_ESTsimulation, corresponding to a linear test, produced the biggest MSE (.195) compared to the CAT simulations. This proves the effectiveness of an adaptive test to measure the test taker proficiency. We randomly sampled a single test taker in our experiment to show his progress during the test in each simulation. Figure6illustrates the test progress of the test taker in theLIN_ESTsimulation. Thex-axis denotes the number of items, and they-axis denotes the estimated item difficulty (orange line), the real proficiency of the test taker (black line), and the estimated proficiency of the test taker by the simulation (blue line). TheLIN_ESTsimulation presents the test taker with items in the order of the test in experiment 1 regardless of the test taker’s proficiency. The top-side graph in Fig.6reflects this fact showing a heavy up and down of the estimated values.
Among the CAT simulations, theCAT_ESTsimulation gave the smallest MSE (.047). This simulation is the gold standard of CAT because it uses the item difficulty cali-brated from the test taker’s responses. The bottom-side graph in Fig.6illustrates the test progress of the same test taker in theCAT_ESTsimulation. Unlike theLIN_EST simula-tion, the estimated item difficulty (orange line) and the estimated proficiency (blue line) go close to each other during the test progress.
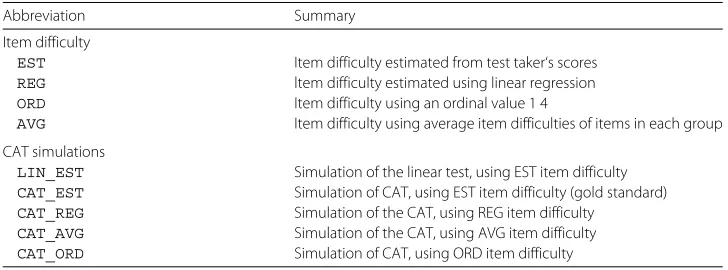
Table 6Summary of abbreviations
Abbreviation Summary
Item difficulty
EST Item difficulty estimated from test taker‘s scores
REG ltem difficulty estimated using linear regression
ORD Item difficulty using an ordinal value 1 4
AVG Item difficulty using average item difficulties of items in each group
CAT simulations
LIN_EST Simulation of the linear test, using EST item difficulty CAT_EST Simulation of CAT, using EST item difficulty (gold standard) CAT_REG Simulation of the CAT, using REG item difficulty
CAT_AVG Simulation of the CAT, using AVG item difficulty
Table 7Mean squared error (MSE) of the CAT simulations
Test taker-based CV Item-based CV
Group LIN_EST CAT_EST CAT_REG CAT_AVG CAT_REG CAT_AVG CAT_ORD
C_A 0.142 0.032 0.044 0.065 0.062 0.157 0.044
C_C 0.199 0.072 0.058 0.092 0.068 0.163 0.060
C_D 0.156 0.060 0.055 0.040 0.051 0.052 0.054
C_E 0.152 0.024 0.055 0.062 0.069 0.089 0.050
C_F 0.328 0.047 0.095 0.060 0.090 0.100 0.097
avg 0.195 0.047 0.061 0.064 0.068 0.112 0.061
TheCAT_REGsimulation uses the predetermined item difficulty estimated by the linear regression. Therefore, each item has a different value of item difficulty depending on its question component factors. It means that this simulation adopts fine-grained item diffi-culty values. In the item selection step of CAT, it tries to present the test takers with an item with a closest item difficulty value to the test takers’ current proficiency. Thus, if the item difficulty has fine-grained values, CAT could find a more appropriate item to present to the test taker. That being the case, theCAT_REGsimulation is quite close to the gold standard, i.e. theCAT_ESTsimulation. In both test taker-based CV and item-based CV, the MSE of theCAT_REGsimulation is bigger than that of theCAT_ESTsimulation (the gold standard), but their difference is smaller compared to that of theLIN_EST simula-tion (the baseline). This result is encouraging because theCAT_REGsimulation using the predetermined item difficulty shows the smaller MSE compared to the baseline. Figure7
shows the test progress of the same test taker in theCAT_REGsimulation.
We calculated the correlation between the estimated item difficulty from the test taker’s responses (used in the gold standard and the baseline simulation) and the predetermined item difficulty (used in theCAT_REGsimulation). This yielded correlation coefficientr= .37 (statistically significant withp<.01), which is considered as a low correlation. How-ever, this result is encouraging because it shows that even when the predetermined item difficulty does not strongly correlate with the estimated item difficulty, it still shows an acceptable performance when they are incorporated into CAT. This is supported by a smaller MSE of theCAT_REGsimulation compared to the baselineLIN_ESTsimulation, as shown in Table7. Figure8shows a scatter plot between the two item difficulties.
TheCAT_ORDandCAT_AVGsimulations use only four values of item difficulty. They use coarse-grained item difficulty values in this respect. Figure 9 illustrates the test progress of the same test taker in theCAT_ORDandCAT_AVGsimulations. TheCAT_AVG simulation gave a bigger MSE than the gold standard and a smaller MSE than the base-line. However, compared to theCAT_REGsimulation, theCAT_AVGsimulation yielded a slightly bigger MSE in the test taker-based CV. In the item-based CV, it yielded an MSE almost doubled that of the MSE of theCAT_REGsimulation. We can explain this differ-ence by the differdiffer-ence of granularity of difficulty values, i.e. four values vs. continuous real values.
Fig. 7Test progress of a test taker inCAT_REGsimulation
than the gold standard, but the difference is not that great. This result is encouraging for incorporating a predetermined item difficulty into CAT since it indicates that even only with four levels of the predetermined item difficulty, it performed relatively better than the linear test.
CAT simulation using the proficiency fromCAT_EST In the preceding discussion, CAT_ESTis used as the gold standard of CAT because it uses the item difficulty
brated from the test taker’s responses. Based on the item parameters and responses of the test takers, the simulating data sets with true values of item difficulties and profi-ciencies can be generated. The mean squared error (MSE) can also be calculated using the proficiencies (true values) generated byCAT_ESTinstead of the latest term exam scores. The result showed the same tendencies with the MSE calculated using the lat-est term exam scores, i.e. the CAT simulations gave smaller MSE compared to the linear test. This result affirmed an encouraging result where even under low correla-tion of test taker scores and their real proficiencies, the CAT simulacorrela-tions still performs better compared to the linear test. Therefore, the integration of AQG and CAT, espe-cially when using the predeterminated item difficulty, can alleviate the problems of AQG and CAT.
Conclusions
The present study introduced the integration of an automatic question generation (AQG) system with a computerised adaptive test (CAT). Integrating CAT with AQG could mit-igate the problems of costly item development in CAT. Generating many questions and determining their item difficulty are possible with AQG, thus eliminating the needs of item pretesting.
We conducted two experiments. In the first experiment, we administered the auto-matically generated vocabulary questions to English learners. This experiment aimed at collecting the test taker’s responses to the questions, which are indispensable for CAT. The collected data was used in the second experiment.
In the second experiment, we conducted the simulation using three types of item difficulty: one estimated from the test taker’s responses of the first experiment as a gold standard, and predetermined item difficulties, one by the supervised and another by the unsupervised methods. The supervised predetermined item diffi-culty uses the test taker’s responses to estimate the parameters for calculating item difficulty. Using the unsupervised predetermined item difficulty is our proposal in which we calculate the item difficulty while generating the question items with-out the test taker’s responses. Therefore, our proposed method does not require pretesting.
We evaluated the performance of the simulations by looking at the mean squared error (MSE) between the true proficiency of the test takers and the proficiency esti-mated by each simulation. The result shows that all proposed CAT simulations using the predetermined item difficulty (CAT_REG, CAT_AVGandCAT_ORD) produced smaller MSEs than the baseline LIN_ESTsimulation. Thus, we conclude that the integration of AQG and CAT with predetermined item difficulty is feasible from the experimental results.
Nevertheless, in this experiment, the predetermined item difficulty CAT_REG and CAT_AVGstill uses the result of a pretesting, whileCAT_ORDis a very simple way to define the item difficulty. Re-investigation and study on how to predetermine the item difficulty are necessary.
Our future research directions include evaluating the integration of AQG with CAT in a real setting.
Table 8Samplebvalues ( class A )
Item_ID b(IRT) b(CTT) b(AVG)
Q1 −5.6271468 0.047619048 0.35
Q2 5.5077315 0.714285714 0.46
Q3 4.8854019 0.857142857 0.69
Q4 0.6529363 0.571428571 0.58
Q5 −1.8483412 0.095238095 0.58
Q6 2.4474034 0.80952381 0.46
Q7 −5.4746724 0.285714286 0.46
Q8 −0.8790274 0.380952381 0.58
Q9 1.0941578 0.523809524 0.46
Q10 1.3606067 0.80952381 0.69
Q11 1.1547282 0.666666667 0.58
Q12 0.8300671 0.80952381 0.46
Q13 −0.8505837 0.285714286 0.58
Q14 −20 0.047619048 0.35
Q15 −20 0 0.58
Q16 1.2292055 0.714285714 0.46
Q17 0.1241581 0.523809524 0.58
Q18 −3.3793825 0.095238095 0.46
Q19 2.0316962 0.761904762 0.46
Q20 3.54614 0.619047619 0.58
Q21 0.5270345 0.619047619 0.35
Q22 −4.1061856 0.333333333 0.69
Q23 −1.1511618 0.19047619 0.46
Q24 6.1198977 0.80952381 0.58
Q25 4.1147967 0.619047619 0.46
Q26 −0.8978591 0.142857143 0.46
Q27 12.5721081 0.80952381 0.35
Q28 5.227762 0.666666667 0.58
Q29 10.7676387 0.857142857 0.69
Q30 −20 0.047619048 0.46
Q31 −0.2172442 0.476190476 0.58
Q32 1.8086434 0.571428571 0.58
Table 9Sample error values (CAT_AVGsimulation, class A)(Continued)
True proficiency Predicted Error
0.425 0.179 0.246
0.440 0.298 0.142
0.468 0.500 −0.033
0.475 0.298 0.177
0.478 0.702 −0.224
0.525 0.479 0.046
0.573 0.702 −0.129
0.608 0.814 −0.207
0.610 0.702 −0.092
0.625 0.298 0.327
0.625 0.479 0.146
0.648 0.500 0.147
0.720 0.702 0.018
Table 9Sample error values (CAT_AVGsimulation, class A)
True proficiency Predicted Error
0.783 0.814 −0.032
0.850 0.814 0.036
0.863 0.814 0.048
0.868 0.814 0.053
0.878 0.814 0.063
0.893 0.179 0.714
0.960 0.814 0.146
Abbreviations
AQG: Automatic question generation; CAT: Computerised adaptive test; TOEFL: Test of English as a Foreign Language; TOEIC: Test of English for International Communication; IELTS: International English Language Testing System; CTT: Classical Test Theory; IRT: Item Response Theory; ANOVA: Analysis of variance; MSE: Mean squared error
Acknowledgements
We appreciate Mr Ryo Kato, Mr Soma Kamiya, Ms Megumi Kaneda and Mana Miura at Classi corp. for providing the test platform, and Ms Michiyo Iguchi, Ms Ayano Miyahara, Suguri Suzuki and Mr Yoshio Nakamichi at Tokyo Tech High School of Science and Technology for arranging student participation.
Authors’ contributions
The authors read and approved the final manuscript.
Funding
Funding information is not applicable/no funding was received.
Availability of data and materials
There is no data and material available.
Competing interests
The authors declare that they have no competing interests.
Received: 8 October 2018 Accepted: 14 April 2020
References
Bejar, I.I., Lawless, R.R., Morley, M.E., Wagner, M.E., Bennet, R.E., Revuelta, J. (2002). A feasibility study of on-the-fly item generation in adaptive testing.Research Report Series. 2002: i-4.https://doi.org/10.1002/j.2333-8504.2002.tb01890.x. Brown, J.C., Frishkoff, G.A., Eskenazi, M. (2005). Automatic question generation for vocabulary assessment, InProceedings
of the Conference on Human Language Technology and Empirical Methods in Natural Language Processing
(pp. 819–826). Vancouver: Association for Computational Linguistics.
Chang, H.-H., & Ying, Z. (1999). A-stratified multistage computerized adaptive testing.Applied Psychological Measurement,
23(3), 211–222.
Davey, T., & Pitoniak, M.J. (2006). Designing computerized adaptive test, InHandbook of test development(pp. 543–573). Mahwah: Lawrence Erlbaum Associates, Inc.
De Rizzo Meneghetti, D., & Thomaz Aquino Junior, P. (2017). Computerized adaptive testing simulation through the package catsim.ArXiv e-prints.http://arxiv.org/abs/1707.03012.
DeMars, C. (2010).Item response theory: Understanding statistics measurement: Oxford University Press, Inc.
Frick, T. (1992). Computerized adaptive mastery tests as expert systems.Journal of Educational Computing Research,8(1), 187–213.
Hoshino, A. (2009).Automatic question generation for language testing and its evaluation criteria. Tokyo: PhD Thesis. University of Tokyo.
Ishikawa, S., Uemura, T., Kaneda, M., Shimizu, S., Sugimori, N., Tono, Y. (2003).JACET8000: JACET list of 8000 basic words: Tokyo JACET.
Lin, Y.-C., Sung, L.-C., Chen, M.C. (2007). An automatic multiple-choice question generation scheme for English adjective understanding, InProceedings of Workshop on Modeling, Management and Generation of Problems/Questions in eLearning, the 15th International Conference on Computers in Education (ICCE 2007)(pp. 137–142). Hiroshima. Lord, F.M., Novick, M.R., Birnbaum, A. (1968).Statistical theories of mental test scores. Oxford: Oxford, England:
Addison-Wesley.
Pennington, J., Socher, R., Manning, C.D. (2014). Glove: Global vectors for word representation, InEmpirical methods in natural language processing (EMNLP).http://www.aclweb.org/anthology/D14-1162. Accessed 25 Oct 2014 (pp. 1532–1543). Doha.
Rudner, L. (2002). An examination of decision-theory adaptive testing procedures, InProceedings of the Annual Meeting of the American Educational Research Association. Washington: Association of Test Publishers (ATP).
Sakaguchi, K., Arase, Y., Komachi, M. (2013). Discriminative approach to fill-in-the-blank quiz generation for language learners, InProceedings of the 51st Annual Meeting of the Association for Computational Linguistic(pp. 238–242). Sofia: Association for Computational Linguistic.
Satria, A.Y., & Tokunaga, T. (2017). Automatic generation of english reference question by utilising nonrestrictive relative clause, InProceedings of the 9th International Conference on Computer Supported Education(pp. 379–386). Setubal: INSTICC.
Smith, S., Avinesh, P., Kilgarriff, A. (2010). Gap-fill tests for language learners: Corpus-driven item generation, InProceedings of ICON-2010: 8th International Conference on Natural Language Processing(pp. 1–6). India: Macmillan Publishers. Susanti, Y., Iida, R., Tokunaga, T. (2015). Automatic generation of English vocabulary tests, InProceedings of the 7th
International Conference on Computer Supported Education(pp. 77–87). Lisbon: INSTICC.
Susanti, Y., Tokunaga, T., Nishikawa, H., Obari, H. (2017). Controlling item difficulty for automatic vocabulary question generation.Research and Practice in Technology Enhanced Learning,12(25), 16.
van der Linden, W.J., & Glas, G.A. (2000).Computerized adaptive testing: Theory and practice. Dordrecht: Springer. Veldkamp, B.P., & Matteucci, M. (2013). Bayesian computerized adaptive testing.Ensaio,78(21), 57–82.https://doi.org/10.
1590/S0104-40362013005000001.
Weiss, D.J. (1974).Strategies of adaptive ability measurement (RR 74-5Z). Minneapolis: Psychometric Methods Program, Department of Psychology, University of Minnesota.
Publisher’s Note