University of Pennsylvania
UPenn Biostatistics Working Papers
Year Paper
A Network-constrained Empirical Bayes
Method for Analysis of Genomic Data
Caiyan Li
∗Zhi Wei
†Hongzhe Li
‡∗University of Pennsylvania, [email protected] †[email protected]
‡University of Pennsylvania, [email protected]
This working paper is hosted by The Berkeley Electronic Press (bepress) and may not be commer-cially reproduced without the permission of the copyright holder.
http://biostats.bepress.com/upennbiostat/art28 Copyright c2008 by the authors.
A Network-constrained Empirical Bayes
Method for Analysis of Genomic Data
Caiyan Li, Zhi Wei, and Hongzhe Li
Abstract
Empirical Bayes methods are widely used in the analysis of microarray gene expression data in order to identify the differentially expressed genes or genes that are associated with other general phenotypes. Available methods often as-sume that genes are independent. However, genes are expected to function in-teractively and to form molecular modules to affect the phenotypes. In order to account for regulatory dependency among genes, we propose in this paper a network-constrained empirical Bayes method for analyzing genomic data in the framework of general linear models, where the dependency of genes is modeled by a discrete Markov random field model defined on a pre-defined biological net-work. This method provides a statistical framework for integrating the known biological network information into the analysis of genomic data. We present an iterated conditional mode algorithm for parameter estimation and for estimating the posterior probabilities using Gibbs sampling. We demonstrate the application of the proposed methods using simulations and analysis of a human brain aging microarray gene expression data set.
A Network-constrained Empirical Bayes Method for Analysis of
Genomic Data
Caiyan Li1 , Zhi Wei2 and Hongzhe Li1∗ 1Department of Biostatistics and Epidemiology
University of Pennsylvania School of Medicine, Philadelphia, PA 19104
2
Department of Computer Science
New Jersey Institute of Technology, Newark, NJ 07102.
∗Address correspondence to:
Hongzhe Li
Department of Biostatistics and Epidemiology University of Pennsylvania School of Medicine Philadelphia, PA 19104, USA.
Tel: (215) 573-5038
ABSTRACT
Empirical Bayes methods are widely used in the analysis of microarray gene expression data in order to identify the differentially expressed genes or genes that are associated with other general phenotypes. Available methods often assume that genes are independent. However, genes are expected to function interactively and to form molecular modules to affect the phenotypes. In order to account for regulatory dependency among genes, we propose in this paper a network-constrained empirical Bayes method for analyzing genomic data in the framework of general linear models, where the dependency of genes is modeled by a discrete Markov random field model defined on a pre-defined biological network. This method provides a statistical framework for integrating the known biological network information into the analysis of genomic data. We present an iterated conditional mode algorithm for parameter estimation and for estimating the posterior probabilities using Gibbs sampling. We demonstrate the application of the proposed methods using simulations and analysis of a human brain aging microarray gene expression data set.
Key words: Markov random field, Gibbs sampling, molecular modules.
1
Introduction
Empirical Bayes-based methods are one of the most popular statistical approaches for analy-sis of microarray gene expression data in order to account for the parallel nature of the infer-ence in microarrays and to borrow information from the ensemble of genes that can enhance the inference about each gene individually. Efron et al.[1] used a non-parametric empirical Bayes approach for analyzing the factorial microarray gene expression data. Lonnstedt and Speed [2] took a parametric empirical Bayes approach using a simple mixture of normal models and a conjugate prior and derived the closed-formed posterior odds of differential expression for each gene. Smyth [3] developed the hierarchical model of Lonnstedt and Speed [2] into a practical approach for general microarray experiments in the framework of general linear models with arbitrary coefficients and contrasts of interests. Smyth [3] also derived the posterior odds statistic in terms of a moderated t-statistic in which posterior
residual standard deviations are used in place of ordinary standard deviations. While these empirical Bayes methods have proved to be very useful for identifying the differentially ex-pressed genes or genes that are related to certain covariates, they make a key assumption that genes are independent. However, since many biological processes are involved in acti-vation of multiple pathways of correlated genes, the genes with regulatory relationships are expected to be dependent. These dependent genes often interact with each other to form molecular modules that affect the cellular and clinical phenotypes [4].
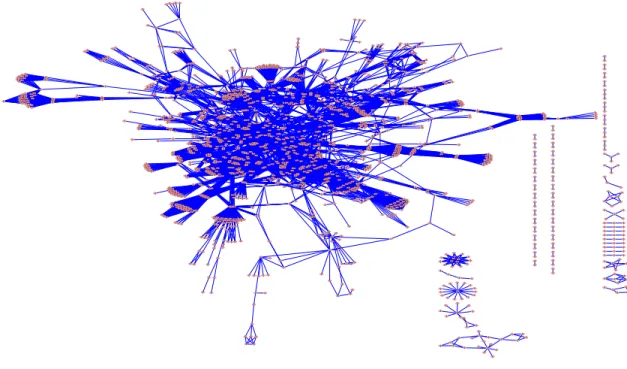
The goal of this paper is to develop a network-constrained empirical Bayes linear model for the analysis of genomic data where we utilize the prior genetic regulatory network infor-mation to model the regulatory dependency among genes. Inforinfor-mation about gene regulatory dependence has been accumulated from many years of biomedical experiments and is sum-marized in the form of pathways and networks and assembled into pathway databases. Some well-known pathway databases include KEGG, BioCarta (www.biocarta.com) and BioCyc (www.biocyc.org). As an exmaple, Figure 1 shows the KEGG human regulatory network [5], consisting of 33 interconnected regulatory pathways. There has been great interest in devel-oping statistical and computational methods that can integrate the prior biological network information into the analysis of genomic data, especially into the analysis of microarray gene expression data (see Ideker and Sharan [4] for a review). Representing the known genetic regulatory network as an undirected graph, Wei and Li [6, 7] and Wei and Pan [8] have recently developed hidden Markov random field (HMRF)-based models for identifying the subnetworks that show differential expression patterns between two conditions, and have demonstrated using both simulations and applications to real data sets that the procedure is more sensitive in identifying the differentially expressed genes than those procedures that do not utilize pathway structure information. While the methods of Wei and Li [6, 7] mainly focus on identifying differentially expressed genes between two conditions, in this paper, we develop a network-constrained empirical Bayes method for general linear models, which can handle more general covariates for the analysis of microarray gene expression data.
As a motivating example of our proposed methods, we consider the problem of identifying age-dependent molecular modules or subnetworks in human brains using the microarray gene expression data of Luet al. [9], where they conducted a microarray gene expression study of
Figure 1: Undirected graph of the KEGG regulatory network, consisting of 33 interconnected regulatory pathways. There are a total of 1663 genes (nodes) and 8011 regulatory relation-ships (edges).
the postmortem human frontal cortex from 30 individuals ranging from 26 to 106 years of age. To identity the aging-regulated genes, they performed simple linear regression analysis for each gene with age as a covariate. In our approach, we re-analyze this data set by combining the KEGG regulatory network information [5] with the gene expression data in order to identify the molecular modules that are aging-regulated. Here we can treat age as a continuous covariate for the analysis of gene expression levels.
The rest of the paper is organized as follows. We first present a network-constrained empirical Bayes method for general linear models and present the iterative conditional mode (ICM) algorithm [10] for parameter estimation. We then present results from simulation studies and analysis of the human brain aging gene expression data to evaluate the proposed method. Finally, we give a brief discussion of the methods and results.
2
Network-constrained Empirical Bayes Methods for
General Linear Models
2.1
Data, graphs and models
Given the phenotype (e.g., age) of n samples, we want to determine how the phenotype affects the expression levels of genes and which genes or subnetworks of genes are affected. LetY = (Y1, ..., Yi, ..., Yp) denote the microarray gene expression profiling data matrix (n×p)
ofpgenes overn samples, whereYi is the mRNA expression level of geneifor thensamples. Let X = (x1, ..., xn)T be the phenotype vector of the n samples. We assume the following
simple linear model for gene expression level for the ith gene:
Yi = αi+βiX+ǫi, var(ǫi) = σ
2
iI, i= 1, ..., p, (1)
where βi measures the effect of the covariate on the expression of gene i and ǫi is the
vector of random errors. To further specify our model, we introduce a random vector z = (z1, ..., zi, ..., zp)T, representing the gene states, where
zi = 1 if βi 6= 0 0 if βi = 0.
Besides the gene expression data, suppose that we have a network of known pathways that can be represented as an undirected graphG= (V, E), whereV is the set of nodes that represent genes or proteins coded by genes andE is the set of edges linking two genes with a regulatory relationship. Let p = |V| be the number of genes that this network contains. Note the gene set V is often a subset of all the genes that are probed on the gene expression arrays. If we want to include all the genes that are probed on the expression arrays, we can expand the network graph G to include isolated nodes, which are those genes that are probed on the arrays but are not part of the known biological network. For two genes g
and g′, if there is a known regulatory relationship, we write g ∼g′. For a given gene g, let Ng ={g′ :g ∼ g′ ∈E} be the set of genes that have a regulatory relationship with gene g
The key to our approach is that instead of assuming that z1,· · · , zp are independently,
identically distributed Bernoulli random variables, we assume that they are dependent on the network, whose dependency can be modeled as a simple discrete Markov random field. Specifically, following Wei and Li [6], we model the dependency of z = (z1, ..., zi, ..., zp)T
using a discrete Markov random field model with the following distribution:
p(z; Φ) ∝exp(γn1−ηn01), (2)
where Φ = (γ, η),n1 =Ppi=1ziis the number of genes at state 1 andn01 =
P
i∼jI{zi =zj}is
the number of neighboring genes with different states. The parametersγ andη are arbitrary and we require η to be non-negative to discourage neighboring genes with different states. Given the states of all other genes, the conditional probability of gene i with state zi is
pi(zi|z∂i; Φ) ∝exp(γzi−ηµi(1−zi)), (3)
where z∂i represents the neighbors of genei and ui(1−zi) denotes the number of neighbors
of gene i having state (1− zi) [10, 11]. In order to account for different degrees of the nodes (i.e., different numbers of neighboring genes on the network), we propose to modify the conditional probability (3) as
pi(zi|z∂i; Φ)∝exp(γzi−ηµi(1−zi)/di),
where di is the number of neighbors of the ith gene. We then make the following modeling assumptions:
Assumption 1. Given any particular realization z = (z1, ..., zi, ..., zp)T, the random
vari-ables Y = (Y1, ..., Yi, ..., Yp) are conditionally independent, i.e., the distribution of random
variable Yi only depends on zi. The conditional density of the observed gene expression Y, given z, is simply, l(Y|z) = p Y i=1 f(Yi|zi),
where f(Yi|zi) will be specified later (see equation 4).
Assumption 2. The true state z∗ is a realization of a discrete MRF with a specified
Assumption 3. The distributional assumptions about the data in this paper are given by: ˆ βi|βi, σ2 i ∼N(βi, viσ 2 i); ˆ σi2 |σ2 i ∼ σ2 i p−2χ 2 p−2,
where ˆβi, viσiˆ2
and vi are least-square estimators of βi and its variance based on the linear models (1).
2.2
Empirical Bayesian model for linear models
Given the large number of gene-wise linear model fits from the same genotype, an empirical Bayesian approach is commonly used to take advantage of the parallel structure. In this section, we first briefly review the hierarchical model introduced by Smyth [3] and present the key probability distributions that are used in the ICM algorithm. Smyth [3] introduced an inverse-gamma prior distribution to describe the variation ofσ2
i across genes with
hyper-parameters s2 0 and d0: 1 σ2 i ∼ 1 d0s20 χ2 d0.
Prior information on the non-zero coefficient βi is assumed equivalent to a prior observation
equal to zero with unscaled variances v0, i.e.,
βi|σ2
i, zi = 1∼N(0, v0σ 2
i).
Under the above prior information, the posterior mean of σ2
i can be written as ˜ σ2 i =E(σ 2 i|ˆσ 2 i) = d0s20+diσˆ 2 i d0+di .
Smyth [3] further defined a moderated t-statistic based on the posterior mean of the variance estimation by
˜
ti = βˆi ˜
σi√vi.
Smyth [3] showed that the moderated t-statistic and residual sample variance are inde-pendent, with the following distributions:
ˆ
σ2
i ∼s
2 0Fdi,d0;
˜
ti|zi = 0∼td0+di;
˜
ti|zi = 1∼(1 +v0/vi)1/2td0+di,
where F(.) and t(.) are the central F and t distributions.
Based on Assumption 1, we can write the conditional density of the observed gene ex-pression Y using the sufficient statistics ˜ti and ˆσ2
i as l(Y|z; Θ) = Πpi=1f(Yi|zi; Θ)∝Π p i=1f(ˆσ 2 i; Θ)f(˜ti|zi; Θ), (4)
where Θ = (d0, s20, v0) and ˆσi2 is the sample estimate of the residual variance based on the
linear model (1).
2.3
ICM algorithm and Gibbs sampling for parameter estimation
While inferring the true gene state z∗ for all pgenes, we carry out the parameter estimation
simultaneously. We propose the following algorithm based on the ICM algorithm by Be-sag [10] to estimate the parameter Θ in the hierarchical model for the linear regression and the parameter Φ in the network-constrained empirical Bayes models. The following iterative steps are involved in the algorithm:
(1). Get the estimation ˆd0 and ˆs20of the hyperparameters d0ands20 based on the methods
of Smyth [3].
(2). Obtain an initial estimate ˆz of the true statesz∗ based on the moderated t-statistic
˜
t.
(3). Estimate v0 by the value ˆv0, which maximizes the likelihood l(Y|zˆ; ˆd0,sˆ20,vˆ0) (see
Equation 4).
(4). Estimate Φ by the value ˆΦ, which maximizes the pseudolikelihood pl(ˆz; Φ) based on the current states ˆz, where
pl(z; Φ) = p X i=1 pi(zi|z∂i; Φ) = p X i=1
exp(γzi−ηµi(1−zi)) exp(γ−ηµi(0)) + exp(−ηµi(1))
(5). Carry out a single cycle of ICM based on the current ˆz, ˆΘ, and ˆΦ to obtain a new ˆ
z. Specifically, for i= 1, ..., p, update zi, which maximizes
P(zi|Y,zS/iˆ )∝f(˜ti|ziˆ; ˆΘ)pi(zi|z∂iˆ ; ˆΦ),
subject tozi = 1 or zi = 0.
(6). Go to step (3) for a fixed number of cycles or until approximate convergence of all the parameters. In particular, we stop the iterations when the maximum of the relative changes of the parameter estimates is smaller than a small valueǫ.
(7). Carry out a Gibbs sampling procedure for the gene states z∗ to obtain posterior
probabilities of qi = P r(zi = 1|Y; ˆΘ,Φ)ˆ , i = 1, ..., p based on the final parameter estimates of ˆΘ and ˆΦ from step (6).
The resulting posterior probabilities are then used to determine which genes are affected by the phenotype and those relevant genes can be mapped back to the network to identify the subnetworks. In addition, we can estimate the false discovery rate (FDR) based on these posterior probabilities [12].
3
Simulation Studies
To demonstrate the performance of our proposed procedure, we conducted simulation stud-ies and simulated data based on two real regulatory networks: the KEGG human regulatory network (see Figure 1) and the yeast transcription network used in Milo et al. [13]. For the KEGG network, we first obtained the network of 33 human regulatory pathways from the KEGG database (December 2006 version) and excluded those non-gene-gene interactions, e.g., compound-gene relations, compound-compound relations. The resulting data are rep-resented as an undirected graph where each node is a gene and an edge is drawn to connect two nodes if there is a regulatory relation between them. The KEGG network is represented as an undirected graph with 1668 nodes and 8011 edges (see Figure 1). The yeast regulatory network is also represented as an undirected graph with 688 genes and 1079 edges. Note that the yeast regulatory network is expected to be more reliable than the KEGG network [4].
To simulate the vector of gene statesz, we first choseK pathways among the 33 regulatory pathways and initialized those genes in theK pathways to be relevant genes withzg = 1 and the rest of the genes to be irrelevant, which gave us the initialz0. Then starting withz0, we
performed sampling five times based on the discrete MRF model (3) withγ = 0, η= 2. In this simulation study, we choseK = 5,9 and 17 to obtain different percentages (11.5%,18.9% and 48.7%, respectively) of relevant genes. For a given vector of gene statesz, we then simulated those non-zero coefficients β in the linear models based on the following hierarchical model,
βi|σ2
i, zi = 1∼N(0, v0σ 2
i),
where σ2
i follows an inverse Gamma distribution:
1 σ2 i ∼ d1 0s20 χ2 d0.
The tuning parameters were set as d0/(d0 +di) = 0.5 and s0 = 8, v0 = 2, similar to those
used by Smyth [3]. Finally, for a sample size of 10, the gene expression levelY was simulated from the following linear model,
Yi =Xβi+ǫi,
whereX = (4.0,4.2,4.5,4.8,5.2,5.3,5.6,6.1,6.6,7.0)T is fixed and the error terms for the 10
independent samples were simulated from N(0, σ2
i), where σ
2
is range from 27.87 to 194.20
with a mean of 69.24 (sd=20.33). A similar simulation procedure was used to simulate data on the yeast regulatory network. We chose K = 2,4 and 14 transcriptional modules as initially relevant and iterated to get about 7.88%,11.5% and 47.3% of relevant genes, respectively.
Simulations were repeated 50 times to assess the sensitivity, specificity and the false discovery rates (FDRs) of our proposed network-constrained empirical Bayes procedure (NetEB). We compared our proposed procedure with the results from the ordinaryt−statistics, which does not consider any prior information and the moderated t−statistics, which bor-rows information across genes based on the empirical Bayesian modeling [3]. Table 1 shows the simulation results, where the sensitivity is the average over 50 replications of the per-centage of correctly identified relevant genes; specificity is calculated as the average of the fraction of irrelevant genes correctly identified; and the FDR is the average of the ratio of the
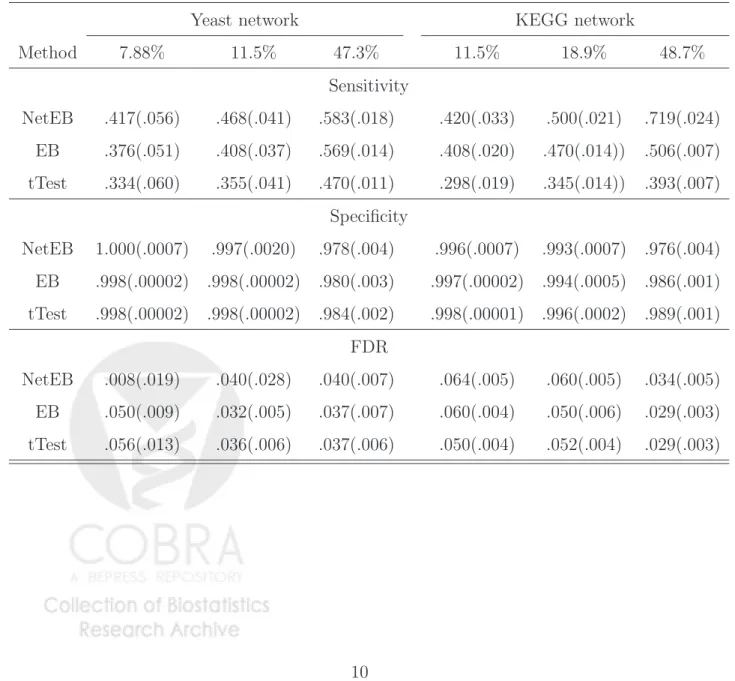
Table 1: Comparison of performance for our proposed network-constrained empirical Bayes method (NetEB), the ordinary t-statistics(tTest) and the empirical Bayes method of Smyth using the moderated t-statistics (EB). The results are based on the 50 simulations and the numbers in parentheses are the standard errors based on 50 simulations.
Yeast network KEGG network
Method 7.88% 11.5% 47.3% 11.5% 18.9% 48.7% Sensitivity NetEB .417(.056) .468(.041) .583(.018) .420(.033) .500(.021) .719(.024) EB .376(.051) .408(.037) .569(.014) .408(.020) .470(.014)) .506(.007) tTest .334(.060) .355(.041) .470(.011) .298(.019) .345(.014)) .393(.007) Specificity NetEB 1.000(.0007) .997(.0020) .978(.004) .996(.0007) .993(.0007) .976(.004) EB .998(.00002) .998(.00002) .980(.003) .997(.00002) .994(.0005) .986(.001) tTest .998(.00002) .998(.00002) .984(.002) .998(.00001) .996(.0002) .989(.001) FDR NetEB .008(.019) .040(.028) .040(.007) .064(.005) .060(.005) .034(.005) EB .050(.009) .032(.005) .037(.007) .060(.004) .050(.006) .029(.003) tTest .056(.013) .036(.006) .037(.006) .050(.004) .052(.004) .029(.003)
number of false discoveries to the number of genes identified as relevant. For the ordinary
t−statistics and moderated t−statistics, we chose the cut-off p-values so that these two pro-cedures have similar FDRs as our proposed procedure. At the same or similar false discovery rates, we observed an increase in sensitivity of our proposed network-constrained empirical Bayes model and that the specificities are in general comparable for the three procedures, and in some scenarios the gain in sensitivities can be substantial. In addition, both empirical Bayes methods resulted in much higher sensitivities than the simple t-tests based on linear regression analysis.
4
Application to Microarray Gene Expression Study
of Human Aging Brain
To demonstrate the proposed methods, we consider the problem of identifying age-dependent molecular modules based on the gene expression data measured in human brains of individu-als of different ages published in Luet al. [9]. In this study, the gene expression levels in the postmortem human frontal cortex were measured using the Affymetrix arrays for 30 individ-uals ranging from 26 to 106 years of age. The R RMA procedure [14] was used to normalize the gene expression data. To identity the aging-regulated genes, Lu et al. [9] performed simple linear regression analysis for each gene with age as a covariate. We analyzed this data set by combining the KEGG regulatory network information with the gene expression data. In particular, we limited our analysis to the genes that can be mapped to the KEGG regulatory work and focused on the problem of identifying the subnetworks of the KEGG regulatory network that are perturbed during the human aging process. The final KEGG network includes 1305 genes.
Using our proposed network-constrained empirical Bayes method, we estimated ˆγ =
−2.15 and ˆη = 0.35 in the Markov random field model, with a positive estimate of the dependency parameter η indicating some regulatory dependency of the genes on the KEGG network. In order to get some idea about the variance of ˆη, we took 100 bootstrap samples of the original data set and obtained 100 estimates of η. Among these 100 bootstrap samples,
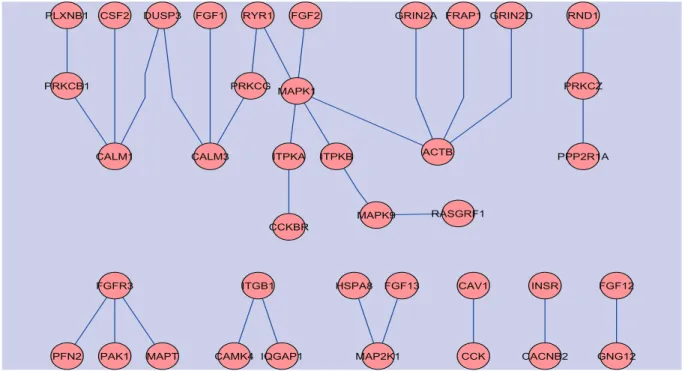
the ICM algorithm did not converge in one bootstrap sample. Among the other 99 bootstrap samples, 28 resulted in an estimate ofηbeing 0, indicating no neighboring dependency. The mean (sd) of the 71 non-zero estimates of η is 1.73 (1.89). These results indicate that the regulatory dependency of genes that are related to aging is real, although it is not too strong. After the convergence of the ICM algorithm, we ran Gibbs sampling 20,000 times to estimate the posterior probabilities of genes on the KEGG network being associated with aging. We identified 61, 46 and 31 genes related to aging using cutoff values of 0.80, 0.90 and 0.95 of the posterior probability, with estimated false discovery rates of 0.063, 0.033 and 0.016, respectively. Using a cutoff of 0.80 of the posterior probability, 39 of the 61 genes identified are connected on the KEGG network with a total of 31 edges (see Figure 2 for these subnetworks). The posterior probabilities of these 39 genes and their respective ranks among the 1305 genes are presented in Table 2. It is interesting to note that fibrob-last growth factors (FGF1, FGF2, FGF12, FGF13) and their receptor (FGFR3) appeared in several of these subnetworks. It has been demonstrated that fibroblast growth factors are associated with many developmental processes including neural induction [15] and are involved in multiple functions including cell proliferation, differentiation, survival and ag-ing [16]. It is also interestag-ing to observe that mitogen-activated protein kinase (MAPK) (MAPK1 and MAPK9) and the specific MAPK kinase (MAP2K) also appeared in several subnetworks. The MAPKs play important roles in induction of apoptosis. Other interesting genes include RAS protein-specific guanine nucleotide-releasing factor 1 (RASGRF1), the functionality of which is highly significant in various contexts of the central nervous sys-tem. In the hippocampus, Rasgrf2 has been shown to interact with the NR2A subunits of NMDARs, triggering Ras-ERK activation and induction of long-term potentiation, a form of neuronal plasticity that contributes to memory storage in the brain [17]. Hayesmoore et al. [18] observed an effect of age on expression of MAPT with a relative decrease in MAPT expression with increased age. Finally, the insulin receptor gene (INSR) is also identified. INSR binds insulin (INS) and regulates energy metabolism. Evidence from model organ-isms, including results from fruit flies [19] and roundworms [20], relates INSR homologues to aging, most likely as part of the GH1/IGF1 axis. These results indicate that our method can indeed recover some biologically interesting molecular modules or KEGG subnetworks
that are related to brain aging in human.
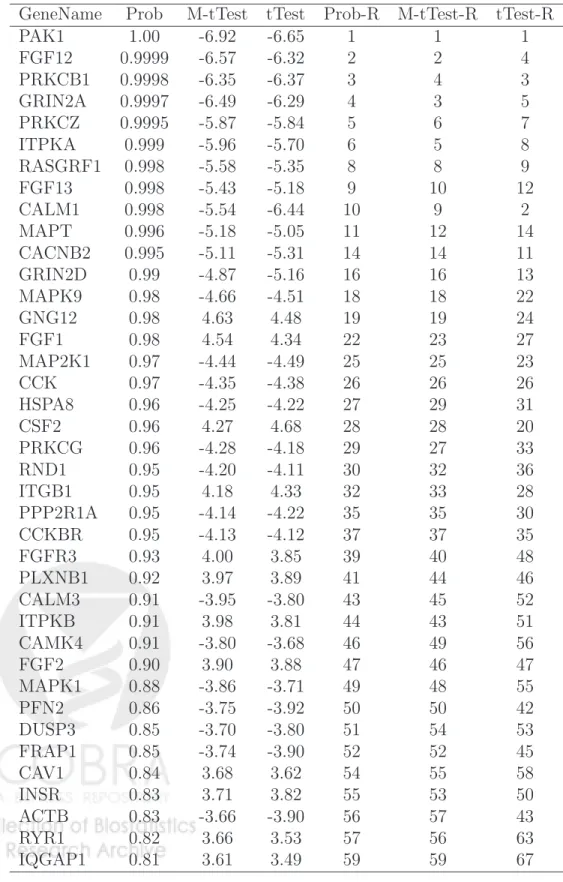
As a comparison, we also present in Table 2 the ordinary t-statistics and the moderated
t-statistics as in Limma and the ranks based on these two statistics for the same 39 genes in Figure 2. While these rankings largely agree among these three statistics, some differences are still observed. This is expected since our estimate of the dependency parameter ˆη= 0.39 is small.
Figure 2: Subnetworks identified by the proposed network-constrained empirical Bayes method for the human brain aging gene expression data of Lu et al. (2004). These subnetworks include 39 of the 61 aging-associated genes with posterior probability of greater than 0.80 estimated by the proposed method.
5
Conclusion and Discussion
With the increase in availability of human regulatory networks and protein interaction net-works, the focus of bioinformatics research has shifted from understanding networks en-coded by model species to understanding the pathways and networks underlying human diseases [4]. In order to incorporate the prior biological network information into the
anal-Table 2: Posterior probabilities based on the proposed method (Prob), moderatedt-statistics based on Limma (M-tTest), ordinaryt-statistics (tTest) and ranks (out of 1503 genes) based on these three statistics (Prob-R, M-tTest-R and tTest-R) for the 39 genes presented in Figure 2.
GeneName Prob M-tTest tTest Prob-R M-tTest-R tTest-R PAK1 1.00 -6.92 -6.65 1 1 1 FGF12 0.9999 -6.57 -6.32 2 2 4 PRKCB1 0.9998 -6.35 -6.37 3 4 3 GRIN2A 0.9997 -6.49 -6.29 4 3 5 PRKCZ 0.9995 -5.87 -5.84 5 6 7 ITPKA 0.999 -5.96 -5.70 6 5 8 RASGRF1 0.998 -5.58 -5.35 8 8 9 FGF13 0.998 -5.43 -5.18 9 10 12 CALM1 0.998 -5.54 -6.44 10 9 2 MAPT 0.996 -5.18 -5.05 11 12 14 CACNB2 0.995 -5.11 -5.31 14 14 11 GRIN2D 0.99 -4.87 -5.16 16 16 13 MAPK9 0.98 -4.66 -4.51 18 18 22 GNG12 0.98 4.63 4.48 19 19 24 FGF1 0.98 4.54 4.34 22 23 27 MAP2K1 0.97 -4.44 -4.49 25 25 23 CCK 0.97 -4.35 -4.38 26 26 26 HSPA8 0.96 -4.25 -4.22 27 29 31 CSF2 0.96 4.27 4.68 28 28 20 PRKCG 0.96 -4.28 -4.18 29 27 33 RND1 0.95 -4.20 -4.11 30 32 36 ITGB1 0.95 4.18 4.33 32 33 28 PPP2R1A 0.95 -4.14 -4.22 35 35 30 CCKBR 0.95 -4.13 -4.12 37 37 35 FGFR3 0.93 4.00 3.85 39 40 48 PLXNB1 0.92 3.97 3.89 41 44 46 CALM3 0.91 -3.95 -3.80 43 45 52 ITPKB 0.91 3.98 3.81 44 43 51 CAMK4 0.91 -3.80 -3.68 46 49 56 FGF2 0.90 3.90 3.88 47 46 47 MAPK1 0.88 -3.86 -3.71 49 48 55 PFN2 0.86 -3.75 -3.92 50 50 42 DUSP3 0.85 -3.70 -3.80 51 54 53 FRAP1 0.85 -3.74 -3.90 52 52 45 CAV1 0.84 3.68 3.62 54 55 58 INSR 0.83 3.71 3.82 55 53 50 ACTB 0.83 -3.66 -3.90 56 57 43 RYR1 0.82 3.66 3.53 57 56 63 IQGAP1 0.81 3.61 3.49 59 59 67
ysis of gene expression data related to human diseases, we have presented in this paper a network-constrained empirical Bayes method for analysis of genomic data. Different from the commonly used empirical Bayes methods for analysis of microarray gene expression data that assume independence among the genes (e.g., Limma), our proposed method imposes dependency among the latent indicator variables using a simple discrete Markov random field model defined on a known regulatory network. We demonstrated the application of the proposed methods in the analysis of human brain aging microarray gene expression data and identified several aging related molecular modules, some with solid biological supports.
We analyzed the aging data set using the KEGG regulatory pathways. However, it should be noted that the proposed methods can be applied to other relevant pathways such as human protein-protein interaction networks [4]. Since our current knowledge of the genetic pathways of humans is still very limited, our proposed method depends on the validity of the regulatory networks used. One limitation of the proposed method is that the gene dependency provided by these prior networks may not be reflected at the gene expression levels. If this is the case, we should expect that the estimate of the dependency parameter η in the MRF model to be small, then the network information will not contribute too much and the results should be similar to the standard empirical Bayes analysis. It would be interesting to test the ideas in this paper on other types of biological networks such as protein-protein interaction networks. Finally, since most of the KEGG pathways are signaling pathways with a path of interactions through protein-protein or protein-DNA interaction networks, the KEGG network is often directed with a direction of information flow and a regulatory influence (activating or repressing). It would be interesting to develop methods that can account for these directions.
Acknowledgments
This research was supported by NIH grants ES009911 and R01 CA127334. We thank Mr. Edmund Weisberg, MS at Penn CCEB for editorial assistance.
References
[1] Efron B, Tibshirani R, Storey JD and Tusher V (2001): Empirical Bayes analysis of a microarray experiment.Journal of the American Statistical Association, 96, 1151 1160.
[2] Lonnstedt I and Speed TP (2002): Replicated microarray data.Statistica Sinica, 12, 3146
[3] Smyth GK (2004): Linear models and empirical Bayes methods for assessing differential expression in microarray experiments.
Statistical Applications in Genetics and Molecular Biology, 3(1), Article 3.
[4] Ideker T and Sharan R (2008): Protein networks in disease.Genome Research, 18: 644-652.
[5] Kanehisa M and Goto S (2002): KEGG: Kyoto encyclopedia of genes and genomes.Nucleic Acids Research, 28: 27-30.
[6] Wei Z and Li H (2007): A Markov random field model for network-based analysis of genomic data.Bioinformatics, 23: 1537-1544.
[7] Wei Z and Li H (2008): A hidden spatial-temporal Markov random field model for network-based analysis of time course gene expression data.Annals of Applied Statistics, 2(1), 408-429.
[8] Wei P and Pan W (2008): Incorporating gene networks into statistical tests for genomic data via a spatially correlated mixture model.Bioinformatics, 24: 404-411.
[9] Lu T, Pan Y, Kao S-Y, Li C, Kohane I, Chan J and Yankner BA (2004): Gene regulation and DNA damage in the ageing human brain.Nature, 429: 883-891.
[10] Besag J (1986): On the statistical analysis of dirty pictures.Journal of Royal Statistical Society B, 48: 259-302.
[11] Besag J (1974). Spatial interaction and the statistical analysis of lattice systems.Journal of the Royal Statistical Society, Series B36, 192-225.
[12] Sun W and Cai T (2008): Large-scale multiple testing under dependency.Journal of the Royal Statistical Society, Series B, in press.
[13] Milo R, Shen-Orr S, Itzkovitz S, Kashtan N, Chklovskii D and Alon U (2002): Network motifs: simple building blocks of complex
networks.Science, 298:824-827.
[14] Irizarry RA, Hobbs B, Collin F, Beazer-Barclay YD, Antonellis KJ, Scherf U and Speed TP (2003): Exploration, Normalization, and Summaries of High Density Oligonucleotide Array Probe Level Data.Biostatistics4: 249-264.
[15] Bottcher RT, Niehrs C (2005): Fibroblast growth factor signaling during early vertebrate development.Endocr. Rev., 26: 6377.
[16] Yeoh JS, de Haan G (2007): Fibroblast growth factors as regulators of stem cell self-renewal and aging.Mech Ageing Dev., 128:17-24.
[17] Tian X, Gotoh T, Tsuji K, Lo EH, Huang S, Feig LA (2004): Developmentally regulated role for Ras-GRFs in coupling NMDA glutamate receptors to Ras, Erk and CREB.EMBO J, 23: 7 -.
[18] Hayesmoore JB, Bray NJ, Cross WC, Owen MJ, O’Donovan MC and Morris HR (2008): The effect of age and the H1c MAPT haplotype on MAPT expression in human brain.Neurobiology of Aging, in press.
[19] Tatar M, Kopelman A, Epstein D, Tu MP, Yin CM, Garofalo RS (2001): A mutant Drosophila insulin receptor homolog that extends life-span and impairs neuroendocrine function.Science, 292:107-110.
[20] Kimura KD, Tissenbaum HA, Liu Y, Ruvkun G (1997): daf-2, an insulin receptor-like gene that regulates longevity and diapause in Caenorhabditis elegans.Science, 277:942-946.