The Open University’s repository of research publications
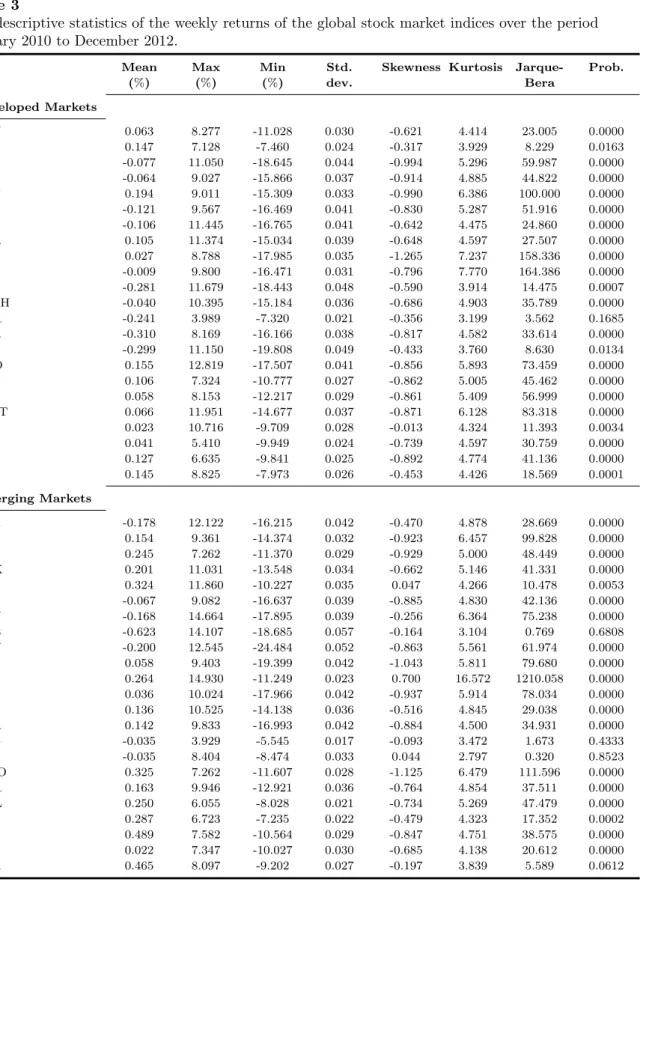
and other research outputs
Personalising Learning
Other
How to cite:
Underwood, Jean; Baguely, Thomas; Banyard, Philip; Dillon, Gayle; Farrington-Flint, Lee; Hayes, Mary; Hick, Peter; LeGeyt, Gabrielle; Murphy, Jamie; Selwood, Ian and Wright, Madeline (2009). Personalising Learning. BECTA.
For guidance on citations see FAQs.
c
2009 BECTA
Version: Version of Record
Link(s) to article on publisher’s website:
http://webarchive.nationalarchives.gov.uk/20110130111510/http://research.becta.org.uk/index.php?section=rh&&catcode= re rp 02&rid=14546
Copyright and Moral Rights for the articles on this site are retained by the individual authors and/or other copyright owners. For more information on Open Research Online’s data policy on reuse of materials please consult the policies page.
Personalising Learning
Nottingham Trent University (NTU)
Jean Underwood
Thomas Baguley, Phil Banyard, Gayle Dillon, Lee Farrington-Flint, Mary Hayes, Peter Hick, Gabrielle Le Geyt, Jamie Murphy, Ian Selwood and Madeline Wright
The research team
Jean Underwood , Project Director, Nottingham Trent University Phil Banyard, Project Manager, Nottingham Trent University
Field researchers
Gayle Dillon, Nottingham Trent University
Lee Farrington-Flint , Nottingham Trent University Gabrielle Le Geyt, Nottingham Trent University Mary Hayes, Consultant
Peter Hick Manchester, Metropolitan University Ian Selwood, The University of Birmingham Madeline Wright, Nottingham Trent University
Mathematical modellers
Thomas Baguley , Nottingham Trent University Jamie Murphy, Nottingham Trent University
The researchers would like to acknowledge the co-operation and support of the staff and pupils of all schools whose work is the subject of this report (see Appendix A for a full list of participating schools).
The research team ... 2
1. Executive summary ... 4
1.1 Revisiting Impact 2007 ... 4
1.2 From the Harnessing Technology Survey data provided by NFER ... 5
1.3 The learning space ... 5
1.4 The teaching space ... 6
1.5 The institutional space ... 7
1.6 Outstanding issues ... 8
1.7 Messages for policy makers ... 8
2. Outline of the Personalising Learning project ... 10
2.1 Background ... 10
2.2 Overarching aims ... 11
2.2.2 Phase 2: Validating the model ... 12
3. Phase 1: Developing a model of the effective use of digital technologies for the personalising of learning ... 13
3.1 The Descriptive Model ... 14
3.2 The learning equation ... 16
3.3 Connecting the descriptive model and the learning equation ... 19
4. Phase 2: Validating the model ... 20
4.1 Collection of field data ... 21
4.2 Testing the model ... 22
4.3 Populating the model ... 24
4.4 Summary ... 40
5. Outstanding issues ... 42
6. Messages for Policy Makers ... 43
References ... 45
Appendix A: List of participating schools ... 47
Appendix B: Response Rates to Research Instruments by School Phase ... 49
Appendix C: Multilevel modelling of the NFER Harnessing Technology Survey data on personalising learning ... 50
1. Executive summary
This report presents the findings of the Personalising Learning project, which was commissioned by Becta.
The core aim of the project is to develop a robust model of the effective use of digital technologies for the personalising of learning. Personalising learning in this context involves the tailoring of pedagogy, curriculum and learning support to meet the needs and aspirations of individual learners irrespective of ability, culture or social status in order to nurture the unique talents of every pupil.
Section 2 of this report outlines the background and aims of this research project. Section 3 traces the development of the model and the accompanying learning equation. The key concept encapsulated in this model is that of overlapping action spaces, school, teaching, personal and living spaces, in which learning occurs. These spaces are populated by the key educational stakeholders: learners, their teachers, their family and peers. In each of these spaces a range of digital technologies is available to support the learner.
Section 4 is a validation of the model using evidence from field research.
Personalising learning
Personalising learning is understood in different ways by managers, teachers and learners. Our analyses confirm the fractured nature of different stakeholders’
understanding of this core educational concept: while both staff and pupils may see the personalising of learning as good practice and a goal to be strived for, pupils often do not recognise staff efforts to deliver on this concept. This perceptual discontinuity can in part be explained by pupils equating personalisation with 'me time' but we also have evidence that some teachers, while accepting the
personalisation agenda, are still operating a controlling model of education.
However, many teachers equate personalising learning with pupil voice and choice. They also link this to the need for a curriculum that engages pupils and for many teachers this is not the National Curriculum.
The process model: The Learning Equation
1.1 Revisiting Impact 2007
A key output from the Impact 2007 study was the relationship between e-maturity of the school, Investment in Learning (IinL) by the pupil and overall school performance on standardised tests. This finding was used to generate the Learning Equation, which states that level of opportunity plus investment predicts the effectiveness of learning undertaken in a school. The finding was based on 2006 performance data. Here we repeated the analysis using 2007 performance data and found that:
a. E-maturity remained an important positive factor in school performance at Key Stage 2.
b. At GCSE level there was a tentative effect showing a potential relationship between learners' perception of personalisation and school performance. The robustness of these relationships will be tested using data at the individual pupil level under the Impact 2008 project.
1.2 From the Harnessing Technology Survey data provided by NFER
i. Teachers in secondary and special schools had similar attitudes, but teachers in primary schools were less likely to agree that ICT had a positive impact on personalising learning. While our own studies show partial support for this finding we also have evidence of primary staff expressing strong support for the use of technology for learning. These disparate findings illustrate the differences between evidence from best practice schools, where primary staff are enthusiastic users of the technology, and the more normative sample of the NFER survey.
ii. As length of service within the profession increased, positive attitudes to the value of ICT for the personalisation of learning decreased: that is, there is an inverse relationship between years of professional experience and teachers’ positive perceptions of ICT for personalising learning.
iii. Teachers tended to be positive about use of ICT to provide personalised learning for older pupils (especially Key Stages 3 and 4) and for particular subgroups within a class. These sub-groups included pupils with special needs, and the gifted and talented. Interestingly boys and girls were seen to benefit to the same extent from their use of ICT.
iv. In schools where the senior management had made personalising of learning a priority, teachers were more likely to perceive the benefits of ICT in moving that agenda forward. This was the case for both new and established staff.
A descriptive model: The model of personalised learning
1.3 The learning space
i. Both at school and at home:
a. There was evidence of learners being given greater flexibility and autonomy over their learning through the use of online formative assessments and curriculum-based activities.
b. It was apparent that to be effective, pupils need to recognise the relative importance of continuous formative assessments and feedback in helping them to set their own learning goals. That is they need to have the skills to effectively invest in their own learning.
c. There has been a shift to supporting work more with visual and non-linguistic auditory media and away from spoken or written output.
d. There has been a shift towards producing outputs that are broadcast beyond the confines of home or school.
ii. For many learners the out-of-school digital world is richly populated and the school digital world often suffers by comparison.
iii. Digital technology is at the centre of learners’ experience of school and personal life. It is aspirational and functional, and is an important way of defining and expressing an individual’s identity. However, learners engage with digital technologies in ways that are only partially recognised and explored by schools.
iv. The mobile phone is ubiquitous at all ages but used little in school.
v. Social networking is central to the digital world of Key Stage 4 pupils but much less so for younger pupils.
vi. While some pupils sought to keep this digital life a private matter, others expressed puzzlement as to why their teachers were not using social networking as a conduit to pupils.
vii. In various forms, gaming was also important to all aspects of these learners’ personal and academic lives. This capacity to motivate has been harnessed by teachers in some schools.
1.4 The teaching space
i. The majority of teachers in this sample have taken on board the Personalising Learning agenda.
ii. Personalisation for these teachers was not perceived as a move to individual learning programmes. For some teachers it was a more global entity while for others individualisation was a logistical impossibility.
iii. Personalisation was seen as something that good teachers already do and have been discussing for decades.
iv. There is a distinction between those teachers who define personalisation by level of pupil choice and those who argue that choice must be an informed action on the part of the pupil.
v. In teachers’ perceptions it is clear that ICT is strongly associated with personalising learning.
vi. Teachers clearly recognise the motivational attributes of digital technologies. vii. There is evidence that digital technologies are transforming pedagogy beyond
the confines of lessons through the use of ICT. An example of such activity is the use of the Question Wall as a discussion forum (see page 38 of this document).
viii. Teachers value technology that is used to provide formative feedback to pupils and parents, arguing that it not only aids informed choice but has a positive impact on pupil behaviour.
ix. A majority of the teachers felt that personalisation of learning is constrained by the National Curriculum. Personalising learning is restricted in light of rather rigid assessment formats. In particular teachers often felt that standardised exams do not fit in with the culture of autonomy over learning and
personalisation.
x. The Digital Divide between learner and teacher remains a concern; teachers seek to adapt to the changing digital landscape, while their charges are immersed in this new world. The Divide will be difficult to eradicate given the pace of technological change. The younger generation will always be at the forefront of technological adoption while their teachers, in general, will lag behind.
1.5 The institutional space
i. The development of e-maturity across both sectors is strong.
ii. Schools have very disparate responses to learners’ digital social networking. While no school operated a casual policy, some managed the activities while others operated a policy of containment or an outright ban on such activity. iii. The use of technology to aid record keeping and assessment is increasingly
embedded into practice and is a direct aid to the personalising of learning. iv. There is a clear trend to provide a greater range of feedback to learners,
teachers and parents. Such feedback encompasses behavioural as well as school performance measures.
v. The use of technology to inform learners, teachers and in some cases parents about a learner’s progress through the school is now increasingly prevalent, although not yet ubiquitous. There are a range of ways in which this facility is provided.
vi. Digital technologies have made the boundaries between school and living space more permeable. There are mixed responses to this.
vii. The nature of digital storage and the transfer in and out of that store can have profound effects on the working methods of both the learner and the teacher. Although the storage of files at the school permits school-wide and personal access, the transfer of files using tools such as memory sticks and email remains problematic and this hinders remote access to files.
1.6 Outstanding issues
i. The Digital Divide between teachers and learners and also parents and their children remains a reality.
ii. We have yet to develop a pedagogy of ICT use.
iii. We have yet to establish the value of learners’ informal learning with digital technologies, including how do we capture the influence of such learning on formal education?
iv. How can we take educational advantage of the ubiquitous mobile phone? v. To what extent should we be concerned about activities such as the use of
social networking sites?
vi. To what extent should we be concerned about the level of monitoring of the learner that is now possible through technology?
vii. How do we maximise the benefits of home-school links through technology while reducing the negative impacts on equity and workloads of learners and teacher?
1.7 Messages for policy makers
i. Alignment:
a. There is a need to create greater alignment between curriculum, assessment and pedagogy for the digital school.
b. In order to bring curriculum, assessment and pedagogy into alignment there is a need to develop:
• a pedagogy for digital technology usage;
• assessments that better measure the shifts in learning activities that accompany effective use of digital technology;
• assessments that clearly capture valuable informal learning of skills and knowledge, particularly those supported with and through digital
Resource levels in terms of hardware are a declining issue. The policy focus needs to move on to the provision of, and also access to, good quality content and to workforce development so as to take advantage of the new resources, particularly in terms of developing pedagogy.
iii. Monitoring of pupils with and through digital technologies.
In order to maximise the potential benefits of monitoring while seeking to reduce less desirable effects there is a need to develop:
a. Guidance for pupils to stimulate the effective use of the increased levels of feedback available with and through technology, to aid learners in self-regulating their learning.
b. Clear guidelines on the monitoring of learners and the sharing of information. iv. There is a need to identify the costs and benefits of increased home-school
links for the developing child and also for disparate groups of learners, including the technology rich and poor.
v. In relation to mobile phones and social networking sites, there is a need to: a. Develop clear guidelines on the use of such technological innovations in order
to maximise educational gain and to minimise unwanted outcomes.
b. Establish whether the policy governing the use of such sites should be one of containment and protection or of enlightened exploration to produce an informed citizen.
c. Establish whether policy should be a national level or articulate the level of regional or local variations that can be tolerated within the system.
2. Outline of the Personalising Learning project
How do schools successfully support the personalising of learning though the use of digital technologies? This research is part of an interlinked group of projects which include The Harnessing Technology Schools Survey, Becta Impact 2008 and Personalising Learning - The Learner Perspective. It also draws on the work undertaken for Impact 2007.
The Personalising Learning project was commissioned by Becta. The aims of this project were to first develop a model of the effective use of digital technologies for the personalising of learning and then to test the relevance of that model by capturing the rich picture of contextual inter-relationship of factors that create a school delivering the core personalisation agenda. This includes the depth of learners’ knowledge of and skills in the use of innovative digital technologies.
2.1 Background
There are many ways that digital technologies can support the learner. In the Impact 2007 report (Underwood et al., 2008) we found two trends: the rise of the learner as not only recipient but also shaper of the educational experience, and the growth in the range and availability of user-centred, mobile digital technologies. The synergy between these two developments has the potential to extend the range of and access to learning experiences with the possibility of delivering the curriculum in more imaginative and flexible ways. However, digital technologies do not in and of themselves lead to a more personalised learning experience. Indeed Impact 2007 showed a complex relationship between the e-maturity of a school and the degree to which a more personalised agenda was perceived by pupils to be operating in their schools. The teasing apart of this relationship is a core aim of the Impact 2008 project; also commissioned by Becta.
For the Department of Education and Skills (DfES, 2006),
"Personalisation is the key to tackling the persistent achievement gaps between different social and ethnic groups. It means a tailored education for every child and young person, that gives them strength in the basics, stretches their
aspirations, and builds their life chances. It will create opportunity for every child, regardless of their background."
This is not just a matter of readjustments to curricula or pedagogic practice, important though these maybe, but requires a shift in the social dynamics and practices of all partners including learners (see Pollard & James, 2004). Under this definition personalisation is a desirable state which should be available to all pupils, giving them a degree of autonomy and ownership of their learning but within the local and national educational framework from which core learning goals emerge.
The Gilbert Review of Teaching and Learning in 2020 (Gilbert et al., 2006) took this further arguing that there is a need to ensure that personalised learning is a reality in every classroom and the report sets out a vision for how teaching and learning should develop between now and 2020. Thus the personalising agenda is about providing opportunities for the learner, which the latter may or may nor avail
themselves of as was demonstrated in the Impact 2007 research (see Underwood et al., 2008). While seemingly a rather passive view of personalisation, this
conceptualisation does not preclude, and indeed would encourage, the development of learning environments in which learners can shape their experience of working in diverse locations, with diverse groups and cultures while monitoring their own learning.
Green et al. (2005) argue that the Gilbert Review vision and the challenges posed by the Personalising Learning agenda may prove difficult to meet without digital
technologies as there will be a specific requirement for “the communication,
archiving and multimedia affordances of digital resources” (Green et al., 2005 p. 5). The need to identify and evaluate the role of digital technologies in supporting a more personalised learning experience is stimulated both by concerns about the performance of the current educational system but also an awareness that many learners today are already creating personalised learning environments for themselves outside school using digital resources. For most young people, technology is part of their daily lives. Those young people with access to digital technologies are already using these resources to tailor their informal learning to their own interests. However, we have consistently found some 10 per cent of young people living in homes that are not technology enriched
A central goal of the Personalising Learning project is the provision of a rich picture of potentially significant factors that will allow the effective personalising of learning, with and through technologies, to take place.
2.2 Overarching aims
The Personalising Learning project runs for six months. This research has two overarching goals encapsulated in first a design and then a testing phase. Phase 1 focuses on model production and Phase 2 tests the model in a sample of e-mature schools. A third Phase or activity, a further test of the model, requires the team at Nottingham Trent University to extend our analyses to the data captured under Becta Research 1: The Harnessing Technology Schools Survey. In detail the key goals were:
2.2.1 Phase 1: Design of the model
In order to design the model presented here we have conducted a wide-ranging review of literature, projects and implementations to capture a picture of the current effective use of digital technologies for the personalising of learning. We have drawn on materials in the public domain as well as detailed classroom observations
conducted under Impact 2007 (Underwood et al., 2008) and earlier work from the Broadband Project (Underwood et al., 2005).
2.2.2 Phase 2: Validating the model
We have identified a corpus of 30 schools in which to test the validity of the model generated in Phase 1. The key outcome here is a robust dynamic empirical model of excellent practice that will adapt to new opportunities. We have also investigated how the projected plans of these schools do or do not fit the model, as this will indicate how the model may need to evolve overtime. We have used the data collected during the research to populate the model. The full model offers guidance on the facilitators and barriers to personalising learning through digital technologies. In addition we have also questioned the model using a sub-set of the NFER
Harnessing Technology Schools Survey (R1) data. Specifically we have conducted a meta-level analysis of the data to identify underlying themes and patterns pertaining to the impact of high-quality personalised learning experience with digital
3. Phase 1: Developing a model of the effective use of digital
technologies for the personalising of learning
The model is expressed in two forms. Firstly as a description of the interrelationships between core actors (the institution, the staff and the learner) and the functional space which they inhabit (Figure 1). Secondly, a formal representation of those relationships is encapsulated in a core equation, with related sub-equations each of which are testable, given the availability of appropriate data (Figure 2). This equation stems directly from the research undertaken for Impact 2007.
A number of assumptions underpin this model:
i. The educational process is a dynamic system governed by a complex set of interrelationships.
ii. Learning occurs both in informal as well as formal settings and, after a period in the Twentieth Century when formal education dominated, the rise of digital learning spaces has rebalanced the importance of informal versus formal learning. Learners increasingly acquire not only ‘street’ knowledge but also ‘academic’ knowledge from outside of the classroom. In particular their
technological world is likely to be richer outside the school than it is inside the school. As a result they have access to a range of resources and
functionalities that allow for new ways of learning. These technological skills and new ways of learning can then be brought into the school and formal learning.
iii. Technological advancements such as simulations, virtual reality and multi-agent systems have been not only a stimulus but also a driver of a more flexible and social conceptualisation of learning. This is captured in the moves towards just-in-time learning, constructivism, student-centred and
collaborative learning.
iv. A fourth assumption is that across the educational space there is the potential for children to take on multiple roles, which may include learner, mentor, tutor and in some cases assessor. Equally the teacher or tutor is also a learner in some contexts. While parents and guardians have their central role they are also tutors and learners. Each of these roles is important, as is evidenced from the Test Bed Project (Underwood, Dillon & Twining, 2007) where
teachers’ skills development was shown to be an important positive correlate of school performance. In contrast, Lim et al., (2006) has reported reduced usage of technology by pupils in classes where the teacher was
uncomfortable with technology.
This model is an overarching model of how the learning takes place – it might be viewed as subsuming more specific models such as that of Salmon’s (2000, 2002)
five-stage model of e-learning. Salmon charts how the learner becomes
'acclimatised' to online environments with an emphasis on the interaction of the learner and the environment. The model presented here, however, steps away from such specifics. It is a predictive model which examines what the learner, teachers and significant others bring to the learning space and the nature of that space - whether formal or informal, virtual or real. The prime goal is to assess the impact of these multiple factors on the learning and behavioural outcomes.
3.1 The Descriptive Model
Returning to the Descriptive Model there have been three iterations to date. In the first iteration the nested model views the learners’ experience as being structured by the teachers, who are themselves working with and contributing to the culture of the school. However, on reflection, it is more helpful to consider the personal learning space that the learner occupies rather than the learner himself or herself. Put simply, the personal learning space is the space in which learning takes place. This has some obvious physical characteristics but crucially it also refers to the cognitive space in which the learner operates. In the same way, it is helpful to consider the teaching space rather than the teacher. The teaching space includes the physical environment of the classroom and the cognitive structures that generate the learning environment.
In the third and current iteration of the Model (Figure 1) the space beyond the school also becomes significant. This living space provides a further input to the learning space and teaching space. Teachers create some of their teaching materials outside the school using resources that might not be available within the school. They might also belong to networks of teachers from other schools who are sharing good
practice. Similarly, the learners’ personal learning space is not limited to the school. They might have access to other technical resources and social resources outside the school.
The second level of description captures the characteristics of the participants and also of the technologies. In this sense the affordances of the technology introduce further enhancements, such as the capacity to support group dynamics.
The living space that most commonly provides support for learning is the home, but opportunities for learning go much further than this. With regard to the home, the affordances of digital technologies create a reciprocal traffic with the school so that just as the school can now be in the living room, the people in the living room can look into and affect the school. Digital technologies have helped blur distinctions between work and play and now with increasing links between school and home they are also blurring the distinctions between leisure and learning.
Figure 1: Model of Personalising of Learning
In the Model, the first level of description focuses on four educational spaces: the school environment including aspects such as culture and affluence of the institution; the teaching space; the personal learning space and the living space. While pupils as learners find a natural home in the personal learning space, the research evidence shows they are becoming more active in the teaching space. Teachers of course necessarily occupy the teaching space but they also occupy the learning space as they seek to develop their pedagogic and out-of-school skills. The Model clearly underscores the importance of out-of-school spaces both for the acts of teaching and learning and also for those pupils and teachers, or indeed parents, as learners. Some teachers also contribute to the school space in their leadership or technology roles.
At first glance the nested model of educational spaces hides a discontinuity. Are the spaces closed or open? How permeable are the barriers between the spaces? How much of the infrastructure and strategy developed at school level is appropriate to the needs of teachers in the learning space? How much of the structure of the learning space maps onto the understandings and skills of learners in their learning space? In previous research (Underwood et al. 2007) and in this current research the responses of managers, teachers and learners do not share the same
perspective on the personalising of learning, although all groups acknowledge technology has an important role in supporting the personalisation agenda. Aligning the perceptions from the different spaces is key to the delivery of the Harnessing Technology agenda.
The second level of description captures the characteristics of the participants and also of the technologies. In this sense, the affordances of such technologies, for example their capacity to support group dynamics, create new opportunities for influencing how learning takes places. At this level the model also captures the behavioural and psychological characteristics that are key to the delivery of personalised learning. Space in this model is partly defined by its physical
characteristics and technical specifications. It is only fully understood by considering how people behave in that space and how they think about that space. A paved square can be a piazza if people are sitting at tables drinking coffee or it can be a parade ground if soldiers are marching on it.
3.2 The learning equation
The top level learning equation (Figure 2) emerged from the analyses undertaken for Impact 2007, which found links between e-maturity and higher school performance, as well as greater IinL. Here, IinL was constructed from a range of factors including learners’ work ethos, self-efficacy, motivation, engagement and overt behaviour. These two variables had a positive and additive effect on the school performance levels. Schools where pupils showed low IinL, performed less well on national tests than those where pupils were engaged with their learning. This finding was
ameliorated by the level of e-maturity. So schools, with high e-maturity but low IinL outperformed those schools with both low e-maturity and low IinL. Schools with both high e-maturity and high pupil IinL outperformed fellow institutions on a range of national tests.
Figure 2: The Learning Equation
l as ducational environment, for example from technology enrichment,
a ising of
o engage with the game. Here, opportunity for a more interactive and personalised
Our investigations into the impact of increased levels of personalising learning showed a more complex picture. Personalising learning did not always relate to improved performance, particularly in high-performing schools. While personalisation did not necessarily require ICT, where the Personalising Learning agenda and well established e-maturity occurred together, there was a synergy which had beneficial effects. However, the findings showed strong individual learner differences as wel the disparities between schools, indicating that some pupils were gaining greater benefits from the e
than their peers.
So while e-maturity, IinL and personalising learning have been shown to have positive influence on performance and behaviour at school level, it cannot be assumed that this impact is the same for all pupils. In particular, the personal learning may be good for the majority but not for a significant minority of, for example, very able or very disaffected pupils. This finding is supported by the literature on the value of online role-playing games. Squire (2004) extended intervention using Civilization III, an historical simulation, resulting in a mixed reaction from US high school pupils. While 25 per cent of the pupils (particularly academic underachievers) were highly motivated to learn history through the game, and considered the experience a highlight of their school year, a further 25 per cent of pupils opted to go to the book club rather than make the mental effort required t
learning experience was rejected by pupils with low self-efficacy but eagerly assimilated by independent-minded learners (Figure 3).
Figure 3: Example of the interaction between opportunity and Investment in Learning
mplify ed it
ich is
erspectives’, led us to exclude this factor from the top level equation Kay and Knaack (2008) augment the argument against ‘one size fits all’ when considering responses to technology. They found significant individual differences in responses to learning objects or interactive web-based tools that enhance, a
and guide the cognitive processes of the learner. From their sample of 850 secondary school pupils, those more comfortable with the technology appreciat more, although performance was unaffected; older pupils (year 12) were more positive about the technology than their younger peers (years 9 and 10). Such differences across individuals and groups can result in conflicting findings wh why learner level data is so critical for the development of effective policies. Impact 2008 has been commissioned by Becta to clarify the impact of increased personalising of learning. This report is due in autumn 2008. However, a lack of clarity about the ‘nature and role of the personalisation when viewed from different stakeholder p
3.3 Connecting the descriptive model and the learning equation
Each of the top level variables, both the independent (or predicative) variables (Opportunity and Investment), and the dependent variable (Effective Learning) can be further unpacked and linked to educational spaces identified in the model. These spaces are identified as school, teaching space, learning space and living space.
What does it look like?
l resources particularly with ivides researched and responded to
learner as active partners in the process.
arning space 1
Opportunity: School level
• ICT available and accessible
• ICT integrated into the whole curriculum
• Increasing functionality, cohesion and sharing of records
• Increasing synergy between educational culture and ethos at home and school
• Increasing synergy between home and schoo regard to technology
• Digital d
Teaching space
• Potentialities of ICT explored and developed
• Increasing differentiation of assessment to fit learner achievements
• Increasing choice of modes of working
• Increasing acceptance of the teacher and learning
Learning space
• Increasing learner input to the design of learning space
• Informal learning acknowledged and accredited
• Assessments developed that better accredit the learning taking place in the le
Living space
• Increasing synergy between home and school educational culture and ethos
1
The most common form of assessment is still a written test carried out using pen and paper or online but still using a similar format of questions. The learning in a personalised and technologically rich environment allows for the development of creativity, visual presentations, oral presentations, group work, multi-source research, drafting and editing, among many skills. These skills are not captured in the high-stakes tests and so much of the rich learning of the child remains unaccredited.
• Increasing synergy between home and school resources particularly with to technology
ng becomes seen as a central part of living
s
tasks
nsferable to other tasks
tcome?
ing self-worth and engagement with the
te the
s
he model using a range of qualitative and quantitative field data. Sources of data included a range of nationally-held information on a sample of nominally high
e used survey, interview, focus group and regard
• Learni
Investment: What does it look like? Learner space
COGNITIVE
• lls of self-regulation
Challenge is embraced rather than avoided Increasing ski
•
• Increasing effective working practice AFFECTIVE
• Increasing acceptance of responsibility for their own learning
• Learning is valued and sought after
Effective learning: What does it look like? • Learners are engaged with their studies
• Learners are doing challenging but manageable
• Achievement is valued and acknowledged by the learner and the teacher
• Learners are increasing their skills of critical thinking and problem solving
• Learners are developing skills of self-regulation
• Learning is tra
• Learning is relevant to the learner and their situation and personal learning goals
What is the ou
The outcome is a Virtuous Circle of increas
educational process leading to positive behaviours and improving educational performance.
4. Phase 2: Validating the model
• An array of both qualitative and quantitative data were used to valida models
Phase 2 of the project required us to validate the model described above. We have endeavoured to do this in two ways. Firstly, by formally testing the assertion
inherent in the model using standard statistical techniques, and secondly by evidencing t
observational data that tapped into the knowledge and perceptions of leaders, staf and pupils.
4.1 Collection of field data
Sample: Table 4.1 shows the distribution of the 30 sample schools by sector size and social advantage. All of the schools were initially deemed to be e-mature although subsequent tests showed there was a wide range from moderate to very high e-maturity. Social advantage was measured by the descriptor of the school location not by school catchment area and
f
as such is a rough guide to school affluence. While the distribution of schools by sector and size is close to parity, we note that smaller secondary schools (fewer
in socially disadvan s wh ols van are
almost all large (1,000 pupils and more).
tics Primary Small <300 N=7 Primary Large 300+ N=8 Secondary Small <1000 N=8 Secondary Large 1000+ N=7
than 1,000 pupils) are over represented ile the scho
taged area in socially ad taged areas
Characteris Socially 4 4 advantaged 2 6 Socially disadvantaged 3 4 6 1
Table 4.1: Sample Schools by Sector, Size and Social Advantage
Unsurprisingly, there was a moderate correlation between the proportion of statemented children in any one primary school and the measure of social
schools re
ider
on between the proportion of
es from lessons (n=15; r=+0.67;
r,
30 head teachers and ICT tutors and 150 classroom disadvantage (n=15; r=+0.55; p<0.05) but this did not hold for secondary
(n=15; r=+0.11; n.s.). The discrepancy is probably due to the fact that the measu of social advantage based on school location is less sound when applied to the w catchment areas of secondary schools.
At the secondary level there was a correlati statemented children in any school and absenc
p<0.01). While the primary schools showed a similar trend it was not statistically significant (n=15; r=+0.37; n.s.).
Research instruments and procedures
Each of the schools provided access to the head teacher or a senior staff membe to the tutor in charge of ICT and also to one focus group of classroom teachers and at least one focus group of pupils (Key Stages 1, 2, 3, and 4). This provided
responses from a maximum of
teachers. Pupil responses were more difficult to calculate but a guide of 5 pupils present in the target focus group and with two groups per school we have a
projected target sample of 300 primary and 300 secondary pupils. Response rates are provided in Appendix B.
The contextual data relating to e-maturity and personalising of learning required detailed responses from key members of each institution’s staff, namely the head or member of the senior management team and the tutor responsible for ICT. For this we used an e-survey, the maturity model for heads and an ICT co-ordinator
questionnaire. We conducted telephone or face-to-face interviews with each target iate. These research instruments were essentially the same as
ht-as ce illon & Twining, 2007). Further, communication has been transformed through the Internet giving rise to
ays comfortable with (Banyard, Underwood, & Twiner, 2006).
o the learning process. of digital technologies was assessed by group
tured discussion involving both the pupils and the researcher.
4.
individual as appropr
those used for Impact 2007 (Underwood et al., 2008) and so will not be discussed in full in this report. However, the use of focus groups was an innovation and requires a fuller description and justification.
The focus groups
The current generation of pupils is able to work with technologies in ways unthoug of by even their elder siblings. The Test Bed project has shown children as young five years of age happily working with digital cameras and editing photos to produ their own web pages, while in the secondary sector pupils are producing home movies and composing and recording music (Underwood, D
weblogs, YouTube, GoogleVideo, MySpace, Facebook and Bebo. As Green and Hannon (2007) point out, pupils are connecting, exchanging and creating in new ways; ways which their parents and teachers are certainly less adept and not alw
A key question for this project is 'How to capture the depth of learners’ knowledge of and skills in their use of innovative digital technologies?' This information forms part of the richer picture of what the individual learner brings t
The pupils’ understanding
categorisation of cards representing key examples of the technology (see Appendix D for details of the stimuli). This card sorting activity was a stimulus to a struc
2 Testing the model
• The Learning Equation developed under Impact 2007 was partially validated.
• The NFER data showed some enthusiasm among teachers for personalising learning using ICT, but this was tempered by years of service and age phase.
4.2.1 Revisiting the impact 2007 data
As a first test of our models we elected to revisit the Impact 2007 primary school data and remodel the output using the 2007 Key Stage 2 and GCSE data. The purpose of this analysis was to establish whether the predictor variables of school performance, as evidenced in the Learning Equation (Figure 2) remained valid. Within the constraints of the data it was established that the rate of change in Key Stage 2 school performance from 2006 to 2007 was predicted by e-maturity (Beta = 0.41), giving an adjusted R2 = 0.21 (F3,22 = 3.20; p < 0.05). This finding is a partia validation of the Learning Equation (Figure 2) and once again establishes the potential positive role of technology as a
l stimulus for school performance at primary
l through NFER Harnessing Technology Survey data
r older children (particularly Key Stage 3
4) nd of had
t al.,
in the Test Bed and Broadband projects ls. level.
A similar analysis completed for secondary GCSE data was less revealing. Although the rate of change in school performance from 2006 to 2007 showed a weak trend for pupils’ perception of personalisation and school performance (r18=0.368; p = 0.1).
4.2.2 Testing the mode
The Harnessing Technology: School Survey 2008 is a large survey on the use and impact of ICT in schools. This analysis focussed on a small subset of these data most relevant to personalising learning. A more detailed description of the survey and the statistical modelling of the survey data may be found in Appendix C. The analysis reported here focuses on teacher attitude to the impact of ICT on
personalising learning.
Overall attitudes to the impact of ICT on personalising learning were very positive. The impact was considered more positive fo
and 4 relative to Key Stage 1 and 2) and for selected subgroups of children: notably able, gifted or talented children and children with special educational needs.
Attitudes also varied somewhat between different categories of school. Teachers in special schools and secondary schools were more positive than those in primary schools.
The Impact 2007 (Underwood et al., 2008) and early Test Bed (Somekh et al., 200 data do show this greater variation across primary schools. However, by the e the Test Bed (Underwood, Dillon & Twining, 2007) when primary teachers become immersed in the project and for the Broadband project (Underwood e 2005) which selected best practice schools, primary and secondary schools performed at a level. The disparity in these findings is a reflection of the samples. The NFER sample was non-selective but
School priorities (identified in the Harnessing Technology School Leader questionnaire) also influenced teacher attitudes. Teachers in schools where
personalising learning was identified as a high priority were more positive about the impact of ICT on personalising learning.
ges ories more likely to agree pact on personalising learning than to disagree.
e model of personalising learning ch
ecognition that monitoring of the learner can provide feedback to the learner and the parent as well as to the teacher.
ing to the as
ater es not necessarily equate to overall levels of use, particularly when considering large-scale
ols
ew
visual Attitudes also varied between teachers. Teachers with longer duration of
professional experience had less positive attitudes than teachers in the early sta of their careers. However, it should be noted that even the least positive categ of teacher (eg experienced primary school teachers) were much
that ICT has a positive im
4.3 Populating the model
We turn now to an evaluation of our descriptiv
which focuses on the interrelationships between behavioural and technology aracteristics as they operate within identified activity spaces.
4.3.1 The digital space
• Preference for generic versus content based software.
• Increased focus of multi-modality.
• Growing r
We asked the teachers and pupils in our focus groups to identify the key software used in their schools. The teachers often interpreted this request as referr
delivery medium, the virtual learning environment (VLE) or a podcast, rather than a request to identify specific software per se. Nevertheless some interesting patterns emerged.
Both primary and secondary respondents - teachers and pupils - referred to gre variety of generic as compared to specific software. While this do
programmes of work for mathematics, the pattern of general tool as opposed to specific content support does appear to be a reliable finding. Named content
software was largely focused on mathematics and to a lesser extent on English and a modern foreign language, however, content was acquired through generic to also. The use of educational repositories in the form of the VLE or commercial resources in part explains the seeming lack of content software.
Predictably, and as has been the pattern for ICT over the last few years, software for word processing, drawing and data handling form the basic toolkit. However, a n trend of support for a wider range of sensory modalities is clear at both primary and secondary level. For example, natural language (modality) is being conveyed
there are differences in the packages across the age range, the focus on story boarding, digital images both still and moving, all linked to sound is a shift in student skills and outputs. The concepts of presenting, publishing or broadcasting to an
condary s of the
gy
mith imilar. Feedback to teachers through record keeping and monitoring software, essentially the
ystem, was widespread but in a number of cases
le. Such feedback d
views on matters related to the operation of any one school.
4.3.2 The learner space
rs.
oadcast and
f
• Learn ow s tica ren f tec gy a potentialities.
An analysis of the responses from the learner focus groups is presented in this s total 82 cus gr s were ducted nd repo d on (1 2, 23, 20 at Key Stages 1, 2, 3, 4 respectively; see Table 4.2). The focus group activities
included a brief questionnaire, card sorting tasks and group discussion.
audience is a corollary of this development, as is demonstrated by a number of our schools’ websites. The move to podcasts, blogs and wikis, particularly at se
level is an extension of these activities. While this has been taken up with enthusiasm in some schools there are those who are resistant to these use technology. A resistance confirmed in the interim report Harnessing Technolo 2008 Survey (Smith & Rudd, 2008).
A final interesting pattern to emerge is the use of software providing feedback. S and Rudd (2008) found some 60 per cent of their sample of teachers used technology for assessment and the findings here are not diss
Management Information S
feedback to pupils, and in a few cases to parents, was also availab
is part of the move from giving pupils choice to ensuring that that decisions an actions are based on informed choice. This use of the technology was largely a secondary phenomenon, as was the use of software to gather parental and pupil
• Learners at KS1 have a rich experience of technology.
• Social networking is central to the world of KS3 and KS4 learne
• Key Stage 4 learners are using technology to communicate, br express their identity.
• Learners see their homes as the main source of technological opportunities.
• Large variation is experienced in the privacy and security policies o schools.
ers sh ophis ted awa ess o hnolo nd its
KS 1 KS 2 All Prim KS 3 KS 4 All Sec Free Sort 15 22 37 23 20 43 Favourites Sort 4 10 14 7 6 13 Frequency Sort 5 6 11 3 9 12 Where Used Sort 6 6 12 5 5 10
Table 4.2: Number of focus groups completing each sort by Key Stage
Card Sorting: While all focus groups conducted a free sort with the pupils selectin how to group the cards, fewer pupils re-sorted the cards
g using specified categories
t were ype,
nd s accordingly. Additional items also
responses to some free sorts as hree such items (CBeebies, Club Penguin
e
the rt
an items that were used and items that were
recognised. The Kappa analysis of frequencies of use showed that there was a measure of agreement in pupils’ use of technology at both primary and secondary
gest this reflects the such as ‘Sort by location of use – Home, Home & School, School’. The following analysis collates a summary of these data.
The card sorts included 33 cards but subsequent analysis identified cards tha redundant or did not provide a consistent response from the focus groups. Sk Virtual World, Snapfish, 4oD, World of Warcraft, and the Scanner were excluded a these were removed from further analyse
emerged from the student questionnaires and salient to the pupils’ technological world. T
and Miniclip Games) have been added to the analysis to reflect the responses of th learners and a further item has been changed (Bebo replaced Facebook) as the more salient social networking site among the sample.
A cluster analysis revealed that some items were frequently grouped together in free sorts. For example, children often created the category “Phones” in the free so and included in this category the Camera Phone, PDA and SMS Messaging. Therefore, these common items were merged together to create a new item encompassing the functionalities of the individuals. This gave a revised list of 23 items in the sort analyses (Appendix D).
The technological world of the learner
Data were used from the card sorts of favourites and of frequency of use, and the questionnaire responses to develop a representation of the technological world of the child. It was evident that we could make a distinction between items that were important feature of learners’ lives,
tendency for some Key Stage 1 and 2 pupils to respond positively if they have sim heard of the item whereas others proved to be more discriminating. 2
These analyses were used to populate Figure 4, which represents the digital wor the learner. The centre of each e
ply
ld of llipsis represents the centre of the learner’s digital world and the outer layers represent less important aspects of that world. The items
ss of cal
liar with a wide range of technology and have experience of it at home and at school. At the centre of their world are
At Key Stage 2 there is an evident step change as technology becomes more
ore open sites such as Bebo, and CBeebies is replaced by general television channels. The console based games slip from their central position. The most striking change, however, is the central position for instant messaging.
By Key Stage 4 the learner is immersed in a rich technological world. At the centre of this world are the communication facilities, and pupils described how at home they keep open screens to instant messaging, social networking and email sites while at the same time texting their friends. Ownership of the devices and use of the facilities are used as expressions of identity. The technology is an important part in the
development of independent and private lives for these learners.
outside of the ellipsis are either never used by the pupils, or they lack awarene them. Ellipses were created for each Key Stage to demonstrate the technologi transition through the Key Stages.
At Key Stage 1 learners are already very fami
games, television and, perhaps less obviously, a simple social network facility. However, messaging and communicating through digital means are outside the world of these learners entirely.
important and more used. The learners are starting to have regular access to portable devices such as laptops and handheld games and they are using the facilities to respond to their own agendas through search engines such as Google. Social networking is still limited at this stage.
At Key Stage 3 the simple networking facility is replaced by the m
2
Primary frequency sort: k(N = 23, k = 11, m = 3) = .15, z = 6.75, p < 0.001 Secondary frequency sort: k(N = 23, k = 12, m = 3) = .25, z = 9.63, p < 0.001
Figure 4: The digital world of the learner at Key Stage 1 to 4
Further analyses of the card sorts and the other responses allowed us to represent the learner’s experience of school and home. Kappa analysis of frequencies of use showed that there was a measure of agreement in pupils’ use of technology at both primary and secondary level .3
These analyses were used to populate Figure 5 which represents the digital world of the learner. Items that were rarely or never used were excluded from the analysis. While we found differences in technology use at primary and secondary level (Figure 4) there were few differences between the two age groups when discussing where the ICT sits within the overlapping home and school spaces. This shows that the younger children had a similar awareness of digital technologies, although they selected not to be involved with such activities as digital social networking. In both cases, their technological worlds are rich. There is a similar overlap at both ages between home and school, though it was clear from comments in the focus groups that many learners believed they had access to better specification kit at home than they did at school. The main reading from this data is that learners see their homes as the main source of technological opportunities. One caveat to this finding is that the fieldworkers did not explore access to specialised educational software and devices such as specialist music and science equipment, which may have been found in a number of the schools.
3
Figure 5: Home and school digital spaces
The technology walkthrough
In addition to student focus groups, pupils’ use of school PC’s was demonstrated to the researcher during a technology walkthrough. Pupils were asked to log on to a school PC, then to show the researcher what they would usually do once logged on. Prompt questions and extra questions were provided if needed. Of the pupils that
took part in the technology walkthrough, 11 provided responses to the prompt questions, 4 of these also responded to the extra questions.
Pupils were first asked where they store their work when they have used ICT in class. Both primary and secondary pupils identified “My Documents” or a shared class folder on their PC’s hard drive as the most common storage space, followed by memory sticks, email, and, to a lesser extent CD’s and PDAs. A common theme emerging from this data was that pupils in Key Stage 3 and 4 were more often given a personal user name and password for more secure storage, whereas the younger pupils shared communal PC space. Some pupils mentioned that they use a memory stick, but were not allowed to use them at school (see Figure 6).
Figure 6: How Learners Store their Digital Outputs
Pupils were asked about access to resources, in particular the software/ website resources they can access at school and at home. Communication applications were blocked in most schools including MSN Messenger, Facebook, MySpace, Hotmail and "websites with message boards". Other blocked websites and applications included games and music websites, YouTube and some internet searches. One student reported that an educational website was blocked at her school
(http://www.coolmath4kids.com). Pupils were able to access most resources at home if they had Internet access, however some pupils reported that they could not access
their class folder at home and one reported a languages activity programme that they used at school was not available from home.
The pupils here reported a similar range of software as those reported by the focus groups (section 4.3.1) but they also went on to report the websites they visited most often at school. Responses commonly included educational websites such as the school’s website along with more commercial websites (http://www.learnthings.co.uk, Google, http://www.mymaths.co.uk, http://www.linguascope.com, BBC Schools, http://www.headlinehistory.co.uk), and communications/social networking websites (Facebook, MySpace, MSN Messenger, Bebo, chatrooms).
The three groups who responded to the question; does your teacher tell you how to do your work, indicated that teacher involvement was limited to suggestions about software to use. One secondary group responded that most of the time they worked independently. There was a mixed response to whether there was choice of learning tools with two groups indicating they selected whether to use digital or traditional tools but one reported that no choice was allowed and that pen and paper was the norm. Two groups of pupils indicated that were allowed to hand in work electronically or on paper, with one of these able to do an online test with immediate feedback. The remaining two groups were not given a choice and had to hand in a print out of their work, or hand in their homework book.
Some pupils were given the opportunity to show their best work on their school website, but this depended on accessibility. Otherwise it was displayed in their books.
ICT as a part of identity
We explored the uses pupils made of technology and which pieces of ICT were vital in their lives (Figures 7). In the former case we asked what activities they undertook using digital technology and in the latter case pupils were asked to name up to three pieces of technology that were their ‘must haves’. Pupils were very astute and often chose multi-function hardware such as a mobile phone with camera to ensure all their needs were met. The two graphs together show that leisure activities take pride of place. Social networking, accessing music and to a lesser extent videos, gaming and surfing the net are integral to pupils’ lives and are supported by key technology such as their mobile phone, computer and game playing machines. The use of
technology to support their schoolwork did feature but was less apparent than leisure activities.
0 10 20 30 40 50 60 70 80 Comm unic ating Gam ing Liste ning to music Surfi ng t he ne t Cre ating/ look ing a t pr ofile s Wa tchi ng video s Home work Yout ube Using paint Inte rnet s hopping Dow nloading Editi ng p ictur es Programm ing "An ythi ng" Misc Activity F requenc y o f se le ct io n
Student choice of ICT
0 10 20 30 40 50 60 70 80 Mobil e Com puter Gam es co nsole MP 3 pl ayer Lapt op TV Handh eld ga mes Inter net Cam era MS N iPhon e PDA Power poin t/word We bcam CD play er Misc
Item of ICT selected
F
req
ue
ncy of sel
ection
Figure 7: Linking Technology and Activity in Learners’ Digital Worlds.
Even primary aged students seemed aware that their time with technology offered an avenue to independence, with an opportunity to develop their secret (or
independent) lives. There were several comments about sites that their parents or teachers would not know about or maybe understand. The unknowingness of adults
The savvy students and empowered citizens
The argument that the younger generation must be rescued from the clutches of digital technologies is loudly voiced and while there are worrying examples of abuse and misuse of technology, are pupils really in need of being rescued? For many working in the field there is a growing acceptance that, as Southwell and Doyle (2004) have argued the answer cannot be a simple yes or no. While Becta’s
CitizenCard Voice 2007 Cardholder (learner) Survey (Becta internal report) provides disturbing evidence of the net generation being overly cavalier with personal data, there are savvy pupils with a full understanding of the importance of protecting data. This was evident in discussions with a mixed group of year 9 pupils.
"These pupils had a good understanding of some of the issues relating to Internet use, citing for example, inherent dangers in using social networking sites like Facebook in comparison to using MSN messenger, which they all seemed to use regularly. They were fully aware that such sites were not private and their details could be accessed by unfamiliar adults, which they found threatening. They also recognised the potential for cyber bullying and the possibility of their identity being compromised now and in the future. MSN messenger was a preferred method of contact outside school as it is a direct and exclusive link between you and the person you had invited to chat with you. Whilst there were no gender differences in pupils’ overt response to Facebook, both boys and girls were aware of the issues hence chose not to use Facebook; however it was the girls who were most concerned and who felt most vulnerable." (Secondary, Key Stage 3)
This awareness raises pupils to the level of discerning consumers rather than naïve victims; this was also apparent in some pupils’ attitudes toward their data files. Across the focus groups a number of pupils identified their data stick as a ‘must have’ tool. Their reasons for this were generally pragmatic; the stick allowed ease of transfer between home and school, so was great for homework, and file sharing between friends.
"However, one Year 9 pupil pointed out that he favoured the data stick because ‘school can’t steal it’ –‘ it’ in this case being his data. He could bring material to and from school without it being tracked, thus maintaining his privacy and
independence. This made the data stick preferable to the VLE, which had echoes of ‘big brother’ in this young man’s eyes." (Secondary, Key Stage 3)
4.3.3 The teaching space
• Teachers have taken on board the Personalising Learning agenda.
• Teachers perceive ICT as strongly associated with personalising learning.
• Digital technologies are transforming pedagogy beyond lessons with ICT.
• Personalisation of learning is constrained by the National Curriculum.
The personalising of learning: what does it mean?
Preliminary data analyses confirms the fractured nature of the understanding of this core educational concept; while both staff and pupils may see personalisation of learning as good practice and a goal to be strived for, pupils often do not recognise staff efforts to deliver on this concept. This perceptual discontinuity can in part be explained by pupils equating personalisation with ‘me time’ but we also have evidence that some teachers, while accepting the personalisation agenda, are still operating a controlling model of education.
That said many of our teachers equated personalisation with pupil voice and choice. They also linked this to the need for a curriculum that engaged pupils and for many this was not the National Curriculum.
"The teachers were particularly clear that personalisation was not individualisation – targeting every child’s individual needs because this is unrealistic. It’s a more rounded approach.” (Primary, school wide)
"Personalisation was seen as something that good teachers had been actively involved in for decades. The key issues are meeting individual needs and offering differentiated learning programmes. The problem with the rhetoric around
Personalising Learning is that it implies that each child should have an individual learning programme and this is not possible in a class of 35 children." (Primary, school wide)
"This is a whole school approach: all staff need to be on board and have
ownership and understanding of the philosophy and ethos to ensure continuity, consistency and progression throughout the school. The importance of giving children ownership and independence over their learning including reflective practices, tracking learning and working within purposeful learning environments. We should value childrens’ theories by planning from their questioning. We work collaboratively in teams to ensure that all staff and children reach their full
potential. We develop our practices so that they reflect our philosophy in terms of standards, independence and behaviour." (Primary, school wide)
"P-learning is a two way process (between student and teacher), not something you can just ‘do to kids’, they have to be involved in it too.” (Secondary, school wide)
"Needs to be student led more than teacher led. Teacher has an idea of where they want the student to go, but leave choices and decisions of what they need to know to the children." (Secondary, school wide)
While the NFER Pilot Omnibus Survey – June 2007 indicated that there was a greater probability of members of senior management focusing on the need to
were very aware of the need for such engagement. This awareness is demonstrated by the growing use of technology not only to provide pupil choice but to ensure that choices made are informed (refer to Section 4.3.1).
How might the technology help?
Digital technology was seen as a central support for a more personalised learning experience but the nature of that support can differ greatly. At the start of one teacher focus group discussion at a large secondary school a teacher began by proposing an analogy that the others debated. He suggested that personalising learning was like a canteen – there are many choices that have already been prepared, and there are a few rules about choice, but it is possible to select from anywhere to create a personal meal. The others in his group argued that you could do that in a library and ICT was more powerful than just choice or even
differentiation. They agreed that diagnostic activities were important to the
personalisation process; the pupils have to do the activities, the teachers mark the outcomes, and tell them what to do next.
For some schools the technology is being used to provide detailed feedback to pupils, staff and parents. Such feedback, not just on academic performance but also behaviour, supports pupils in their attempts to self-regulate their learning:
"At one secondary school SAM Learning and personalisation by pieces schemes foster group activities, independent learning and encourages pupils to present and discuss work in a positive way. The personalisation by pieces scheme is fairly new but allows pupils to set their own goals, find evidence to build skill sets and are assessed by mentors and other peers (two years above them) from other parts of the country." (Secondary, school wide)
The motivational power of technology is clearly recognised by teachers:
"ICT enthuses and excites children; electronic tasks seem more exciting and stimulating in many cases. Although a good mix of computer activities and practical activities works best."
Class one pupils had the choice of five activities which used different methods to teach the children how to sound individual phonemes (eg ‘U’ & ‘M’). Four out of Five of these activities used technology to reinforce learning and to make it fun and varied (not rote learning).
• PCs and Practice: The area was like a circuit course for the children to rotate and change activities when they liked. Technology therefore, was being used to provide a variety of learning opportunities within a multisensory learning environment. The diversity appeared to sustain interest among the class one pupils and the choice of activities allowed the children to practice the areas most needed (eg letter identification/ tracing /sounding).