Durham E-Theses
Dierences in Returns to Education: An Analysis of
Gender In Indonesia
GUNAWAN, EDDY
How to cite:
GUNAWAN, EDDY (2015) Dierences in Returns to Education: An Analysis of Gender In Indonesia , Durham theses, Durham University. Available at Durham E-Theses Online:
http://etheses.dur.ac.uk/11207/ Use policy
The full-text may be used and/or reproduced, and given to third parties in any format or medium, without prior permission or charge, for personal research or study, educational, or not-for-prot purposes provided that:
• a full bibliographic reference is made to the original source
• alinkis made to the metadata record in Durham E-Theses
• the full-text is not changed in any way
The full-text must not be sold in any format or medium without the formal permission of the copyright holders. Please consult thefull Durham E-Theses policyfor further details.
Academic Support Oce, Durham University, University Oce, Old Elvet, Durham DH1 3HP e-mail: [email protected] Tel: +44 0191 334 6107
http://etheses.dur.ac.uk
DIFFERENCES IN RETURNS TO EDUCATION:
AN ANALYSIS OF GENDER IN INDONESIA
Eddy Gunawan
A thesis submitted to Durham University in fulfilment of the requirements for
the degree of Doctor of Philosophy in Economics
DURHAM UNIVERSITY BUSINESS SCHOOL
DURHAM UNIVERSITY
ii
ABSTRACT
DIFFERENCES IN RETURNS TO EDUCATION:
AN ANALYSIS OF GENDER IN INDONESIA
By Eddy Gunawan
This thesis aims to investigate the earnings differential between males and females in Indonesia. This research also seeks to determine whether the female work force obtains extra benefit in terms of wage earnings on the basis of better education, marital status, working experience, residential location and region. The data used in this study come from the 1989, 1999 and 2009 Indonesian National Labour Force Surveys (SAKERNAS) on households. In order to investigate the gender earnings differential, Oaxaca’s (1973) decomposition method is employed. The result shows that the estimated coefficients of education variables are generally higher for females than for males. These results highlight that the effect of education on earnings increases as educational level advances. The return to university education is higher than all other levels of education, whereas sub-primary education has the lowest rate of return to education for male and female workers. The gender gap decomposition results suggest that favouritism towards men exists in the Indonesian labour market. The discrimination component is quite high, which clearly indicates the existence of discrimination in the Indonesian labour market. The results reveal that the degree of discrimination is still quite significant against females in all regions in Indonesia. Among factors that influence gender wage gap and discrimination in the country, education was found to be more important in influencing the earnings of females than males. The returns from education were relatively higher for females in all regions.
iii
TABLE OF CONTENTS
ABSTRACT ... ii
TABLE OF CONTENTS ... iii
TABLE OF FIGURES ... viii
LIST OF TABLES ... ix
ABBREVIATIONS AND ACRONYMS ... xii
DECLARATION ... xiv STATEMENT OF COPYRIGHT ... xv ACKNOWLEDGEMENTS ... xvi DEDICATION ... xvii CHAPTER I ... 1 INTRODUCTION ... 1 1.1 Introduction ... 1 1.2 Research Background... 3
1.3 Motivation of the Study ... 6
1.4 The Main Research Gaps ... 7
1.5 Research Questions ... 9
1.6 Significant Contributions ... 9
1.7 Structure of the Thesis ... 11
1.8 Conclusion ... 13
CHAPTER 2 ... 15
THE EDUCATION SYSTEM IN INDONESIA ... 15
2.1 Introduction ... 15
2.2 National Education System ... 16
2.3 Old Order Period (1945-1965) ... 19
iv
2.5 Reformation Period (1999-Present) ... 23
2.6 Trend in Education Enrolment ... 27
2.7 Financing of Education in Indonesia ... 30
2.8 Conclusion ... 36
CHAPTER 3 ... 38
THE PROFILE OF THE INDONESIAN LABOUR MARKET ... 38
3.1 Introduction ... 38
3.2 The Structure of the Indonesian Economy ... 38
3.3 Labour Market Conditions ... 41
3.4 Characteristics of the Indonesian Labour Force... 44
3.4.1 Labour Force by Age Group ... 44
3.4.2 Labour Force by Level of Education ... 46
3.4.3 Labour Force by Main Employment ... 47
3.4.4 Labour Force by Residential Location ... 50
3.4.5 Labour Force by Employment Status ... 51
3.4.6 Labour Force by Working Hours ... 55
3.4.7 Labour Force by Income Level ... 56
3.5 The Level and Rate of Unemployment ... 61
3.5.1 Concept and Definition of Unemployment ... 61
3.5.2 Policies and Unemployment Solution ... 62
3.5.3 Unemployment by Category ... 63 3.5.4 Unemployment by Region ... 63 3.5.5 Unemployment by Gender ... 65 3.5.6 Unemployment by Education ... 67 3.6 Conclusion ... 68 CHAPTER 4 ... 70 LITERATURE REVIEW ... 70 4.1 Introduction ... 70
4.2 Education as Human Capital ... 71
4.3 Rate of Return to Education ... 80
4.4 Gender Discrimination and Earnings Differential ... 90
4.5 Gender Discrimination and Earnings Differentials in Indonesia ... 94
v
CHAPTER 5 ... 112
THE DATA ... 112
5.1 Introduction ... 112
5.2 The Concept of the Data ... 112
5.3 Data Collection Methodology ... 116
5.4 Sources of Data ... 117
5.5 The Data Sample ... 118
5.6 Data Sample Description... 119
5.6.1 Labour Force Location: Urban-Rural... 119
5.6.2 Labour Population Age ... 121
5.6.3 Marital Status ... 123 5.6.4 School Participation ... 125 5.6.5 Educational Attainment ... 127 5.6.6 Main Activity ... 129 5.6.7 Main Industry ... 131 5.6.8 Type of Occupation ... 133 5.6.9 Employment Status ... 134
5.6.10 Number of Working Days ... 135
5.6.11 Number of Working Hours ... 136
5.6.12 Amount of Working Experience ... 138
5.6.13 Average Monthly Earnings ... 139
5.7 Conclusion ... 141
CHAPTER 6 ... 142
RATES OF RETURN TO EDUCATION ... 142
6.1 Introduction ... 142
6.2 Research Methodology and Model Specification ... 142
6.3 Data Descriptive Analysis ... 148
6.4 Differences in Returns to Education ... 151
6.5 Returns to Education by Experience ... 163
6.6 Returns to Education by Residential Location ... 163
6.7 Conclusion ... 173
vi
REGION, WAGES AND EDUCATION... 174
7.1 Introduction ... 174
7.3 Territorial Differences across Region ... 177
7.4 Overview and Descriptive Statistics of the Indonesian Regions ... 179
7.5 Regional Estimates of Earnings Function ... 191
7.5.1Earnings Equation Estimates in Sumatera ... 193
7.5.2Earnings Equation Estimates in Java ... 197
7.5.3Earnings Equation Estimates in Lesser Sunda Islands ... 200
7.5.4Earnings Equation Estimates in Kalimantan ... 202
7.5.5Earnings Equation Estimates in Sulawesi ... 205
7.5.6Earnings Equation Estimates in Maluku ... 207
7.5.7Earnings Equation Estimates in Papua ... 209
7.6 Conclusion ... 212
CHAPTER 8 ... 214
GENDER DISCRIMINATION AND THE EARNINGS DIFFERENTIAL ... 214
8.1 Introduction ... 214
8.2 Theories of Labour Market Discrimination and Gender Earnings Differential .... 216
8.3 Gender Earnings Decomposition Method ... 219
8.4 Description of the Data ... 226
8.5 Decomposition of Earnings Differentials... 232
8.6 Conclusion ... 244
CHAPTER 9 ... 246
REGIONAL GENDER DISCRIMINATION AND ... 246
EARNINGS DIFFERENTIALS ... 246
9.1 Introduction ... 246
9.2 Gender Discrimination and Earnings Differential in Sumatera ... 247
9.3 Gender Discrimination and Earnings Differential in Java ... 251
9.4 Gender Discrimination and Earnings Differential in the Lesser Sunda Islands.... 254
9.5 Gender Discrimination and Earnings Differential in Kalimantan... 257
9.6 Gender Discrimination and Earnings Differential in Sulawesi ... 260
9.7 Gender Discrimination and Earnings Differential in Maluku ... 263
vii
9.9 Regional Gender Earnings Differential and Discrimination in Indonesia ... 267
9.10 Ethnicity and Religion Diversity of Indonesia ... 272
9.10.1 Ethnicity ... 272 9.10.2 Religion ... 276 9.11 Conclusion ... 279 CHAPTER 10 ... 281 CONCLUSION ... 281 10.1 Introduction ... 281 10.2 Research Summary... 281
10.3 Implications of the Study ... 286
10.4 Limitations of the Study ... 287
10.5 Recommendations for Future Research ... 288
BIBLIOGRAPHY ... 290
APPENDICES ... 305
Appendix 1: Questionnaire Sakernas 1989 ... 305
Appendix 2: Questionnaire Sakernas 1999 ... 309
viii
TABLE OF FIGURES
Figure 2. 1: School System in Indonesia ... 17
Figure 2. 2: Education System in Indonesia... 18
Figure 2. 3: Primary Education Enrolment ... 28
Figure 2. 4: Secondary Education Enrolment ... 29
Figure 2. 5: Tertiary education ... 30
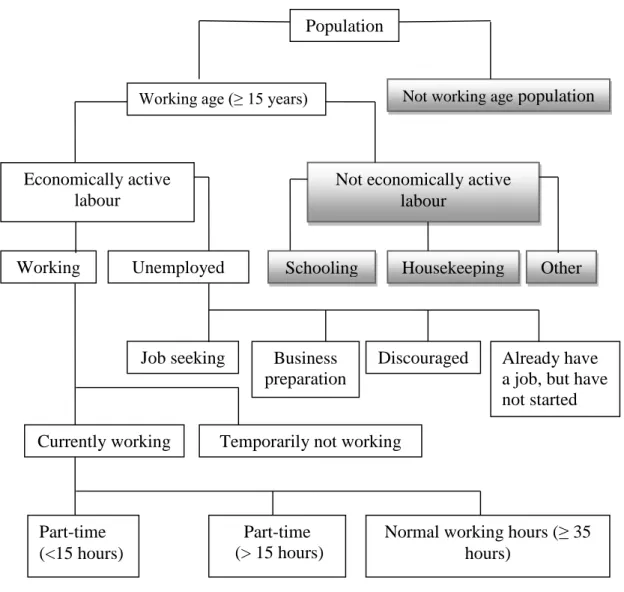
Figure 3. 1: Employment Diagram ... 43
Figure 3. 2: Percentage of Employment in Agricultural Sector ... 48
Figure 3. 3: Percentage of Employment in Industry Sector ... 49
Figure 3. 4: Percentage of Employment in Service Sector ... 49
Figure 3. 5: Unemployment Rate by Gender (Percentages) ... 65
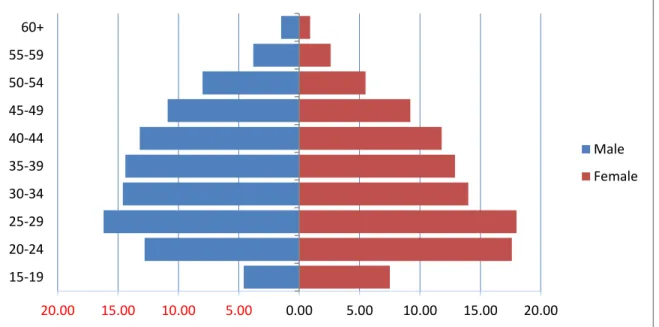
Figure 3. 6: Pyramid of Unemployment Rate by Age and Gender (2010) ... 66
Figure 5. 1: Urban – Rural ... 120
Figure 5. 2: Labour Age Category ... 122
Figure 5. 3: Marital Status ... 124
Figure 5. 4: School Participation ... 126
Figure 7. 1: Map of Indonesia by Region ... 183 Figure 9. 1: Percentage of Gender Hourly Wage Gap across Regions in Indonesia, 2009268
ix
LIST OF TABLES
Table 2. 1: Number of Primary and Junior High Schools in Indonesia, 1971-1980. ... 23
Table 2. 2: Primary Education Enrolment ... 27
Table 2. 3: Secondary Education ... 28
Table 2. 4: Tertiary education Enrolment ... 30
Table 3. 1: Percentage of Population 15 Years and Over Who Worked According to Main Employment ... 40
Table 3. 2: Population 15 years of Age and Over by Type of Activity ... 44
Table 3. 3: Labour Force by Age Groups ... 45
Table 3. 4: Percentage of Labour Force with Level of Education ... 46
Table 3. 5: Labour Force by Residential Area. ... 51
Table 3. 6: Labour Force by Employment Status ... 53
Table 3. 7: Informal activities definition... 54
Table 3. 8: Labour Force by Working Hours ... 56
Table 3. 9: Real Monthly Average Wage/Salary of Employee by Residential Location and Education (Rupiahs) – Index (2010=100) ... 57
Table 3. 10: Real Monthly Average Wage/Salary of Employee by Sex and Education (Rupiahs) - Index (2010=100) ... 58
Table 3. 11: Real Monthly Average Wage/Salary of Employee by Sex and Main Employment (Rupiahs) - Index (2010=100) ... 59
Table 3. 12: Real Monthly Average Wage/Salary of Employee by Sex and Region (Rupiahs) – Index (2010=100) ... 60
Table 3. 13: Unemployment Level by Category ... 63
Table 3. 14: Unemployment by Region ... 64
Table 3. 15: Unemployment Rate by Age and Gender (Percentages) ... 66
Table 3. 16: Unemployment Rate by Education (Percent) ... 68
Table 4. 1: Trends of Educational Attainment of the Total Population Aged 15 and Over by Region ... 77
Table 4. 2: List of Literature Reviewed ... 107
Table 5. 1: Total Sample of Sakernas Data ... 118
Table 5. 2: Number and Percentage of Sample Data by Gender and Residential Location. ... 119
Table 5. 3: Urban – Rural ... 120
Table 5. 4: Average Age ... 121
Table 5. 5: Labour Age Category ... 122
Table 5. 6: Marital Status ... 123
Table 5. 7: Average Age of Marriage by Area and Sex, Indonesia, 1992-2005 ... 125
Table 5. 8: School Participation ... 125
Table 5. 9: Educational Attainment ... 128
Table 5. 10: Main Activity ... 130
Table 5. 11: Main Industry ... 132
x
Table 5. 13: Number of Working Days ... 135
Table 5. 14: Average Working Hours ... 136
Table 5. 15: Number of Working Hours ... 137
Table 5. 16: Working Experience ... 138
Table 5. 17: Average Monthly Wages (Indonesian Rupiah)... 140
Table 6. 1: Average Wage Recipients for Indonesian National Labour Force Survey ... 148
Table 6. 2: Minimum Wage, Average Wage and Productivity, 1988-1994. ... 149
Table 6. 3: Earnings Equation Estimates by Gender, 1989-2009. ... 153
Table 6. 4: Earnings Equation Estimates, by Gender, 1989-2009. ... 158
Table 6. 5: Earnings Equation Estimates, by Gender, 1989... 159
Table 6. 6: Earnings Equation Estimates, by Gender, 1999... 161
Table 6. 7: Earnings Equation Estimates, by Gender, 2009... 162
Table 6. 8: Earnings Equation Estimates, by Residential Location, 1989-2009. ... 168
Table 6. 9: Earnings Equation Estimates, by Residential Location and Gender, 1989-2009. ... 169
Table 7. 1: Mainland Area and Population by Region ... 178
Table 7. 2: Percentages of Indonesian Population by Region (1980-2010) ... 185
Table 7. 3: Distribution of Gross Regional Domestic Product at Current Market Prices by Regions (2004-2009) ... 187
Table 7. 4: Human Development Index (HDI) by Province, 1999-2009 ... 188
Table 7. 5: School Attainment by Region, 1999-2009... 189
Table 7. 6: Number of Estimated Variables in Wage Equation, 1989, 1999 and 2009. . 192
Table 7. 7: Regression Results on Earnings Equation in Sumatera ... 195
Table 7. 8: Regression Results on Earnings Equation in Java ... 198
Table 7. 9: Regression Results on Earnings Equation in Lesser Sunda Islands ... 201
Table 7. 10: Regression Results on Earnings Equation in Kalimantan... 204
Table 7. 11: Regression Results on Earnings Equation in Sulawesi ... 206
Table 7. 12: Regression Results on Earnings Equation in Maluku ... 208
Table 7. 13: Regression Results on Earnings Equation in Papua ... 210
Table 8. 1: Descriptive Statistics by Gender, 1989-2009. ... 228
Table 8. 2: Main Industries by Gender, 1989-2009. ... 229
Table 8. 3: Main Occupation by Gender, 1999-2009. ... 231
Table 8. 4: Decomposition of Log Earning Differentials, 1989. ... 233
Table 8. 5: Decomposition of Log Earning Differentials, 1999. ... 236
Table 8. 6: Decomposition of Log Earning Differentials, 2009. ... 239
Table 9. 1: Earnings Differential in Sumatera. ... 247
Table 9. 2: Earnings Differential in Java. ... 251
Table 9. 3: Number of Population Aged 15 Years and Over Who Worked by Industrial Origin and Sex in Bali Province, 2010. ... 255
Table 9. 4: Earnings Differential in Lesser Sunda Islands. ... 256
Table 9. 5: Earnings Differential in Kalimantan. ... 258
Table 9. 6: Earnings Differential in Sulawesi ... 261
xi
Table 9. 8: Earnings Differential in Papua. ... 266 Table 9. 9: Total and Percentage of Population by Ethnic Group ... 275 Table 9. 10: Population by Region and Religion ... 278
xii
ABBREVIATIONS AND ACRONYMS
ASEAN Association of Southeast Asian Nations
ASTEK Asuransi Sosial Tenaga Kerja, (Worker Social Security)
APBN Anggaran Pendapatan dan BelanjaNegara (Indonesian State Budget)
BOS Bantuan Operasional Sekolah (School Operating Assistance)
BPS Badan Pusat Statistik (Statistics Indonesia)
BSNP Badan Standar Nasional Pendidikan (Board of National Standard of Education)
CIDA Canada International Development Assistance CDC Competency-Based Curriculum
CSIS Centre for Strategic and International Studies
DAU Dana Alokasi Umum (General Allocation Fund)
DAK Dana Alokasi Khusus (Special Allocation Fund)
DGSE Directorate General of Secondary Education DGHE Directorate General of Higher Education DIPI_II Diploma I_II
DIPIII Diploma III
EEO Equal Employment Opportunity FDI Foreign Direct Investment GAP Gender Analysis Pathways GDP Gross Domestic Product GER Gross Enrolment Ratios
GRDP Gross Regional Domestic Product
HDI Human Development Index
HMA10 Household Member Above ten years old HMB10 Household Member Below ten years old
IDR Indonesian Rupiah
IFLS Indonesia Family Life Survey ILO International Labour Organization
ISCO International Standard Classification of Occupation ISIC International Standard Industrial Classification ICSI Industry Classification in Statistics Indonesia INPRES Instruksi Presiden (the Instruction of the President) JAMSOSTEK Jaminan Sosial Tenaga Kerja
JHS Junior High School
JML Joint Maximum Likelihood
KTSP Kurikulum Tingkat Satuan Pendidikan (School-Based curriculum) LDC Less Developed Countries
LFPR Labour Force Participation Rate
LFS Labour Force Survey
LSI Lesser Sunda Islands
xiii MoNE Ministry of National Education
MoMT Ministry of Manpower and Transmigration MoRA Ministry of Religious Affairs
NER Net Enrolment Ratios
NLSY National Longitudinal Survey of Youth
NS No Schooling
NTB Nusa Tenggara Barat (West Nusa Tenggara)
OECD Organization for Economic Co-operation and Development OLS Ordinary Least Square
PRIM Primary School
PELITA Pembangunan Lima Tahun (Five Years Development)
REPELITA Rencana Pembangunan Lima Tahun (Five Years Development Plan)
Rp. Rupiah (Indonesian currency unit)
SAKERNAS Survei Tenaga Kerja Nasional (National Labour Force Survey) SDO Subsidi Daerah Autonom (Subsidy for Autonomous Region)
SHS Senior High school
SLTA Sekolah Lanjutan Atas (Senior Secondary High School)
SMA Sekolah Menengah Atas (Senior High School)
SMK Sekolah Menengah Kejuruan (Vocational School)
SUB-PRIM Sub-primary Schooling
SUPAS Survei Penduduk Antar Sensus (Intercensal Population Survey) SUSENAS Survei Sosial Ekonomi Nasional (National Socioeconomic Survey) UMR Upah Minimum Regional (Regional Minimum Wage)
UNDP United Nations Development Programme
UNESCO United Nations Educational, Scientific and Cultural Organization
UNI University
UNFPA United Nations Population Fund USA United States of America
USD United States Dollar
UU Undang – Undang (Law)
VJSH Vocational Junior High School
VOC Vereenigde Oost-Indische Compagnie
VSHS Vocational Senior High School WSS Worker Social Security
xiv
DECLARATION
I hereby declare that the materials contained in this thesis have not been previously submitted for a degree in this or any other university. I further declare that this thesis is solely based on my own research.
xv
STATEMENT OF COPYRIGHT
The copyright of this thesis rests with the author. No quotation from it should be published without prior written consent, and information derived from it should be acknowledged.
xvi
ACKNOWLEDGEMENTS
I am immensely grateful to Allah, the creator and the most merciful, who has shown His greatest blessing by enabling me to complete this work. It is only because of His love that I have been able to face the difficulties and problems that arose during my study. I wish to express my sincere thanks to the following persons who made this thesis possible. I would first like to thank Dr Martin Robson and Professor John Ashworth who together supervised me throughout the course of this research. Dr Robson took a deep interest in the project from the beginning and was very insightful and critical in reviewing the chapters of this thesis. Professor Ashworth always read my work promptly and gave very constructive feedback for further improvement. Thank you for refining my thesis and correcting the linguistic errors that I often made.
I also owe a great deal of thanks and appreciation to the academic and administrative staff of Durham Business School for their support and assistance. Furthermore, I would like to thank all my colleagues studying in Durham for their support during my studies, especially Uda Rifki, Uni Dian, Mas Farid and Uni Rahma for their prayers and willingness to help me finish my thesis, Mas Erwin and Mbak Indah for their keen support in helping me finish my work, and Mas Sigit and Manzoor Ahmed who helped me to work with statistical methods. I also want to thank all of my Malaysian friends, especially Amiruddin Muhamed and family, for the help and support they gave to my family members during my stay in Durham.
I am also grateful to my employer, the Syiah Kuala University in Banda Aceh, Indonesia, for giving me the opportunity to pursue my doctorate program at Durham University. Moreover, I would like to express my thanks for the continuous support and encouragement from the University's Rector, the Dean of the Faculty of Economics, the Head of the Economics Department, and all their administrative and academic colleagues. I am also grateful to Aceh Human Resources Development Institution (LPSDMA) for its financial support.
Finally, I greatly thank my beloved father who passed away in my final year of my study, my late mother, my dear parents-in-law, my sisters and brothers, and all my relatives, too numerous to name individually, for their endless prayers and moral support during my studies. I would like to send very special thanks to Elly Wardani, my beloved wife, for her patience and suffering during my studies in Durham. It was due to her spirit alone that I was able to finish this work. My lovely daughter, Sahira, my little hero, Daniel, and Shareef who was born at the end of my study, your presence in England fortified me and helped me to solve all the problems I encountered during my studies.
xvii
DEDICATION
To my late mother for her sacrifice; to my late father for his lifelong support; to my beloved wife, Elly Wardani and to our dear children, Sahira, Daniel and Shareef for their continuous love.
1
CHAPTER I
INTRODUCTION
1.1 Introduction
Education is seen as an important determinant in a nation’s efforts to increase its wealth (Smith, 1776) and people are an important part of the wealth of nations (Schultz, 1961). In labour economics, education is considered an investment in human capital, and it is often more important than investment in non-human capital (Schultz, 1961). Human capital embraces the notion that individuals acquire skills and knowledge to increase their value in the labour market. Experience, training and education are the three main mechanisms for acquiring human capital, with education being primary for the majority of people (Mincer, 1974). Education facilitates the acquisition of new skills and knowledge that help in increasing productivity. This increase in productivity makes resources available to create new technologies, new businesses and more wealth, eventually enhancing economic growth (Smith, 1776).
Since the beginning of modern economics, education has been considered an essential value in increasing the wealth of a nation (Smith, 1776). Plato said that education has high value in an economy; therefore a large part of the community’s wealth should be invested in it (Kneller, 1968). Plato went on to argue that education is the right of all people; hence, education is often considered a basic human right. Therefore, to a certain extent, education should be freely available to everyone. Nowadays, most countries provide free basic education to all their citizens. In almost all human societies, human resources are valued as an important asset. Thus, they have become the main factor in economies’ efforts to achieve sustainable economic growth, development and social welfare (Barro, 2001). Human resources can be achieved through formal education, and
2
vocational and professional training (Mincer, 1974). Formal education usually starts from primary school and continues up to university level. Generally, formal education contributes significantly to economic growth and development (Psacharopoulos, 1981 and Barro, 2001). Higher levels of education, training and skills create human capital, significantly raise personal income, and enhance national economic growth. There is a consensus among economists such as Smith (1776), Mincer and Becker (1974) that formal education is an important determinant of individuals’ earnings as well as economic growth. Therefore, increasing workers’ years of schooling, training and experience has a considerable impact on people’s earnings.
Since the late 1950s, various scholars and economists such as Mincer, Becker, Schultz, Blinder and Oaxaca have made serious attempts to determine the return to education. Likewise, the importance of investment in human capital and its effect on earnings has gained in importance since the 1960s. Since the seminal lecture by Schultz in 1961 on the topic of ‘Investment in Human Capital’ delivered to the American Economic Association, this field has become more interesting to economists. Blaug (1987), for example, took an interest after reading Schultz’s paper. Schultz (1961), one of the pioneers in this field, considered investment in human capital to be more important than physical investment, including factory buildings and employee housing, machinery and equipment, and inventories (raw materials, semi-finished goods and finished goods). According to Schultz, investment in human capital can be measured by the increase in national output that results from productivity of the land, longer working hours and more efficient use of physical capital. The differences in human capital occur because of people’s increased skill and knowledge. Therefore, investment in this sector is considered a potential element of the wealth of a nation (Schultz, 1960).
Since the 1960s, many researchers have contributed to the large body of knowledge on investment in human capital and the return to education. For example,
3
Becker (1962, 1964) studied the rate of return to high school and college education in the United States. Mincer (1974) developed the wage earnings function where the number of years of schooling and experience determine the worker’s earnings. Similarly, Psacharopoulos (1973, 1981, 1994 and 2004) estimated and compared rates of return to education in developed and developing countries. Behrman and Deolalikar (1991, 1993 and 1995) estimated the rate of return to different levels of education for Indonesian workers and compared the earnings differential between males and females.
1.2 Research Background
In the global economy and the age of information technology, education is a passport to obtain better job opportunities and improved quality of life. The demand for education increases with the further demand for a more capable labour force in the labour market especially in the developing countries (Psacharopoulos, 1981). However, it could be an issue in those countries because modern education systems are still young and illiteracy rates are high compared to developed or highly industrialised nations.
According to the World Bank (2012b), the definition of a developing country is “one in which the majority lives on far less money—with far fewer basic public services—than the population in highly industrialized countries. Five million of the world's 6 billion people live in developing countries where incomes are usually under $2 per day and a significant portion of the population lives in extreme poverty (under $1.25 per day)”. Tche country may strongly depend on the agriculture sector rather than non-agricultural jobs, and also suffer from the lack of poor health and education systems (The World Bank, 2012). Meanwhile, a developed nation is a high income country whose Gross National Product (GNP) is $9,266 or more. These countries possess high levels of well-being, public services, and a large stock of physical capital (e.g., buildings, or technical equipments) (World Bank, 2004).
4
There has been an enormous increase in education, especially for females, since the 1960s. Barro and Lee (2013) report that, over the last 40 years, the average number of years of schooling has increased significantly from 3.86 per cent in 1970 to 7.28 per cent in 2010 for females worldwide. Nonetheless, it is worth pointing out that the increase in labour force skills has caused wage inequality among workers. Juhn et al. (1993), for example, identified that the increase in labour skills has caused wage inequality among workers in the United States for the past two decades. Fulfilling the labour market’s demand for people with higher degrees would widen the wage gap among workers much further. Their study showed that the earnings gap between high school graduates and college-educated individuals became much wider. They found that the average weekly wages for the least skilled workers decreased by 5 per cent compared to the highly-skilled workers’ earnings, which rose by up to 40 per cent (Murphy and Pierce, 1993).
Psacharopoulos (1985) compared the returns to education of many different countries according to their level of economic development. He found that female worker’s primary education has the highest returns to education in those countries with lower per capita incomes. He attributed this to the low cost of primary education and the high productivity differential between people with primary school education and those who are illiterate. Further, he found that the returns to any level of education were highest and lowest in least-developed countries and advanced countries, respectively.
For Indonesia, one of the developing countries, Psacharopoulos (1985) reported a private return of 25.5 per cent for primary school and 15.6 per cent for secondary school graduates. Nine years’ compulsory basic education was proclaimed on May 2, 1994; this was strengthened by Indonesian Law1 (UU No. 20, 2003), which obligated all citizens
aged between 7 and 12, to attend basic education consisting of nine years of schooling -
5
six years in primary school and three years in junior high school. In response to the education law, the Ministry of National Education (MoNE) on behalf of the government has regulated the compulsory nine years of basic education. The central government and local governments guarantee the implementation of compulsory basic education for every citizen.
According to Statistics Indonesia (BPS, 2012), since the implementation of the nine years of basic education, the illiteracy rate among those aged between 15 and 44 has dropped gradually from 3.88 per cent in 2003 to 1.7 per cent in 2010. Meanwhile, the illiteracy rate among those aged over 45 dropped from 25.43 per cent in 2003 to 18.25 per cent in 2010. This proves that the nine years’ compulsory education program has reduced the illiteracy rate of the Indonesian labour force. A growing educated labour force certainly has implications for earnings and job opportunities in the labour market.
The uneven economic growth between regions and unequal distribution of income resulted in the provinces of Java Island receiving a bigger subsidy than areas outside Java (Amri, 2000). The government’s failure to resolve the 1997 economic crisis caused the centralized government system ended with Law 22/1999 on regional autonomy and Law 25/1999 on the financial balances between central and local governments (Silver et al. 2001), they were replaced by Law 32/2004 and Law 33/2004. Under the Law No. 22/1999, the central government has delegated most of its discretionary powers, except on justice, monetary law, defence and religious affairs, to district governments. The companion act, Law 25/1999 revamped fiscal relation between the central government and the region alters the transfers received by local governments from the central government. One significant change was that the routine transfer that was largely used to pay the salaries of local civil servants through the Autonomous Region Subsidy (Subsidi Daerah Otonom, SDO) has been eliminated; also eliminated are general development transfers known Presidential Instruction (Instruksi Presiden,
6
Inpres) development grants (Brodjonegoro, 2000). These were replaced by a single block grant, known as the General Allocation Fund (Dana Alokasi Umum, DAU) whose total amount is specified as at least 25 per cent of central government domestic revenues and whose distribution among local governments is determined by the central government (McLeod, 2000). DAU used to finance development projects in areas such as primary schools, health facilities, water supply , and roads.
Law No. 25/1999 introduces revenue sharing revenue sharing for provincial and district governments, assigning each level of government its share of revenues from taxes on land and buildings, the transfer of land and buildings, forestry, mining, fisheries, oil, and gas (McLeod, 2000). A general allocation fund (DAU), a special autonomy grant for Papua, and a minor special grant facility (Dana Alokasi
Khusus, DAK) (Hofman et. al, 2006). Other local government sources of revenue for
example own source revenues, fees and charges, profits from government enterprises , borrowing are largely unchanged (Alm et al. 2001).
Prior to regional autonomy in 1999, Indonesia’s education system, from kindergartens through to universities, had been centralized and directly controlled by the central education authority in Jakarta. However, after Parliament passed Act no. 22/ 1999 on regional autonomy, the education system, from early-age education to upper secondary level, was transferred to local governments.
1.3 Motivation of the Study
It is believed that the labour market requires skilled workers with relevant expertise and experience. Therefore, education has become one of the main determinants of good jobs paying handsome salaries. Education in Indonesia has increased sharply at all levels over the last 30 years; therefore, it is plausible to assume that education will increase the
7
average income of the Indonesian people. In view of this, our study takes the period before and after the nine-year compulsory basic education program to evaluate the effect of educational level on people’s earnings during 1989-2009.
Since the nine-year compulsory basic education program was launched officially in 1994, women’s participation at the higher education level has increased sharply. Data from the World Bank (2010a) show that school enrolment for tertiary education increased from 8 per cent in 1995 to 18 per cent in 2007. This will encourage the female labour force to participate in the paid labour market. However, despite the fact that women have equal educational levels and are doing the same jobs as their male counterparts, women seem to earn less than men. This may be due to many factors including differences in gender traits, gender specialization in certain jobs and sex discrimination in the labour market (Deolalikar, 1993). However, this thesis will only focus on skill premium across gender. The reason of not including the type of occupation variables was because of incomplete availability of the data within the scope of years covered in this research.
The motivation of this study is to explore the impact of education on individual incomes. This study explores the influence of education on earnings differentials between males and females and the sources of income differences between men and women and society as a whole. Since 1999, the decentralisation of the education system and fiscal decentralisation has been implemented and certainly would affect regional development and individual earnings.
1.4 The Main Research Gaps
The existing literature covers the theory of human capital and empirical results of the return to education for both developed and developing countries and discusses every
8
aspect of the subject at great length. However, the current literature fails to discuss several crucial areas of this subject. A review of the existing work on the subject reveals the following gaps.
First, there is limited research in this area in the case of Indonesia; in order to bridge this gap, this study employs the latest National Labour Force Survey Data, when the law stipulating nine years’ compulsory basic education was in place.
Second, since the previous research was confined to a particular period, the change and trend in earnings based on educational change was not reported. Our study examines the rate of return to education, the trend and changes of the earnings differential, and gender discrimination in the Indonesian labour market within three decades. It provides strong analysis and comprehensive study in examining the trend in rates of return to education.
Third, the existing literature does not include some of the variables that might be expected to have a deterministic role in workers’ earnings; these variables include the presence of children, marital status and the worker’s area of residence. In order to fill this gap, this research attempts to identify the percentage changes that took place over the period 1989-2009 in individuals’ earnings due to their additional years of schooling. Through this research, we will also determine the pivotal role of education in workers’ final earnings. The study will try to identify the best strategy for discouraging or overcoming the gender discrimination issue that exists in the Indonesian labour market and to determine at what level of education (primary, secondary or tertiary) the government should concentrate its efforts to enhance the workers’ return.
Fourth, previous studies such as those by Behrman and Deolalikar (1991, 1993 and 1995) used the 1986 Labour Force Survey data, when the nine-year compulsory basic education policy was not in place. Our study is using the latest national labour force survey data when this research is started.
9
Fifth, to the best of the author's knowledge, no studies have examined the regional rates of return to education based on seven territories of Indonesia region. Previous studies on regional returns to education were carried out by Feridhanusetyawan et al. (2001) and Pirmana (2006) using the Indonesian national labour force survey. The investigation of seven regions in Indonesia expands the existing literature by providing evidence from multi ethnic groups, social-culture and natural resources.
1.5 Research Questions
The major objective of this study is to identify the rates of return to education and to develop an empirical model to explain the earnings differential and gender discrimination. In order to achieve the current research objective, this research has specific research questions to be answered, which are:
1. What is the significance of the relationship between education and earnings?
2. What are the differences of returns of workers who have completed primary, secondary and tertiary education compared to those who have no education?
3. How do female workers potentially benefit from receiving higher education, gaining more experience, residing in urban areas and getting married?
4. Are there any other determinants that might affect the earnings of male and female workers?
5. Does gender discrimination exist in the Indonesian labour market?
1.6 Significant Contributions
This thesis represents a comprehensive study on returns to education, gender discrimination and the earnings differential, and regional earning differentials in the
10
Indonesian labour market by using current data from National Labour Force Surveys (SAKERNAS) 1989-2009. The first part of the thesis examines the return to education by individual characteristics (i.e., education, experience, marital status, sex, residential area). It also describes the trend of returns to education over the past two decades. The second part provides analysis of the gender discrimination and earnings differentials within the Indonesian labour market. Further, regional earnings disparities and gender discrimination will also be included in this part.
There are several contributions of this research study to the existing literature. First, this research attempts to identify the rate of returns to education for both males and females. I will also seek to determine the role of education in workers’ final earnings, and analyse the impact of education, experience, residential location and other individual characteristics on their returns.
Second, this thesis evaluates the rates of return and earnings differentials on all regions in Indonesian. As an archipelago country, each region has its own unique territorial characteristics such as natural resources, human capital and development, ethnic groups, social-culture, languages, and religion. These differences may influence on employment sector and individual earnings in each region.
Third, this study identifies the trend of individual earnings over the last two decades (1989- 2009) due to additional years of schooling. The implementation of nine years compulsory basic education in 1994 had caused an increasing number of enrolments in primary and lower secondary schools. It is expected that the policy would have a positive effect on a worker’s income level.
Fourth, this thesis will offer strategies to overcome the gender discrimination issues that exist in the Indonesian labour market. The sources of earnings differentials and gender discrimination analysed in this study will assist the policy makers in reducing wage gaps and gender differences in the country.
11
Fifth, the research indicates at what level of education (primary, secondary or tertiary) the government should concentrate its efforts to enhance the workers’ return. Since 1994, the government has focused on nine years compulsory basic education (6 years for primary education plus 3 years for lower secondary education). The analysis will suggest whether in the future the government should pay more attention in upper secondary education, especially vocation school.
Six, this study highlights the importance of education in reducing the regional earnings gap between Java and the Outer Islands. The study also emphasises how unobserved characteristics such as social norms, customs, rights and laws as well as economic institutions contribute in gender discrimination. The policy of the regional autonomy over the fiscal balance depends upon many institutional factors such as democracy, accountability, people‘s participation, rules of law and equal treatment of all ethnicity, religion and social-cultures. The study argues that these institutional factors hold the key to determines the success or failure in reducing gender discrimination and regional imbalance.
1.7 Structure of the Thesis
This section illustrates the structure and organisation of the current research while providing an overview of its contents. The thesis is organised into ten chapters as follows.
Chapter one is an introductory chapter that presents the background of the study along with the principal motivation behind undertaking the current research. The chapter then identifies the research gaps and underlines the research questions followed by highlighting its importance and contribution of this study.
12
Chapter two highlights the background of the educational system in Indonesia, focusing on the educational system under three regimes: old order era (1945-1965); new order era (1966-1997); and reformation era (1998-present). It also explains the levels of education and the rate of school enrolment and attainment.
Chapter three presents an overview of the Indonesian labour market: the labour market conditions; the level of labour force education and participation rate; the level of employment and income; the level and rate of unemployment. The nature of employment problems in Indonesia is also discussed in this section. In addition, this chapter will give an outline of the labour market conditions in Indonesia.
Chapter four reviews previous studies related to the three subjects: wages and education; gender discrimination; and the earnings differential. The discussion in this chapter reveals that education strongly affects the wages of both male and female workers. The effect of education on earnings increases as the educational level advances. The impact of gender wage discrimination on final earnings, determined by decomposing the male and female wage differentials, is also discussed from different points of view. This chapter also presents the relationships between studies by highlighting their strengths and weaknesses.
Chapter five explains the methodology employed in this study. This chapter describes how this research is conducted and sets out the variables and their definitions. Furthermore, the description and sources of data, the data collection procedures and analysis are also discussed.
Chapter six presents the results of the empirical findings on the associations between education and wage, and the effect of the individual characteristics, such as residential location, marital status and number of family members, on wages. This chapter also presents the rate of return to education, differences in returns for males and females, and the trend of returns within the study period (1989-2009).
13
Chapter seven provides the empirical findings of the return to education from a regional perspective. An overview of the regions and their importance are discussed in this chapter. The descriptive statistics of the Indonesian regions indicate that Indonesia is an archipelagic state containing various ethnic groups, cultures and religions, with significant differences in population and natural resources among its regions.
Chapter eight provides the results obtained from the gender decomposition analysis. The descriptive analysis indicates that, despite the recent increase in women’s wages, women’s average hourly wage is still lower than that of men. The results provide an insight into gender earnings in regard to education. They show that an additional year of schooling increased earnings for females and males during the period 1989-2009. The next section of chapter 8 provides the decomposition of the gender earnings differential, showing that education is one of the most important factors in the narrowing of the gender wage gap.
Chapter nine addresses the gender earnings differential and discrimination from a regional perspective. Finally, chapter ten provides an overall conclusion to the study. The chapter summarizes the findings of the study and highlights the implications, limitations and the recommendations for future research.
1.8 Conclusion
There was an increase in women’s participation in education in Indonesia from elementary school to university level, especially after the implementation of the nine-year compulsory basic education program. As their participation in education increased, women’s participation in the paid labour market also increased. Although the research on the effects of education in Indonesia is still limited, several studies such as those by Byron and Takahasyi (1989), and Berhman and Deolalikar (1991, 1993 and 1995) found that
14
education had a greater effect on women’s earnings, especially higher education. Meanwhile, Feridhanusetyawan et al. (2001) and Pirmana (2006) found that gender discrimination exists in the Indonesian labour market.
This chapter has provided a brief account of the importance of education, skills and other relevant variables as a passport to enter the labour market. Educational enrolment has undoubtedly increased gradually as the demand for educated labour has increased. It is clear that women’s participation in the labour force has increased even though women seem to earn less than men do. In view of the limited research in this area, especially in the case of Indonesia, women’s growing participation and gender discrimination in the paid labour market are among the motivations for the study.
This study builds on and extends past research by using a richer and larger dataset which more accurately represents the current and past population of Indonesia and which should produce more representative empirical results. This study employed three datasets: the data are taken from the 1989, 1999 and 2009 National Labour Force Surveys (SAKERNAS) conducted by BPS.
15
CHAPTER 2
THE EDUCATION SYSTEM IN INDONESIA
2.1 Introduction
Indonesia declared its independence from the Netherlands on 17 August 1945. However, the armed struggle continued until 1949; consequently, the Indonesian National Education system did not start to function properly until after 1949 (Kristiansen and Pratikno, 2006), resulting in a situation where only a small number of students were attending primary and secondary school in the early 1950s. This was mainly due to the long period of colonization, during which there were no school institutions prior to the 1920s. The national education system can be divided into three periods: the first was the Old Order period, under the Sukarno administration between 1950 and 1965; the second period was the New Order period during the Suharto regime between 1965 and 1998; the third period is the reformation period from 1999 to the present day.
This chapter presents a short review of Indonesian education system within three regimes: Old Order period (1945-1965); New Order period (1966-1999); and reformation period (1999-present). The review briefly covers the education system in the country from 1945, when formal education was first implemented, up to the present day, along with details of the total number of students, teachers and schools/institutions. The presentation of these issues is considered of particular importance as background information for the present study. Massive construction of primary school institutions during the New Order era in the 1970s and 1980s, also known as Sekolah Dasar INPRES (Primary School Presidential Decree), provided evidence of how an educated labour force affects the labour market in Indonesia. In a later chapter, we will look at the school system in Indonesia from early ages up to university level. The chapter also highlights the trend of
16
school enrolment within three levels of education that is primary education, secondary education and higher education.
2.2 National Education System
According to the Ministry of National Education (MoNE), Indonesia’s current national education system is based on Law no. 20 of 2003, which is an improvement of Law no. 2 of 1989. The Indonesian National Educational system consists of formal education, non-formal education and informal education. Formal education consists of pre-school, basic education, secondary education and higher education. In addition, some other types of education are also provided in Indonesia, including general education, vocational education, academic education, professional education, vocational and technical education, religious education and special education (UNESCO, 2010a).
As shown in Figure 2.2, formal education in Indonesia starts with kindergarten and ends at college. There are two types of educational administration in Indonesia, managed by two ministries: public and private schools, and Christian or Chinese-sponsored schools come under the supervision of the MoNE, whereas religious schools are supervised by the Ministry of Religious Affairs (MoRA). According to Zhao (2006), 85 per cent of school enrolments are under the supervision of the MoNE while the remaining 15 per cent of school enrolments are under the supervision of the MoRA. There is a slight difference between modern Islamic schools and secular schools; the former combine secular and Islamic subjects while the latter emphasize Pancasila as the basic principles of the state.
17 Figure 2. 1: School System in Indonesia
Source: Embassy of the Republic of Indonesia in London-United Kingdom (2010)
There is another type of education system in Indonesia, the non-formal education, which is provided to community members who need educational services that can function as a replacement for, or complement/supplement to, formal education with the aim of supporting life-long education. Non-formal education is aimed at developing learners' potentials, with an emphasis on the acquisition of knowledge and functional skills and the development of personality and professional attitudes. Figure 2.2 describes non-formal education which comprises life-skills education, early childhood education, youth education, women’s empowerment education, literacy education, vocational training and internship, equivalent programs and other kinds of education aimed at developing learners' ability. Non-formal education consists of training centres, colleges, study groups, community learning centres, and other similar educational units.
18 Figure 2. 2: Education System in Indonesia
Source:Embassy of the Republic of Indonesia in London-United Kingdom (2010)
Training centres and colleges are provided for community members in need of knowledge, competencies and life-skills in order to develop their attitudes, professionalism, work ethics and entrepreneurship. They also provide further education. In 1994, the government introduced the policy of out-of-school education, which emphasized basic education through package A, which is equivalent to primary school, package B, which is equivalent to lower secondary school, and package C, which is equivalent to senior secondary school. This policy helped those students who had dropped out to gain access to an informal education program so that the nine years’ basic education target could be achieved.
19 2.3 Old Order Period (1945-1965)
In the first period, under the government of Sukarno, Indonesia faced many problems including poverty, low level of education, poor infrastructure, and limited numbers of school institutions and teachers (Choy, 1999). In 1950, for example, the total number of pupils enrolled in primary education was 5.3 million, and there were 27 thousand primary schools. By 1960, the number of students had increased to 8.9 million and the number of schools had risen to 37.6 thousand (UN Statistical Yearbook, various issues). It seems that the numbers of schools and pupils both increased, but classroom space was very limited.
Ricklef (1981) described the economic and social problems facing the new state of Indonesia after the Japanese occupation period. One of the most obvious social problems was the size of the population. In 1950, the population was estimated at 77.2 million; by 1955 it had increased to 85.4 million, and according to the 1961 census the population had increased to 97 million. Therefore, although food production increased, it was not enough to adequately supply the growing population. In 1930, 3.8 per cent of the population were classified as urban, but by 1961 the urban population had increased to 8.14 per cent. Jakarta’s population had increased sharply, reaching 2.9 million in 1961.
Furthermore, Ricklefs (1981) described how education in this period was the main priority, and the number of educational institutions increased sharply. During the period 1953-1960, total enrolments in primary schools increased from 1.7 million to 2.5 million. Unfortunately, approximately 60 per cent of these children dropped out before completing school (Ricklefs, 1981). Public and private (mostly religious) high schools and universities were scattered throughout the country, especially in Java, and many of the universities had already reached a high standard (Ricklefs, 1981). The term ‘high standard’ here referred to school infrastructure, facilities and qualified teachers. In this period, under Sukarno’s presidency, the government emphasized the importance of
20
reducing the illiteracy rate. Literacy is defined as the ability to read and write and understand a simple statement related to one’s daily life; it often includes basic arithmetic skills as well (UNESCO Institute for Statistics, 2010b). In 1989, the government pushed all citizens towards basic education by establishing the basic education law requiring all citizens to complete basic primary education. However, this plan was not particularly successful, as many parents were reluctant to send their children to school. In addition the schools were small, with little available space and a limited number of teachers. Nevertheless, during this period the literacy rate increased from 20.1 per cent in 1950 to 42.9 per cent in 1961 (Malik, 1994). In addition, Malik demonstrated that, during this period, primary school enrolment increased from 158,787 in 1908 (out of a population of 39 million) to 621,980 in 1919 (out of 49 million). Along with an increase in population, school enrolment rates also increased sharply from 1.47 million in 1930 to 12.3 million in 1968.
2.4 New Order Period (1966-1998)
The second period was the New Order Period, which is commonly referred to as the Suharto regime (1965-1998). Suharto called his administration the New Order to distinguish it from the previous administration, which had been more sympathetic to the Indonesian communist party. Suharto's regime was a capitalist one. After 1965, Indonesia entered a new phase under Suharto’s capitalist government, consisting of massive development of school institutions and educational personnel. Although natural resources remained unexploited until Indonesia gained its independence in 1945, oil exploration in Indonesia dates back to 1871. As one of the oil-producing countries, Indonesia benefited greatly from the rise in world oil prices in the 1970s (Kristiansen and Pratikno, 2006); Indonesia built many schools, trained more teachers and provided more secondary and higher education. In 1967, Indonesia had only 282,026 teachers in 51,431 primary schools
21
(United Nations, 1970)). However, in 1985 Indonesia had 1.18 million primary school teachers in 168,555 primary schools, with a ratio of seven teachers per school (United Nations, 1991). The New Order government achieved significant advances in the fields of education, health and welfare, particularly after 1973 when President Suharto issued a special instruction (INPRES) to build thousands of primary schools.
The opening part of the 1945 Basic Law of the Republic of Indonesia declared that one of the state’s goals was the improvement of the nation’s intellectual life; to that end, every Indonesian citizen was entitled to an education in accordance with their interests and talents regardless of social status, race, ethnicity, religion and gender. The national education system is based on the state ideology Pancasila. It defines five principles as the state’s philosophy, which is clearly spelt out in the 1945 Constitution Law. These five principles are as follows: (1) belief in God Almighty; (2) just and civilized humanity, including tolerance of all people; (3) unity of Indonesia; (4) democracy led by the wisdom of deliberation and among the representatives of the people; (5) social justice for all. Thereafter, several efforts were made to improve the nation’s intellectual life, marked by Five-Year Development Plans or Rencana Pembangunan
Lima Tahun (REPELITA). REPELITA I lasted from 1969 to 1974, followed by
REPELITA II (1974-1979), REPELITA III (1979-1984), REPELITA IV (1984-1989), and
REPELITA V (1989-1994).
Soedijarto and Moleong (1980, quoted by Zhao, 2006) illustrated that education issues were addressed continuously in the first three Five-Year National Development Plans. The First Five-Year Plan (1969-1973) focused on seven problems of education: 1) Providing enough educational facilities to accommodate the entire school-age
population, particularly at the elementary-school level;
2) Redressing the balance of secondary-school enrolments from the present majority of students in general-academic curricula in favour of vocational-training schools;
22
3) Increasing the percentage of pupils passing from primary to secondary education; 4) Reducing illiteracy among the adult population;
5) Reducing the 50 per cent dropout rate in elementary schools; 6) Increasing the number of qualified teachers;
7) Improving administrative efficiency.
In 1973, during the First Five-year Development Plan, President Suharto issued a special instruction, abbreviated as INPRES, to build thousands of primary schools. According to Duflo (2000), and Sulaiman and Gasim (1998), the government launched the school construction program, known as Sekolah Dasar INPRES (SD INPRES), in which more than 61,000 primary schools were built by 1979. The goal of the government was to increase the school enrolment rate among children aged 7-12. A non-formal education program had been proposed in the late 1970s and extended through to 1983 to reduce the number of dropouts and bring them back to school (Cann, 1982). In 1980, the government provided a national budget for the construction of 10,000 more schools, 15,000 new classrooms in existing schools and the refurbishment of 15,000 existing buildings (Zhao, 2006). Table 2.1 shows that the number of primary schools increased rapidly from 65,950 in 1971 to 128,875 in 1980; at the same time, the number of secondary schools increased from 5,293 to 12,361, while the teacher ratio was around 6-9 teachers per school during this period. By 16-984, 6-97 per cent of 7-12 year olds were attending school, compared to 57 per cent in 1973 (Kristiansen and Pratikno, 2006). The enrolment rate had reached 84 per cent for males and 82 per cent for females by the end of 1980. This was considered one of the most successful school expansion programs within developing countries (Duflo, 2000). In the First Five-Year Development Plan, the government wanted to achieve two things. Firstly, it wanted to increase the number of primary school graduates enrolling in secondary school; secondly, it wanted to increase
23
the number of students enrolling in vocational secondary school in order to meet the labour market demand.
Table 2. 1: Number of Primary and Junior High Schools in Indonesia, 1971-1980.
Year 1971 1972 1973 1974 1975 1980
Primary School 65,950 66,240 66,350 66,944 72,760 128,875
Primary School Teacher 534,800 548,424 556,652 573,061 603,327 787,400
Teacher/School ratio 8 8 8 9 8 6
Junior High School 5,293 5,548 5,485 5,597 5,960 10,516
Sources: Zhao (2006); UNESCO (2010b)
Five education policies were achieved during the New Order period (1966-1998). The first was the 1978 school construction programs while the second was the 1973-1984 expansion of junior high schools. Next, initiatives were taken to ensure six years’ compulsory elementary schooling in 1984. This was followed by the education law on compulsory education stipulating six years of elementary school plus three years of lower secondary school in 1989. Finally, in 1994 the focus switched officially to compulsory lower secondary school attendance (Kristiansen and Pratikno, 2006). The Asian financial crisis of 1997 delayed the effective imposition of nine years’ compulsory basic education2. Then, after Law No. 2 of 1989 was amended by Law No. 20 of 2003, the
policy of nine years’ compulsory basic education was successfully implemented.
2.5 Reformation Period (1999-Present)
The reformation era has provided a large space for the formulation of new education policies that are reformative and revolutionary (Kristiansen and Pratikno,
2 Among all the Asian countries hit by the crisis, Indonesia was by far the worst affected, economically,
24
2006). Since 2001, the administration of education in Indonesia has changed dramatically. The education supervision changed from a centralised education system (old order period) becames a decentralized system. In the reformation era, the government is running the 1945 Constitution Law to prioritize education spending budget to at least 20 per cent of the state budget (Toyamah and Usman, 2004).
Based on Law. 22/1999 on local government, which is reinforced by Law no. 25/1999 on financial balance between central and local governments, the managerial and financial responsibilities for all levels of public education have been decentralised from central government, mostly to local government at the district level. There are now 440 districts, representing the third layer of the five-tier government hierarchy (Kristiansen and Pratikno, 2006). Education leads to the development of the local needs, in which diversity is of considerable concern and communities can play an active role in the implementation of the teaching and learning process.
The government introduced the model of "School-Based Management (SBM)" . Means that principals now manage their schools as autonomous units within the national education system, with parents and community members governing schools through representative school committees. School-based management enables the community to be actively involved in preparing school-development plans. School committees can approve the annual budget which is based on the school-development plan, and monitor the management of funds and use of school resources. (Law No. 20/2003)
While in order to provide for qualified human resources, then the government created a system of "Competency-Based Curriculum” (Sulfasyah, 2013). In 2003, the government passed a law No.20/2003 on the national education system to replace Law No. 2/1989, and since then education is understood as a conscious and well-planned effort in creating a learning environment and learning process so that learners will be able to develop their potential for acquiring spiritual and religious strengths, develop self-control,
25
personality, intelligence, moral and noble character, and skills that one needs for him/herself, for the community, for the nation, and for the state (Law No. 20/2003).
In the reformation era, education has changed dramatically in term of administration, financial support, and education policy from central government to local government. In addition to the benefits of the enactment of the decentralization of education system as mentioned above, however, education has not entirely been successful. Here are some issues that arise are (Zuhdi, 2012): 1) localization of human resources, Hidayat (2011) identify two important issues in terms of human resources that cause of decentralization of education is not run well, the teachers are unprofessional and incompetent officials; 2) lack of regional preparation, Not all areas have the human resources with the same readiness to manage a good education; 3) grade and graduation oriented. The central government seeks to minimize the gap between the quality of education with the implementation of national standards of education and national examinations. For some local governments, the implementation of the national exam is a demand to produce students who have test scores that are above the national minimum scores.
There are some curriculums used during this era (Sulfasyah, 2013): 1. Competency-Based Curriculum (CBC)
The definition of competency-based curriculum used in this study refers to the one stated in the government law regarding the national education system (Law No. 20/2003). A curriculum which is developed based on a set of standardised competencies which specify the knowledge, skills, and attitudes that students should possess at the end of a course of study. In the implementation of this curriculum, students position back in place as a subject in the educational process as it opens up the discussion to acquire the knowledge. Students thus claimed to be active in acquiring information. The teachers'