University of Wollongong
University of Wollongong
Research Online
Research Online
Faculty of Engineering and Information
Sciences - Papers: Part B
Faculty of Engineering and Information
Sciences
2020
Role of optimization algorithms based fuzzy controller in achieving
Role of optimization algorithms based fuzzy controller in achieving
induction motor performance enhancement
induction motor performance enhancement
M Hannan
Jamal Ali
M J. Hossain
A Mohamed
Pin Ker
See next page for additional authors
Follow this and additional works at:
https://ro.uow.edu.au/eispapers1
Part of the
Engineering Commons
, and the
Science and Technology Studies Commons
Recommended Citation
Recommended Citation
Hannan, M; Ali, Jamal; Hossain, M J.; Mohamed, A; Ker, Pin; Indra, T; Mansor, M; Hussain, Aini; Muttaqi,
Kashem M.; and Dong, Z, "Role of optimization algorithms based fuzzy controller in achieving induction
motor performance enhancement" (2020). Faculty of Engineering and Information Sciences - Papers: Part
B. 4283.
https://ro.uow.edu.au/eispapers1/4283
Research Online is the open access institutional repository for the University of Wollongong. For further information
contact the UOW Library: [email protected]
motor performance enhancement
motor performance enhancement
Abstract
Abstract
© 2020, The Author(s). Three-phase induction motors (TIMs) are widely used for machines in industrial
operations. As an accurate and robust controller, fuzzy logic controller (FLC) is crucial in designing TIMs
control systems. The performance of FLC highly depends on the membership function (MF) variables,
which are evaluated by heuristic approaches, leading to a high processing time. To address these issues,
optimisation algorithms for TIMs have received increasing interest among researchers and industrialists.
Here, we present an advanced and efficient quantum-inspired lightning search algorithm (QLSA) to avoid
exhaustive conventional heuristic procedures when obtaining MFs. The accuracy of the QLSA based FLC
(QLSAF) speed control is superior to other controllers in terms of transient response, damping capability
and minimisation of statistical errors under diverse speeds and loads. The performance of the proposed
QLSAF speed controller is validated through experiments. Test results under different conditions show
consistent speed responses and stator currents with the simulation results.
Disciplines
Disciplines
Engineering | Science and Technology Studies
Publication Details
Publication Details
M. Hannan, J. Ali, M. Hossain, A. Mohamed, P. Ker, T. Indra, M. Mansor, A. Hussain, K. Muttaqi & Z. Dong,
"Role of optimization algorithms based fuzzy controller in achieving induction motor performance
enhancement," Nature Communications, vol. 11, (1) 2020.
Authors
Authors
M Hannan, Jamal Ali, M J. Hossain, A Mohamed, Pin Ker, T Indra, M Mansor, Aini Hussain, Kashem M.
Muttaqi, and Z Dong
ARTICLE
Role of optimization algorithms based fuzzy
controller in achieving induction motor
performance enhancement
M. A. Hannan
1
✉
, Jamal Abd. Ali
2
, M. S. Hossain Lipu
3
✉
, A. Mohamed
3
, Pin Jern Ker
1
,
T. M. Indra Mahlia
4
, M. Mansor
1
, Aini Hussain
3
, Kashem M. Muttaqi
5
& Z. Y. Dong
6
Three-phase induction motors (TIMs) are widely used for machines in industrial operations.
As an accurate and robust controller, fuzzy logic controller (FLC) is crucial in designing TIMs
control systems. The performance of FLC highly depends on the membership function (MF)
variables, which are evaluated by heuristic approaches, leading to a high processing time. To
address these issues, optimisation algorithms for TIMs have received increasing interest
among researchers and industrialists. Here, we present an advanced and ef
fi
cient
quantum-inspired lightning search algorithm (QLSA) to avoid exhaustive conventional heuristic
pro-cedures when obtaining MFs. The accuracy of the QLSA based FLC (QLSAF) speed control is
superior to other controllers in terms of transient response, damping capability and
mini-misation of statistical errors under diverse speeds and loads. The performance of the
pro-posed QLSAF speed controller is validated through experiments. Test results under different
conditions show consistent speed responses and stator currents with the simulation results.
https://doi.org/10.1038/s41467-020-17623-5
OPEN
1Department of Electrical Power Engineering, College of Engineering, Universiti Tenaga Nasional, Kajang 43000, Malaysia.2General Company of Electricity
Production Middle Region, Ministry of Electricity, Baghdad 10001, Iraq.3Department of Electrical, Electronic and Systems Engineering, Universiti Kebangsaan
Malaysia, Bangi 43600, Malaysia.4School of Information, Systems and Modelling, University of Technology Sydney, Ultimo, NSW 2007, Australia.5School
of Electrical, Computer and Telecommunications Engineering, University of Wollongong, Wollongong, NSW 2522, Australia.6School of Electrical Engineering
and Telecommunications, UNSW, Kensington, NSW 2033, Australia.✉email:[email protected];[email protected]
123456789
T
hree-phase induction motor (TIM) is considered a high
energy consuming appliance used in industrial and
com-mercial applications
1–3. TIMs account for ~60% of total
electricity consumption for electrical to mechanical
transforma-tion of energy
4,5. High reliability, simple design, ruggedness, low
cost and ease of maintenance are the main advantages of TIM
6,7.
However, the dynamic con
fi
guration of TIMs is a nonlinear
sys-tem that cannot be easily explained from a theoretical point of
view because of rapid changes in load or speed
8–10. Therefore, an
advanced and robust controller is required to enhance the strength
and performance of TIM
11,12. The scalar control (i.e., V/F control)
method has been the commonly used technique to achieve
rea-sonable speed under differ load settings of TIM. The scalar control
exhibits simple design, structure and low price. Moreover, this
method does not consider the parameters of motors and can
control medium to the high speed of TIM effectively
13.
The conventional controller, namely, proportional
–
integral
–
derivative (PID) has been widely applied to adjust the main
parameters of TIM, including rotor
fl
ux, torque, speed, current
and voltage
14,15. However, PID has shortcomings in terms of
appropriate parameter selection due to the trial-and-error (TE)
considerations. The arti
fi
cial intelligence (AI) based controllers
including arti
fi
cial neural network and adaptive neuro-fuzzy
inference systems have been performing satisfactorily in motor
applications such as fault identi
fi
cation
16, speed assessment
17and
harmonics and torque ripple minimization
18. However, the
AI-based controllers have drawbacks concerning huge data
require-ment, long learning and training duration. Fuzzy logic controller
(FLC) is extensively utilised in real-time TIM control using
adaptive modelling under sudden
19,20. Furthermore, FLC can
operate in highly linear and nonlinear systems without
con-sidering any mathematical model
21,22. Nevertheless, the accuracy
of FLC depends on the suitable design and the optimal number of
membership functions (MFs), as well as appropriate fuzzy rule
generation
23. Generally, a TE procedure is used to determine
these variables; however, this procedure causes a substantial delay
in control operation
24.
At present, the role of optimisation techniques in industrial
applications has attracted massive attention because of their high
accuracy, ef
fi
ciency and adaptability that provides high-quality
results
25–27. Optimisation techniques have been highly explored
in FLC based TIM drives for the appropriate tuning of control
parameters that results in high performance and ef
fi
ciency
28,29.
Ali et al.
30introduced backtracking search algorithm (BSA) based
FLC for controlling an induction motor speed, thus avoiding
exhaustive traditional TE procedure for obtaining MFs. Ranjani &
Murugesan
31proposed particle swarm optimization (PSO) based
FLC to determine the optimal fuzzy parameters for achieving the
minimum value of the objective function (OF). Pan et al.
32developed an optimal FLC utilizing genetic algorithm (GA) and
PSO through the adjustment of control parameters to minimize
the OF. Shareef et al.
33established lighting search algorithm
(LSA) based FLC to overcome the TE process in achieving the
suitable value of MFs. Mutlag et al.
34designed an advanced
controller using differential search optimization based FLC to
obtain the lowest value of OF and best value of MFs. Ochoa
et al.
35deployed Type-1 and Interval Type-2 fuzzy systems to
enhance the performance of differential evolution (DE) algorithm
to achieve dynamic adaptation of the mutation parameters as well
as optimize the MFs. Castillo et al.
36analyzed and compared the
FLC optimization algorithms including bee colony optimization
(BCO), DE, and harmony search algorithms. Melin et al.
37applied shadowed type-2 fuzzy MFs to reduce the computational
cost in control applications. Castillo et al.
38optimized the
gen-eralized type-2 fuzzy logic system with BCO to achieve the
optimal con
fi
guration of MFs. However, heuristic optimisation
techniques exhibit performance variation because of the size and
population of their dimension problem in each system
39.
More-over, some methods show unequal global and local searching
abilities in obtaining optimal results in search space
23. To
over-come these challenges, numerous studies have focused on
improving search performance through quantum mechanics
theories applied in optimisation
40–42.
The execution of TIM drive through the experimental platform
is carried out using dSPACE,
fi
eld-programmable gate array
(FPGA), or digital signal processor (DSP). The dSPACE and
FPGA have illustrated effectiveness in the implementation of
grid-integrated voltage source inverter
43and
fi
ve-phase voltage
source inverter
44, respectively. Nevertheless, dSPACE and FPGA
have shortcomings in terms of cost and working method that
cannot operate on a standalone basis. In contract, DSP offers
bene
fi
ts with regard to cost-effectiveness, low power
consump-tion, fast computational capability, and embedding processor
45,46and has been excellent in operating TIM drive
47and permanent
magnet synchronous motor
48.
In this study, we propose quantum-inspired lightning search
algorithm (QLSA) to avoid the exhaustive conventional heuristic
technique in obtaining the suitable value of the MFs. We apply
the QLSA to a group of fourteen benchmark functions and
compare with other optimisation techniques by using different
benchmark functions. We present an optimal QLSA-based FLC
(QLSAF) speed controller to tune and minimise the OF under
different speed and load conditions. We implement the prototype
of the QLSAF speed controller using V/f control with pulse width
modulation switching technique and low-cost single-chip
DSP-TMS320F28335 control board. We validate the proposed method
by experiments and compare with the simulation results. The
results validate and con
fi
rm the implementation of the proposed
algorithm in a multi-induction motor drive.
Results
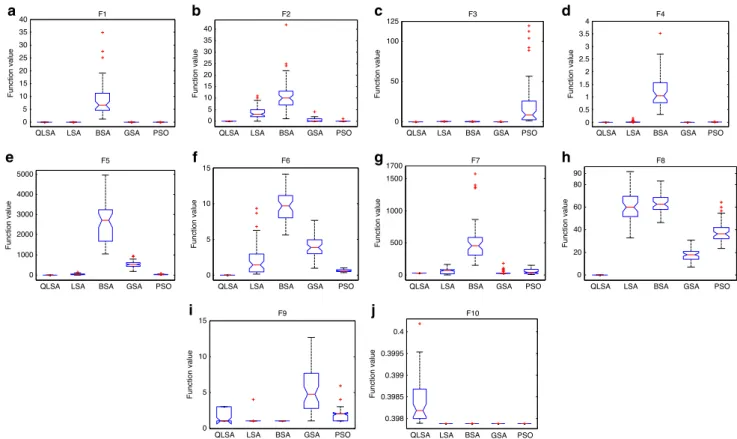
QLSA performance evaluation
. The accuracy, adaptability and
ef
fi
ciency of QLSA are assessed using the 14th benchmark
functions towards obtaining the global minimum value. The
results are presented in the box plot and compared with the LSA,
BSA, gravitational search algorithm (GSA) and PSO (Fig.
1
).
Details of the comparative optimisation algorithms are depicted
in the Supplementary File. The accuracy of QLSA is nearly
adjacent to the global minimum in group 1 benchmark functions
for Sphere (F1), Step (F2) and Quartic (F3). The second test is
implemented using group 2 benchmark functions, and results
indicate that the QLSA reaches the best global minimum for
Schwefel 2.22 (F4), Schwefel 1.2 (F5), Schwefel 2.21 (F6) and
Rosenbrock (F7). QLSA is also veri
fi
ed under group 3 benchmark
functions, where the complexity level of the optimisation problem
increases. QLSA reaches the best global minimum for F8 and the
near-global minimum for F9 and F10. These results demonstrate
the strong computational capacity of QLSA in obtaining any local
minimum. The proposed QLSA is tested through the benchmark
functions of group 4 including F11, F12, F13 and F14
(Supple-mentary Fig. 6). The results illustrate that the best global
mini-mum for QLSA is found in F11 and F12, and the near-global
minimum is achieved in other functions. In summary, the results
shown in the box plot demonstrate that QLSA performs
satis-factorily in most of the tested functions (Supplementary Tables 3
–
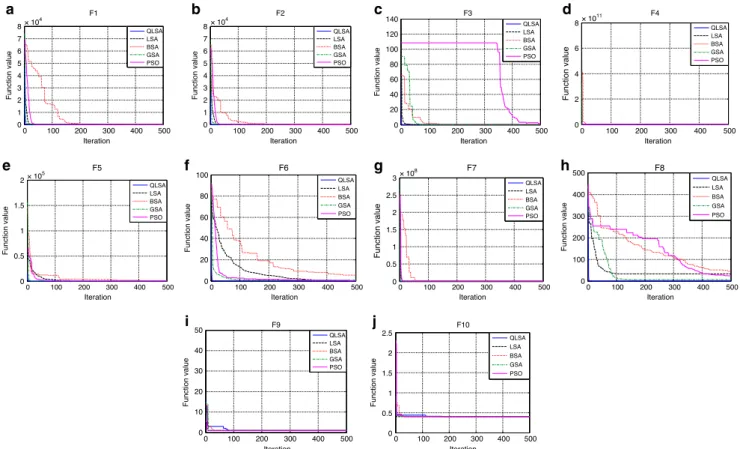
6). The results are further elaborated using convergence
char-acteristic curves (Supplementary Fig. 7). QLSA reaches the global
minimum rapidly in comparison with the other optimisation
methods. Thus, the proposed algorithm exhibits excellent
con-vergence characteristics under different function optimisations
Fig.
2
.
Simulation results of optimal control system in TIM
. The
QLSAF controller is designed and implemented under MATLAB/
Simulink environment. To verify the effectiveness of QLSAF, the
results are compared with various fuzzy speed controllers,
including LSA-based fuzzy (LSAF), BSA-based fuzzy (BSAF),
GSA-based fuzzy (GSAF) and PSO based fuzzy (PSOF) speed
controllers. The accuracy of the proposed QLSAF controller is
tested under three test cases, namely, sudden changes in step
response, down-to-up-to-down (DTUTD) step SR and ramp
response (RS)
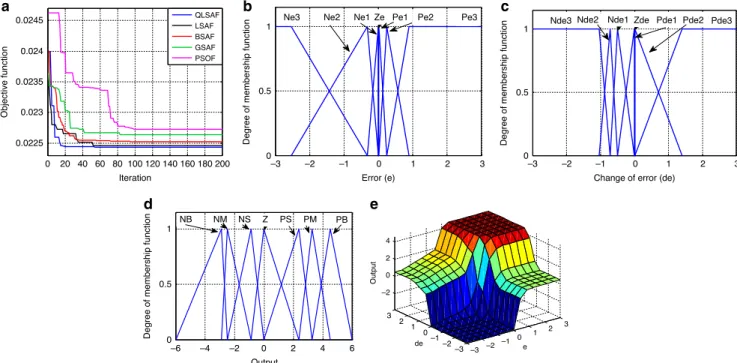
49. The convergence characteristic curves are
gen-erated by the different optimised controllers that illustrate the OF
(Fig.
3
a). The results demonstrate that the QLSAF speed
con-troller rapidly responds towards obtaining the lowest value of the
OF in comparison with the other optimal controller methods. In
this research, the maximum border and change of errors for MFs
is between
−
3 and 3, and the output of MFs is located between
−
6 and 6. The QLSAF optimisation technique is used to
deter-mine the optimal MF values between the maximum borders of
each TIM. The optimised values of MFs for error, change of error
and output from the QLSAF speed controller are depicted in
Fig.
3
b
–
d, respectively. A 3D diagram (Fig.
3
e) indicates the
relationship between the inputs (error and change of error) and
the output (slip speed).
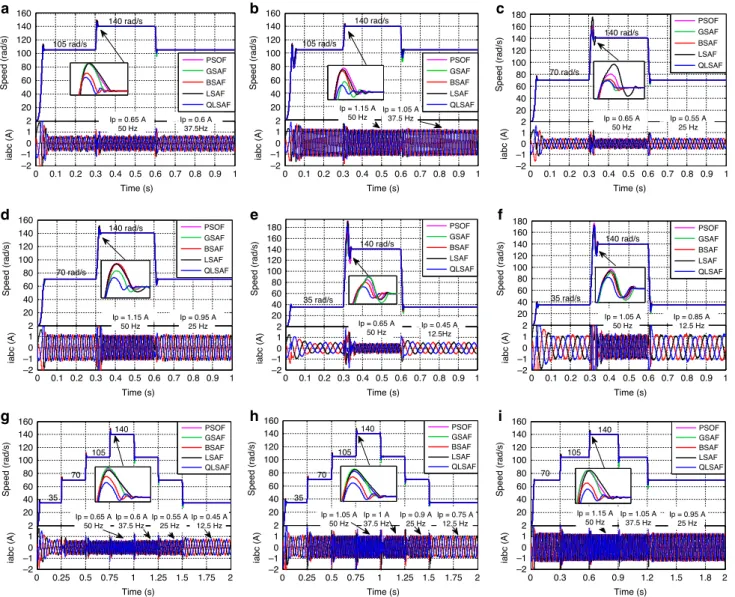
A step response test is performed to assess the adaptability of
the QLSAF controller under rapid variation in speed response
(SR) and load difference. The step SR consists of three cases for
each TIM, namely, sudden change from three quarters to full
speed, half speed to full speed and quarter speed to full speed with
no-load and load conditions. The SR of the motor increases from
105 rad/s to 140 rad/s at 0.3 s, and then the speed drops to 105
rad/s from 140 rad/s at 0.6 s without loading, as shown in Fig.
4
a.
Accordingly, the peak stator currents (SCs) increase from 0.6 A
with 37.5 Hz to 0.65 A with 50 Hz. Similar speed variation is
further applied under 2 Nm load conditions, thereby increasing
the peak SCs from 1.05 A to 1.15 A (Fig.
4
b). The mean absolute
error (MAE), root mean squared error (RMSE) and standard
deviation (SD) are 3.4720%, 16.5700% and 16.2653%, respectively
(Supplementary Table 7). In Fig.
4
c, a change in speed is observed
from 70 rad/s to 140 rad/s at 0.3 s and then from 140 rad/s to
70 rad/s at 0.6 s under the variation in SCs from 0.55 A with
25 Hz to 0.65 A with 50 Hz at no-load condition. In Fig.
4
d, the
SCs change from 0.95 A to 1.15 A under 2 Nm load condition; the
fi
gure shows SRs that are similar to those in Fig.
4
c. The MAE,
RMSE and SD of QLSAF are 2.1009%, 10.4828% and 10.2860%,
respectively (Supplementary Table 7). In Fig.
4
e, the SR initially
increases from 35 rad/s to 140 rad/s at 0.3 s and then declines to
30 rad/s from 140 rad/s at 0.6 s without applying load. The peak
SCs rise from 0.45 A to 0.65 A at 12.5 and 50 Hz, respectively.
A similar SR is shown in Fig.
4
f. Nevertheless, a change in SCs
from 0.85 A to 1.05 A is monitored at 1 Nm load conditions.
0 5 10 15 20 25 30 35 40
a
e
f
g
h
i
j
b
c
d
QLSA F1 0 5 10 15 20 25 30 35 40 Function value Function value F2 0 50 100 125Function value Function value F3 0 0.5 1 1.5 2 2.5 3 3.5 4 F4 0 1000 2000 3000 4000 5000 Function value F5 0 5 10 15 Function value F6 0 500 1000 1500 1700 Function value F7 0 20 40 60 80 90 Function value F8 0 5 10 15 Function value F9 0.398 0.3985 0.399 0.3995 0.4
LSA BSA GSA PSO
QLSA LSA BSA GSA PSO QLSA LSA BSA GSA PSO
QLSA LSA BSA GSA PSO QLSA LSA BSA GSA PSO
QLSA LSA BSA GSA PSO QLSA LSA BSA GSA PSO
QLSA LSA BSA GSA PSO QLSA LSA BSA GSA PSO QLSA LSA BSA GSA PSO
Function value
F10
Fig. 1 The global optimization performance assessment of QLSA, LSA, BSA, GSA and PSO under different benchmark functions. aThe global optimisation results for QLSA, LSA, BSA, GSA and PSO in benchmark function F1 (Sphere) is obtained based on dimension problem, search space and function minimum (Supplementary Table 1).bThe global optimisation results for QLSA, LSA, BSA, GSA and PSO in benchmark function F2 (Step) is obtained based on dimension problem, search space and function minimum (Supplementary Table 1).cThe global optimisation results for QLSA, LSA, BSA, GSA and PSO in benchmark function F3 (Quartic).dThe global optimisation results for QLSA, LSA, BSA, GSA and PSO in benchmark function F4 (Schwefel 2.22).eThe global optimisation results for QLSA, LSA, BSA, GSA and PSO in benchmark function F5 (Schwefel 1.2).fThe global optimisation results for QLSA, LSA, BSA, GSA and PSO in benchmark function F6 (Schwefel 2.21) is obtained based on dimension problem, search space and function minimum (Supplementary Table 1).gThe global optimisation results for QLSA, LSA, BSA, GSA and PSO in benchmark function F7 (Rosenbrock).hThe global optimisation results for QLSA, LSA, BSA, GSA and PSO in benchmark function F8 (Rastrigin).iThe global optimisation results for QLSA, LSA, BSA, GSA and PSO in benchmark function F9 (Foxholes).jThe global optimisation results for QLSA, LSA, BSA, GSA and PSO in benchmark function F10 (Branin) is obtained based on dimension problem, search space and function minimum (Supplementary Table 1).
Consequently, the MAE, RMSE and SD of QLSAF are 1.6872%,
6.5379% and 6.4662%, respectively (Supplementary Table 7). In
summary, QLSAF has enhanced overshoot (OS) and settling time
(ST) compared with other methods under different speeds and
load operations. Furthermore, QLSAF achieves lower MAE,
RMSE and SD than other controllers under different load
conditions.
The DTUTD step SR under different load conditions is a
challenging test to explore. Figure
4
g shows the step DTUTD SR,
where the speed is altered from 35 rad/s to 70 rad/s at 0.25 s, from
70 rad/s to 105 rad/s at 0.5 s and from 105 rad/s to 140 rad/s at
0.75 s at no-load condition. Meanwhile, the peak SCs vary at 0.45
A with 12.5 Hz, 0.55 A with 25 Hz, 0.6 A with 37.5 Hz and 0.65 A
with 50 Hz. Figure
4
h shows SRs that are identical to those in
Fig.
4
g. However, the peak SCs change at 0.7 A with 12.5 Hz, 0.9
A with 25 Hz, 1 A with 37.5 Hz and 1.05 A with 50 Hz at 1 Nm
load condition. The MAE, RMSE and SD achieved by QLSA are
0.7977%, 4.6566% and 4.6430%, respectively (Supplementary
Table 8). In Fig.
4
i, the DTUTD step SR changes from 70 rad/s to
105 rad/s at 0.3 s, from 105 rad/s to 140 rad/s at 0.6 s and returns
to its original speed at 2 Nm condition at 0.9 s. Meanwhile, the
peak SCs vary at 0.95 A with 25 Hz, 1.05 A with 37.5 Hz and 1.15
A with 50 Hz. Accordingly, QLSA obtains low steady state error,
indicating that the MAE, RMSE and SD values are 1.1879%,
7.7192% and 7.6507%, respectively (Supplementary Table 8). In
all cases, the SCs change with the variation of speed and load
under the identical SR. The proposed QLSAF controller is also
observed to be superior to other controllers in terms of achieving
low MAE, RMSE and SD under each step change in speed or load.
The capability of the proposed controller is further assessed on
the basis of the RS test under different load and speed conditions
(Supplementary Fig. 8). The ramp SR increases from a speed of
105 rad/s to 140 rad/s at 0.2 s under the no-load condition and
then continues with the same repetition speed changes
(Supple-mentary Fig. 8a). Meanwhile, the gradual change in SCs is
observed with respect to frequency. Supplementary Figure 8b
shows an SR similar to that in Supplementary Fig. 8a, except that
the load is changed to 2 Nm. The MAE, RMSE and SD are
3.5827%, 17.4315% and 17.0585%, respectively (Supplementary
Table 9). The RS alters from a speed of 70 rad/s to 140 rad/s
under the no-load condition and then continues at the same
repetition speed change (Supplementary Fig. 8c). In the
mean-time, the gradual change in SC is observed with the change in
frequency. The shape of supplementary Fig. 8(c, d) is relatively
similar in terms of ramp SR. Nevertheless, the SCs operate under
2 Nm load. Accordingly, QLSA achieves MAE, RMSE and SD of
2.0831%, 11.1266% and 10.9286%, respectively (Supplementary
Table 9). The change in ramp speed is executed from 35 rad/s to
140 rad/s under no load and 1 Nm load conditions
(Supplemen-tary Fig. 8e, f). Although the change in ramp SR remains
unchanged without load and at 1 Nm load condition, the SCs
increase with the application of load. Generally, the QLSAF
0 100 200 300 400 500 0 1 2 3 4 5 6 7 8× 10 4
a
e
f
g
i
j
h
b
c
d
× 105 × 108 × 104 × 1011 Iteration Iteration Function value 0 1 2 3 4 5 6 7 8 Function value F1 QLSA LSA BSA GSA PSO 0 100 200 300 400 500 F2 QLSA LSA BSA GSA PSO 0 100 200 300 400 500 0 20 40 60 80 100 120 140 Iteration Function value F3 0 100 200 300 400 500 0 2 4 6 8 Iteration Function value F4 0 100 200 300 400 500 0 0.5 1 1.5 2 Iteration Function value F5 QLSA LSA BSA GSA PSO 0 100 200 300 400 500 0 20 40 60 80 100 Iteration Function value F6 QLSA LSA BSA GSA PSO 0 100 200 300 400 500 0 0.5 1 1.5 2 2.5 3 Iteration Function value F7 QLSA LSA BSA GSA PSO 0 100 200 300 400 500 0 100 200 300 400 500 Iteration Function value F8 QLSA LSA BSA GSA PSO 0 100 200 300 400 500 0 10 20 30 40 50 Iteration Function value F9 QLSA LSA BSA GSA PSO 0 100 200 300 400 500 0 0.5 1 1.5 2 2.5 Iteration Function value F10 QLSA LSA BSA GSA PSO QLSA LSA BSA GSA PSO QLSA LSA BSA GSA PSOFig. 2 The convergence characteristics performance evaluation of QLSA, LSA, BSA, GSA and PSO under different benchmark functions. aConvergence characteristic curves for QLSA, LSA, BSA, GSA and PSO in benchmark function F1 (Sphere).bConvergence characteristic curves for QLSA, LSA, BSA, GSA and PSO in benchmark function F2 (Step).cConvergence characteristic curves for QLSA, LSA, BSA, GSA and PSO in benchmark function F3 (Quartic).d
Convergence characteristic curves for QLSA, LSA, BSA, GSA and PSO in benchmark function F4 (Schwefel 2.22).eConvergence characteristic curves for QLSA, LSA, BSA, GSA and PSO in benchmark function F5 (Schwefel 1.2).fConvergence characteristic curves for QLSA, LSA, BSA, GSA and PSO in benchmark function F6 (Schwefel 2.21).gConvergence characteristic curves for QLSA, LSA, BSA, GSA and PSO in benchmark function F7 (Rosenbrock).h
Convergence characteristic curves for QLSA, LSA, BSA, GSA and PSO in benchmark function F8 (Rastrigin).iConvergence characteristic curves for QLSA, LSA, BSA, GSA and PSO in benchmark function F9 (Foxholes).jConvergence characteristic curves for QLSA, LSA, BSA, GSA and PSO in benchmark function F10 (Branin).
controller is superior to other controllers with respect to OS and
ST under different cases of ramp speed changes. In addition,
QLSAF has lower MAE, RMSE and SD compared with other
controllers under changing speed and load conditions. The
effectiveness and robustness of the proposed QLSAF in
comparison to PID controller is evaluated under two experiments
including constant torque with speed variation and constant
speed with torque variation (Supplementary Note 5,
Supplemen-tary Figs. 10
–
13 and Supplementary Tables 10, 11).
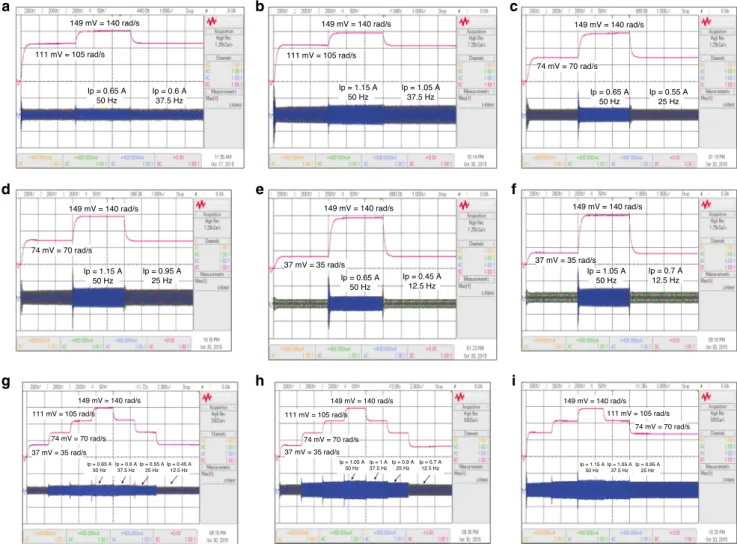
Experimental results of DSP-based QLSAF speed controller
.
The accuracy and effectiveness QLSAF speed controller are
validated under the experimental environment using similar tests
executed in MATLAB/Simulink. The experimental tests resulting
in the step SRs with varying speeds and load conditions are
depicted in Fig.
5
. The KEYSIGHT DSO-X2024A oscilloscope is
used to monitor the experimental results using four channels for
1 s/Div. The a, b and c phases of SCs are observed using three
channels with 200 mA/Div, and the SR is recorded using the
fourth channel with 50 mV/Div. The experimental test results are
nearly aligned with the simulation results. Figure
5
a demonstrates
that the SR of the motor accelerates from 105 rad/s to 140 rad/s at
3 s under no-load condition. Subsequently, the motor speed
returns to 105 rad/s from 140 rad/s at 6 s, and the peak SCs vary
from 0.6 A to 0.65 A at 37.5 Hz and 50 Hz, respectively. This
result proves that a proportional relationship exists between speed
and frequency. A similar type of SR is shown in Fig.
5
b, but the
change in SCs is reported from 1.05 A to 1.15 A because of the
execution of the 2 Nm load. Figure
5
c illustrates the change in
speed under the no-load condition from 70 rad/s to 140 rad/s at 3
s and then drops to 70 rad/s at 6 s without OS. The peak SCs vary
from 0.55 A to 0.65 A at 25 and 50 Hz. Figure
5
c, d are similar
with respect to SRs, except for the peak SCs, which increase from
0.95 A to 1.15 A under 2 Nm load situation. Figure
5
shows the
increase in speed from 35 rad/s to 140 rad/s at 3 s and then
decrease to 35 rad/s at 6 s without any OS under no-load
con-dition. At this time, the peak SCs also increase from 0.45 A to
0.65 A with 12.5 and 50 Hz. The changes in SR in Fig.
5
d, f are
analogous. Nonetheless, the increment in peak SCs is from 0.7 A
to 1.05 A because of the 1 Nm loading.
The DTUTD step speed tests are also implemented in the
experimental tests. The oscilloscope image for the experimental
results of the DTUTD step response test is shown in Fig.
5
g, i. In
Fig.
5
g, the DTUTD step SR changes at 2.5 s as a step response
from 35 rad/s to 70 rad/s, at 5 s from 70 rad/s to 105 rad/s, at 7.5
rad/s from 105 rad/s to 140 rad/s and then return step by step to
quarter speed without applying load. Meanwhile, the SCs change
with the variation of speed and frequency. Figure
5
h shows the
same SR as that of Fig.
5
g. However, the SCs vary due to the
change in frequency and the implementation of 1 Nm load to the
TIM. In Fig.
5
i, the DTUTD step SR changes from 70 rad/s to 105
rad/s at 3 s, from 105 rad/s to 140 rad/s at 6 s and then returns step
by step to half speed with 2 Nm load. In the meantime, the
frequency of the SCs changes with the variation of speed and
increment of loading on the TIM.
The experiments are also conducted on the basis of RS tests
(Supplementary Fig. 9). The experimental reports match the
simulation outcomes. Nevertheless, the results are recorded in the
time scale of 1 s/Div. The ramp SR changes from 105 rad/s to 140
rad/s at 2 s and continues with a similar SR without loading, in
which a gradual change in SCs is observed with its frequency
(Supplementary Fig. 9a). The variation of ramp SR in
Supple-mentary Fig. 9a, b is similar. However, the increment in the SCs is
reported with the execution of 2 Nm load. The ramp SR varies
from 70 rad/s to 140 rad/s at 2 s and continues with a similar result
without loading, in which the SCs change increasingly with
frequency (Supplementary Fig. 9c). The RSs in supplementary
Fig. 9c, d are identical. However, the SC increases under a 2 Nm
load. Similar results are also noted in supplementary Fig. 9e, f, in
which ramp speed changes from 35 rad/s to 140 rad/s at no-load
and 1 Nm load conditions, respectively. Thus, the TIM operated
under no-load and load conditions does not affect the ramp SR.
Nevertheless, SCs differ with the load increment and change of
ramp speed. The experimental results (Supplementary Fig. 9)
0 20 40 60 80 100 120 140 160 180 200 0.0225 0.023 0.0235 0.024 0.0245
a
b
c
d
e
Iteration Objective function QLSAF LSAF BSAF GSAF PSOF –3 –2 –1 0 1 2 3 0 0.5 1 Error (e)Degree of membership function
Ne3 Ne2 Ne1 Ze Pe1 Pe2 Pe3
–3 –2 –1 0 1 2 3 0
0.5 1
Change of error (de)
Degree of membership function
Nde2 Pde1 Pde2 Pde3 Nde3 Nde1 Zde
–6 –4 –2 0 2 4 6 0
0.5 1
Output
Degree of membership function
NB NM NS Z PS PM PB –3 –2 –1 0 1 2 3 –3 –2 –1 0 1 2 3 –2 0 2 4 e de Output
Fig. 3 The optimization results of QLSA. aThe objective function assessment results of QLSA, LSA, BSA, GSA and PSO in convergence characteristics curve.bOptimized membership function for error.cOptimized membership function for change of error.dOptimized membership function for output.e
Three-dimensional relationship among error, change of error and output.
under the ramp SRs are consistent with the simulation results
(Supplementary Fig. 8), thereby validating the satisfactory solution
using the QLSAF speed controller.
Discussion
An advanced optimisation technique called QLSA is designed to
address the optimisation problems of the controller in TIM drive.
In addition, an improved FLC controller has been developed to
control the TIM drive using the QLSA algorithm. The QLSA
controller is implemented on the DSP-TMS320F28335 control
board to carry out the validation processes.
The
fi
rst contribution of this research is the establishment and
assessment of the reliability and ef
fi
ciency of QLSA using 14
benchmark functions with different characteristics. The
com-parative validation is performed between QLSA and other notable
optimisation techniques, such as the LSA, BSA, GSA and PSO
algorithms. The results indicate that the developed QLSA delivers
excellent solutions in comparison with LSA, BSA, GSA and PSO
algorithms in terms of exploration, exploitation capability and
convergence speed.
The second contribution reveals that the design of the
QLSA-based FSC achieves high performance in TIM. The optimal
control of TIM is achieved by designing the input and output
MFs of the FSC with the lowest value of the OF. Hence, the
traditional TE method can be avoided. A detailed comparative
analysis between QLSAF and other well-known controllers is
carried out under changing speed and load environments. The
reposts demonstrate that the proposed QLSAF speed controller
exhibits superior performance to other controllers with regard to
robustness, reduction of damping and improvement of transient
responses.
20 40 60 80 100 120 140 160a
b
c
d
e
f
g
h
i
Speed (rad/s) 0 0.1 0.2 0.3 0.4 0.5 0.6 0.7 0.8 0.9 1 –2 –1 0 1 2 Time (s) iabc (A) 20 40 60 80 100 120 140 160 Speed (rad/s) –2 –1 0 1 2 iabc (A) PSOF GSAF BSAF LSAF QLSAF 140 rad/s 105 rad/s Ip = 0.65 A 50 Hz Ip = 0.6 A 37.5Hz 0 0.1 0.2 0.3 0.4 0.5 0.6 0.7 0.8 0.9 1 Time (s) PSOF GSAF BSAF LSAF QLSAF 105 rad/s 140 rad/s Ip = 1.05 A 37.5 Hz Ip = 1.15 A 50 Hz 20 40 60 80 100 120 140 160 180 Speed (rad/s) 0 0.1 0.2 0.3 0.4 0.5 0.6 0.7 0.8 0.9 1 –2 –1 0 1 2 Time (s) iabc (A) PSOF GSAF BSAF LSAF QLSAF Ip = 0.65 A 50 Hz Ip = 0.55 A 25 Hz 70 rad/s 140 rad/s 20 40 60 80 100 120 140 160 Speed (rad/s) 0 0.1 0.2 0.3 0.4 0.5 0.6 0.7 0.8 0.9 1 –2 –1 0 1 2 Time (s) iabc (A) PSOF GSAF BSAF LSAF QLSAF Ip = 1.15 A 50 Hz 140 rad/s 70 rad/s Ip = 0.95 A 25 Hz 20 40 60 80 100 120 140 160 180 Speed (rad/s) 0 0.1 0.2 0.3 0.4 0.5 0.6 0.7 0.8 0.9 1 –2 –1 0 1 2 Time (s) iabc (A) PSOF GSAF BSAF LSAF QLSAF 140 rad/s 35 rad/s Ip = 0.65 A 50 Hz Ip = 0.45 A 12.5Hz 20 40 60 80 100 120 140 160 180 Speed (rad/s) 0 0.1 0.2 0.3 0.4 0.5 0.6 0.7 0.8 0.9 1 –2 –1 0 1 2 Time (s)Time (s) Time (s) Time (s)
iabc (A) PSOF GSAF BSAF LSAF QLSAF 140 rad/s 35 rad/s Ip = 1.05 A 50 Hz Ip = 0.85 A 12.5 Hz 20 40 60 80 100 120 140 160 Speed (rad/s) 0 0.25 0.5 0.75 1 1.25 1.5 1.75 2 –2 –1 0 1 2 iabc (A) PSOF GSAF BSAF LSAF QLSAF Ip = 0.6 A 37.5 Hz Ip = 0.65 A 50 Hz Ip = 0.45 A 12.5 Hz Ip = 0.55 A 25 Hz 35 70 105 140 20 40 60 80 100 120 140 160 Speed (rad/s) 0 0.25 0.5 0.75 1 1.25 1.5 1.75 2 –2 –1 0 1 2 iabc (A) PSOF GSAF BSAF LSAF QLSAF 35 70 105 140 Ip = 0.75 A 12.5 Hz Ip = 0.9 A 25 Hz Ip = 1 A 37.5 Hz Ip = 1.05 A 50 Hz 20 40 60 80 100 120 140 160 Speed (rad/s) 0 0.3 0.6 0.9 1.2 1.5 1.8 2 –2 –1 0 1 2 iabc (A) PSOF GSAF BSAF LSAF QLSAF 105 140 70 Ip = 1.15 A 50 Hz Ip = 1.05 A 37.5 Hz Ip = 0.95 A 25 Hz
Fig. 4 Simulation results under step response test and down-to-up-to-down test. aQLSA performance in step response test under the speed varying from 105 rad/s to 140 rad/s with no-load.bQLSA performance in step response test under the speed varying from 105 rad/s to 140 rad/s with 2 Nm load.
cQLSA performance in step response test under the speed varying from 70 rad/s to 140 rad/s with no-load.dQLSA performance in step response test under the speed varying from 70 rad/s to 140 rad/s with 2 Nm load.e. QLSA performance in step response test under the speed varying from 35 rad/s to 140 rad/s with no-load and,f. QLSA performance in step response test under the speed varying from 35 rad/s to 140 rad/s with 1 Nm load.gQLSA performance in down-to-up-to-down test under the speed varying from 35 rad/s to 70 rad/s, from 70 rad/s to 105 rad/s and from 105 rad/s to 140 rad/s at no-load.hQLSA performance in down-to-up-to-down test under the speed varying from 35 rad/s to 70 rad/s, from 70 rad/s to 105 rad/s, from 105 rad/ s to 140 rad/s at 1 Nm load.iQLSA performance in down-to-up-to-down test under the speed varying from 70 rad/s to 105 rad/s, from 105 rad/s to 140 rad/s at 2 Nm load.
The third contribution is the implementation of the QLSAF
speed control system using a low-cost single-chip
DSP-TMS320F28335 control board. The QLSAF speed controller for
TIM drive in real-time includes the implementation of
analogue-digital conversion, enhanced pulse width modulation, enhanced
quadrature encoder pulse (eQEP) and space vector pulse width
modulation (SVPWM). Subsequently, the prototype is developed
by utilising the DSP-TMS320F28335 controller board. The
real-time performance of the inverter behaviour is monitored by
developing a graphical user interface programme in code
com-poser studio (CCS) software.
The fourth contribution demonstrates the validation and
ver-i
fi
cation between the simulation and experimental systems. The
outcomes under simulation and experimental environments
con
fi
rm that the proposed QLSAF-based TIM drive system can
ef
fi
ciently handle the changes in the load and speed conditions
smoothly. Indeed, the simulation results are better than the
experimental results due to the ideal aspects of the simulation.
Therefore, the simulation results are perfectly matched with the
experimental results. Therefore, the proposed QLSAF speed
controller, with its low-cost prototype, could be a potential
can-didate for industrial multi induction motor drive systems. It will
be interesting to extend this approach to other controllers such as
fuzzy type-2 control or hybrid FLC-PID control in the
multi-induction motor drive system.
Methods
QLSA development process. LSA50is a modern and enhanced optimisation technique, which is designed using the concept of the natural phenomenon of lightning. This research has enhanced the LSA computational capability on the basis of quantum mechanics. We have studied the fundamental principle of LSA and then further improved the searching capability by defining a new position for the population to achieve the best solutions. Global step leadersðGslt
ijÞof QLSA are
initially determined by assessing the average values of the best locations, leading to the lowest value of the assessment. The global minimum and best position of QLSA are achieved through the attraction and convergence of each step leader. The equation for stochastic attractor of step leaderspjis as follows:
pt ij¼ atij:Pt ij;bestþbtij:Gsltij ctij:SF ; ð1Þ 149 mV = 140 rad/s 111 mV = 105 rad/s Ip = 0.65 A 50 Hz Ip = 0.6 A 37.5 Hz 149 mV = 140 rad/s 111 mV = 105 rad/s Ip = 1.15 A 50 Hz Ip = 1.05 A 37.5 Hz 149 mV = 140 rad/s 74 mV = 70 rad/s Ip = 0.65 A 50 Hz Ip = 0.55 A 25 Hz
a
b
c
149 mV = 140 rad/s 74 mV = 70 rad/s Ip = 1.15 A 50 Hz Ip = 0.95 A 25 Hz 149 mV = 140 rad/s 37 mV = 35 rad/s Ip = 0.65 A 50 Hz Ip = 0.45 A 12.5 Hz 149 mV = 140 rad/s 37 mV = 35 rad/s Ip = 1.05 A 50 Hz Ip = 0.7 A 12.5 Hzd
e
f
149 mV = 140 rad/s 111 mV = 105 rad/s 74 mV = 70 rad/s 37 mV = 35 rad/s Ip = 0.45 A 12.5 Hz Ip = 0.65 A 50 Hz Ip = 0.55 A 25 Hz Ip = 0.6 A 37.5 Hz 149 mV = 140 rad/s 111 mV = 105 rad/s 74 mV = 70 rad/s 37 mV = 35 rad/s Ip = 1.05 A 50 Hz Ip = 1 A 37.5 Hz Ip = 0.9 A 25 Hz Ip = 0.7 A 12.5 Hz 149 mV = 140 rad/s Ip = 1.15 A 50 Hz 111 mV = 105 rad/s 74 mV = 70 rad/s Ip = 1.05 A 37.5 Hz Ip = 0.95 A 25 Hzg
h
i
Fig. 5 Experimental results under step response test and down-to-up-to-down test. aQLSA performance in step response test under the speed varying from 105 rad/s to 140 rad/s with no-load.bQLSA performance in step response test under the speed varying from 105 rad/s to 140 rad/s with 2 Nm load.
cQLSA performance in step response test under the speed varying from 70 rad/s to 140 rad/s with no-load.dQLSA performance in step response test under the speed varying from 70 rad/s to 140 rad/s with 2 Nm load.eQLSA performance in step response test under the speed varying from 35 rad/s to 140 rad/s with no-load and,fQLSA performance in step response test under the speed varying from 35 rad/s to 140 rad/s with 1 Nm load.gQLSA performance in down-to-up-to-down test under the speed varying from 35 rad/s to 70 rad/s, from 70 rad/s to 105 rad/s and from 105 rad/s to 140 rad/s at no-load.h. QLSA performance in down-to-up-to-down test under the speed varying from 35 rad/s to 70 rad/s, from 70 rad/s to 105 rad/s, from 105 rad/s to 140 rad/s at 1 Nm load.iQLSA performance in down-to-up-to-down test under the speed varying from 70 rad/s to 105 rad/s, from 105 rad/s to 140 rad/s at 2 Nm load.
fori=1,2,…,N,j=1,2,…,D, andt=1,2,…,T, whereN, DandTrepresent the population size, the problem dimension and the maximum number of iteration, respectively;a, bandcdefine the random numbers between 0 and 1, which are uniformly distributed;Pt
ij;bestis the best step leader for each population;SFis the
scale factor, which is recommended to assign between 4 and 20. We set the scale factorSFto 10 to execute QLSA.
Each step leader of LSA is assumed to hold a quantum behaviour and its quantum state is expressed by a wave functionðψwÞ. The probability density
function is denoted by ψw 2
, which has a potential that is subject to the potential
field, where the step leader lies. The centre point of search space in each step leader is located betweenPt
ij;bestandGsltij. The mathematical expression of wave function
after (t+1) iteration is denoted as51,52,
ψ Ptþ1 ij ¼ 1ffiffiffiffiffi Lt ij q exp Pt ijptij =Lt ij ; ð2Þ whereLt
ijstands for the SD of the double exponential distribution, which changes
after each iteration numbert. The double exponential distribution is characterised by the probability density functionQ, which can be written as follows:
Q Ptþ1 ij ¼ ψ Ptþ1 ij 2¼L1t ij exp 2Pt ijptij =Lt ij : ð3Þ In turn, the probability distribution functionMfcan be formulated as follows:
Mf Ptijþ1 ¼1exp 2 Pt ijptij =Lt ij : ð4Þ
Thejthcomponent of position
Piafter the iteration (t+1) can be obtained on
the basis of the Monte Carlo method, as expressed in the following equation:
Ptþ1 ij ¼ptij± 1 2L t ijln 1=uij ; ð5Þ
whereμijdenotes a random number, which is distributed uniformly between 0 and
1. The SDðLt
ijÞof each step leader is estimated using the following equation:
Lt
ij¼2βMbestjtPijt; ð6Þ
where the mean best position for the step leader is represented byMeanBestt
j and
can be defined as the mean value of thePt
ij;bestpositions of all step leaders.Mbesttjof
the step leader can be written as follows:
MeanBesttj¼ 1 N XN i¼1 Pijt¼ 1 N XN i¼1 Pti1;1 N XN i¼1 Pti2;1 N XN i¼1 Pti3;¼ ¼;1 N XN i¼1 Ptij ! : ð7Þ The contraction expansion coefficient (β) controls the convergence speed of QLSA, which can be written as follows:
β¼β0þðTtÞ:
β1β0
T ; ð8Þ
whereβ0andβ1represent the initial andfinal values of the contraction expansion,
respectivelytandTimply the current and maximum iteration number, respectively. The value ofβ1is set between 0.8 and 1.2, andβ0is set below 0.6 to
achieve satisfactory QLSA performance51. Therefore, the updated position of step leadersPt
ijcan be formulated as follows:
Ptþ1
ij ¼ptij±βMeanBesttjPijtln 1=uij
: ð9Þ QLSA has several advanced features compared with the original LSA. Firstly, the QLSA utilises the exponential distribution function tofind the new locations between the step leaders through the global convergence. Secondly, the original LSA is enhanced by assessing the mean best position. The new distribution of the step leader is controlled by the distance between step leaders andMeanBestt
j, as
expressed in Eq. (9) (Supplementary Fig. 1).
QLSA verification process. A group of 14 benchmark functions50,53,54was used to validate the accuracy and convergence characteristics of QLSA (Supplementary Table 1). These benchmark functions were characterised into four testing groups. Thefirst group used unimodal and separable functions, including Sphere (F1), Step (F2) and Quartic (F3) to check the strength, reliability and strength, respectively. The second group used unimodal and nonseparable functions, including Schwefel 2.22 (F4), Schwefel 1.2 (F5), Schwefel 2.21 (F6) and Rosenbrock (F7), to assess the performance and consistency. The third group utilised multimodal and separable functions, such as Rastrigin (F8), Foxholes (F9) and Branin (F10), to evaluate the dimensionality problems. The fourth group used multimodal and nonseparable high- and low-dimensional benchmark functions, including Ackley (F11), Grie-wank (F12), Penalised (F13) and Penalised 2 (F14), to verify the exploration and exploitation capability.
The performance of QLSA was compared with four prominent optimisation techniques, namely, LSA50, BSA55, GSA56and PSO57(Supplementary Notes 1–4, and Supplementary Figs. 2–5). In addition, each benchmark function was tested 50 times. All the optimisation algorithms were operated using a population size of 50
and 500 iterations. In LSA, channel time was set to 10. In BSA, the control parameter,F, was set to 3. In GSA, the gravitational constantG0and accelerationα
were 100 and 20, respectively. In PSO, the acceleration coefficientsc1,c2and weight
factorwwere 1.5 and 0.5, respectively.
Fuzzy logic speed controller using QLSA. The fuzzy logic speed controller is well-known because of its simplicity and low implementation cost58–60. In addi-tion, FLC exhibits strong performance in nonlinear controller systems without designing any mathematical model61–64. The fuzzy speed control has many para-meters, such as the MF parapara-meters, number of the rule base and number of the
MFs65–67. The fuzzy speed control can be improved by optimising the value of
these parameters. The FSC is designed using various steps68,69. Thefirst step is the knowledge-based approach, which is used to select the position of fuzzy MFs and the number of inputs and outputs. In this research, the input data of FLC for the TIM speed control included error (e) and change of error (de) for rotor speed (ωrm), as presented in the following equations:
e tð Þ ¼ω*rmωrmð Þt; ð10Þ
de tð Þ ¼e tð Þ e tð 1Þ; ð11Þ The second step characterises the inputs with convenient linguistic value or level; for instance,“big”,“medium”or“small”. The trapezoidal and triangular MFs re applied to represent the error and change of error for the FSC of MFs. The error
μe(e) and change of errorμde(de) are defined by variables, namely, (A0,A1,A2) and
(B0,B1,B2), respectively, which can be written as follows:
μeð Þ ¼e eA0 A1A0A0≤e < A1 eA2 A1A2A1≤e < A2 8 < : ð12Þ μdeð Þ ¼de deB0 B1B0B0≤de < B1 deB2 B1B2B1≤de < B2 8 < : ð13Þ
The third stage describes the control rules and linguistic terms of fuzzy logic to make the appropriate decisions for TIM. Generally, the inference systems are structured either using Mamdani method or Takagi–Sugeno method. In this study, Mamdani is applied because of its simple design and structure. The fuzzy rules are established using the if–then linguistic term, and output MFs are determined between the inputs (e, de) and the output (ωsl). A total of 49 rules are developed for
controlling TIM (Supplementary Table 2) and illustrated in the following equations:
Rule 1: Ifeis‘Ne3’AND deis‘Nde3’THENωslis“NB”.
Rule 2: Ifeis‘Ne3’AND deis‘Nde2’THENωslis“NB”.
... ...
Rule 48: Ifeis‘Pe2’AND deis‘Pde3’THENωslis“PB”.
Rule 49: Ifeis‘Pe3’AND deis‘Pde3’THENωslis“PB”.
Thefinal step of the FLC is called defuzzification. This process involves the adjustment, generation and control of crisp value in the output MFs. In this research, the centre of gravity is considered to express the crisp values, as shown in the following equation:
Ocrisp¼ Pn iwi:ui Pn iwi ; ð14Þ
wheren, uandwdenote the number of rules, output MFs and weight coefficient, respectively. The minimum values ofμe(e) andμde(de) are used to define weights,
which can be expressed as follows:
wi¼minμeð Þe;μdeð Þde
: ð15Þ
Objective function formulation. The optimal value of MFs is achieved by asses-sing the minimum value of the OF which in turn enhances the accuracy and robustness in the FLC output. In this work, the error in TIM was uniformly distributed, thus MAE was selected as the OF to explain the system performance70. The MAE function is estimated using the following equation58,
OF¼Min MAE¼1lXM
m¼1
ω*
rmωrm
!; ð16Þ
wherelis the number of samples, andω*rmandωrmare the reference speed and
rotor speed, respectively.
Optimisation limitations for FLC. The constraints are selected to enforce the limit of MFs in FLC. Thus, the updated values of MFs are always inside the boundary whilst the QLSA attempts to accomplish the preferred OF. For example, the variable of MFsX2
tackle this issue, the limitations are imposed as depicted in the following equation:
XP1
ij < XPij< XPijþ1: ð17Þ
After the algorithm development, QLSAF is compared with LSAF, BSAF, GSAF and PSOF algorithms using step response test, DTUTD step SR test and RS test with the same population size (30) and iteration numbers (200) to conduct a fair evaluation. In general, MAE, RMSE, and SD are the common statistical error rate terms used for the assessment and verification of controller and optimization algorithms performance. Moreover, the evaluations of uncertainty and statistical sensitivity analysis are calculated by MAE, RMSE, and SD values obtained under defined conditions. This paper introduces an optimal fuzzy algorithm for dealing the uncertainty to obtain the probability distributions for effective uncertainty and statistical sensitivity analysis. Accordingly, the different statistical error rate terms including MAE, RMSE and SD are applied to verify the performance of QLSA. The mathematical expressions of RMSE and SD are as follows70:
RMSE¼ ffiffiffiffiffiffiffiffiffiffiffiffiffiffiffiffi 1 l XH m¼1 e2 m v u u t ð18Þ SD¼ ffiffiffiffiffiffiffiffiffiffiffiffiffiffiffiffiffiffiffiffiffiffiffiffiffiffiffiffiffi 1 l XH m¼1 emη ð Þ2 v u u t ð19Þ
whereemis the error between the reference speed and estimated speed,lis the
number of samples, andηis the average values of error.
Experimental setup. The block diagram of the closed loop scalar control for TIM drive is provided in Supplementary Fig. 14. Five different capacities of TIMs are used in this experiment (Supplementary Fig. 15). However, we have only shown the result analysis and discussion for the Motor 1 (0.5 HP) because of space limitation. The DSP control programme was written in MATLAB/Simulink in real time and interfaced with CCS at 1 µs sampling time. In the beginning, the proposed con-troller sent voltage to the selector motor circuit of the connected TIM. Subse-quently, the DSP received the measured DC SC of the connected TIM. The QLASF speed controller then determined the optimal MF parameters for the connected TIM. The DSP control programme also received the actual rotor position through eQEP and converted this position into rotor speed. The QLASF speed controller allowed the actual speed to track the reference speed. The feedback signal of the rotor speed was provided by the controller to generate the required inverter fre-quency that drives the TIM. V/f control wasfixed to generate a peak voltage and the required frequency for that speed. Then, the SVPWM technique received two input voltages (i.e.VαandVβ) and generated switching signals for the inverter insulated-gate bipolar transistor (IGBTs) to facilitate the smooth operation of the TIM drive. The C-code was generated automatically by MATLAB/Simulink interfaced by the CCS. Then, this code was built in the DSP-TMS320F28335 chip and generated the appropriate switching for the IGBTs. The DSP was connected through eQEP and the actual rotor speed of the TIM was monitored by the rotary encoder. The DSP generated the six PWM signals and then transferred these signals to the IGBTs through gate drives, delivering the required power to operate the TIM.
Data availability
The data that support thefindings of this study are available from the corresponding authors upon reasonable request.
Code availability
The software code and the examined cases that validated our method are available from the corresponding authors upon reasonable request.
Received: 22 March 2020; Accepted: 2 July 2020;
References
1. Hannan, M. A., Ali, J. A., Mohamed, A. & Uddin, M. N. A random forest regression based space vector PWM inverter controller for the induction motor drive.IEEE Trans. Ind. Electron.64, 2689–2699 (2017).
2. Tariq, M. F., Khan, A. Q., Abid, M. & Mustafa, G. Data-driven robust fault detection and isolation of three-phase induction motor.IEEE Trans. Ind. Electron.66, 4707–4715 (2019).
3. Jiang, S. B., Wong, P. K., Guan, R., Liang, Y. & Li, J. An efficient fault diagnostic method for three-phase induction motors based on incremental broad learning and non-negative matrix factorization.IEEE Access7, 17780–17790 (2019).
4. Venkataramana Naik, N., Panda, A. & Singh, S. P. A three-level fuzzy-2 DTC of induction motor drive using SVPWM.IEEE Trans. Ind. Electron.63, 1467–1479 (2016).
5. Kahingala, T. D., Perera, S., Jayatunga, U., Agalgaonkar, A. P. & Ciufo, P. Estimation of voltage unbalance attenuation caused by three-phase induction motors: an extension to distribution system state estimation.IEEE Trans. Power Deliv.34, 1853–1864 (2019).
6. De Almeida, A., Fong, J., Brunner, C. U., Werle, R. & Van Werkhoven, M. New technology trends and policy needs in energy efficient motor systems–A major opportunity for energy and carbon savings.Renew. Sustain. Energy Rev.
115, 109384 (2019).
7. Singh, M. & Shaik, A. G. Faulty bearing detection, classification and location in a three-phase induction motor based on Stockwell transform and support vector machine.Measurement131, 524–533 (2019).
8. Cunha Palácios, R. H., Da Silva, I. N., Goedtel, A. & Godoy, W. F. A comprehensive evaluation of intelligent classifiers for fault identification in three-phase induction motors.Electr. Power Syst. Res.127, 249–258 (2015). 9. Saleem, A., Issa, R. & Tutunji, T. Hardware-In-the-Loop for on-line
identification and control of three-phase squirrel cage induction motors.
Simul. Model. Pract. Theory18, 277–290 (2010).
10. Linares-Flores, J., Guerrero-Castellanos, J. F., Lescas-Hernández, R., Hernández-Méndez, A. & Vázquez-Perales, R. Angular speed control of an induction motor via a solar powered boost converter-voltage source inverter combination.Energy166, 326–334 (2019).
11. Kwak, B., Um, J. H. & Seok, J. K. Direct active and reactive power control of three-phase inverter for AC motor drives with small DC-link capacitors fed by single-phase diode rectifier.IEEE Trans. Ind. Appl.55, 3842–3850 (2019).
12. Jannati, M. et al. A review on variable speed control techniques for efficient control of Single-Phase Induction Motors: Evolution, classification, comparison.Renew. Sustain. Energy Rev.75, 1306–1319 (2017). 13. Duranay, Z. B. & Guldemir, H. Selective harmonic eliminated V/f speed
control of single-phase induction motor.IET Power Electron.11, 477–483 (2018).
14. Hsu, C. H. Fractional order PID control for reduction of vibration and noise on induction motor.IEEE Trans. Magn.55, 6700507 (2019).
15. Somwanshi, D., Bundele, M., Kumar, G. & Parashar, G. Comparison of fuzzy-PID and fuzzy-PID controller for speed control of DC motor using LabVIEW.
Procedia Comput. Sci.152, 252–260 (2019).
16. Bazan, G. H. et al. Stator fault analysis of three-phase induction motors using information measures and artificial neural networks.Electr. Power Syst. Res.
143, 347–356 (2017).
17. Brandstetter, P. & Kuchar, M. Sensorless control of variable speed induction motor drive using RBF neural network.J. Appl. Log.24, 97–108 (2017). 18. R. G., Suresh, S. & Sivaraju, S. S. ANFIS based multi-sector space vector PWM
scheme for sensorless BLDC motor drive. Microprocess.Microsyst76, 103091 (2020).
19. Farah, N. et al. A novel self-tuning fuzzy logic controller based induction motor drive system: an experimental approach.IEEE Access7, 68172–68184 (2019).
20. Liu, Z., Zheng, Z. & Li, Y. Enhancing fault-tolerant ability of a nine-phase induction motor drive system using fuzzy logic current controllers.IEEE Trans. Energy Convers.32, 759–769 (2017).
21. Rafa, S. et al. Implementation of a new fuzzy vector control of induction motor.ISA Trans.53, 744–754 (2014).
22. Çeven, S., Albayrak, A. & Bayır, R. Real-time range estimation in electric vehicles using fuzzy logic classifier.Comput. Electr. Eng.83, 106577 (2020). 23. Hannan, M. A., Ali, J. A., Mohamed, A. & Hussain, A. Optimization
techniques to enhance the performance of induction motor drives: a review.
Renew. Sustain. Energy Rev.81, 1611–1626 (2017).
24. Uddin, M. & Hafeez, M. FLC-based DTC scheme to improve the dynamic performance of an IM drive.IEEE Trans. Ind. Appl.48, 823–831 (2012). 25. Li, W. & Gao, S. Prospective on energy related carbon emissions peak
integrating optimized intelligent algorithm with dry process technique application for China’s cement industry.Energy165, 33–54 (2018).
26. Coatalem, M., Mazauric, V., Le Pape-Gardeux, C. & Maïzi, N. Optimizing industries’power generation assets on the electricity markets.Appl. Energy
185, 1744–1756 (2017).
27. Lopez, M. G., Ponce, P., Soriano, L. A., Molina, A. & Rivas, J. J. R. A novel fuzzy-PSO controller for increasing the lifetime in power electronics stage for brushless DC drives.IEEE Access7, 47841–47855 (2019).
28. Sakthivel, V. P. & Subramanian, S. On-site efficiency evaluation of three-phase induction motor based on particle swarm optimization.Energy36, 1713–1720 (2011).
29. Reis, M. R. et al. Optimized techniques for driving and control of the switched reluctance motor to improve efficiency.Control Eng. Pract.90, 1–18 (2019).
30. Ali, J. A., Hannan, M. A., Mohamed, A. & Abdolrasol, M. G. M. Fuzzy logic speed controller optimization approach for induction motor drive using backtracking search algorithm.Measurement78, 49–62 (2016).
31. Ranjani, M. & Murugesan, P. Optimal fuzzy controller parameters using PSO for speed control of Quasi-Z Source DC/DC converter fed drive.Appl. Soft Comput.27, 332–356 (2015).
32. Pan, I., Das, S. & Gupta, A. Tuning of an optimal fuzzy PID controller with stochastic algorithms for networked control systems with random time delay.
ISA Trans.50, 28–36 (2011).
33. Shareef, H., Mutlag, A. H. & Mohamed, A. A novel approach for fuzzy logic PV inverter controller optimization using lightning search algorithm.
Neurocomputing168, 435–453 (2015).
34. Mutlag, A. H., Mohamed, A. & Shareef, H. A nature-inspired optimization-based optimum fuzzy logic photovoltaic inverter controller utilizing an eZdsp F28335 board. Energies9, 120 (2016).
35. Ochoa, P., Castillo, O. & Soria, J. Optimization of fuzzy controller design using a differential evolution algorithm with dynamic parameter adaptation based on type-1 and interval type-2 fuzzy systems.Soft Comput.24, 193–214 (2020).
36. Castillo, O. et al. Comparative study in fuzzy controller optimization using bee colony, differential.Evolution, Harmon. Search Algorithms Algorithms12, 9 (2018).
37. Melin, P., Ontiveros-Robles, E., Gonzalez, C. I., Castro, J. R. & Castillo, O. An approach for parameterized shadowed type-2 fuzzy membership functions applied in control applications.Soft Comput.23, 3887–3901 (2019). 38. Castillo, O. & Amador-Angulo, L. A generalized type-2 fuzzy logic approach
for dynamic parameter adaptation in bee colony optimization applied to fuzzy controller design.Inf. Sci. (Ny.)460–461, 476–496 (2018).
39. Hannan, M. A. et al. Switching techniques and intelligent controllers for induction motor drive: issues and recommendations.IEEE Access6, 47489–47510 (2018).
40. Yu, J., Shi, Y., Tang, D., Liu, H. & Tian, L. Optimizing sequential diagnostic strategy for large-scale engineering systems using a quantum-inspired genetic algorithm: a comparative study.Appl. Soft Comput. J.85, 105802 (2019). 41. Agrawal, R. K., Kaur, B. & Sharma, S. Quantum based whale optimization
algorithm for wrapper feature selection. Appl. Soft.Comput. J.89, 106092 (2020).
42. Nezamabadi-Pour, H. A quantum-inspired gravitational search algorithm for binary encoded optimization problems.Eng. Appl. Artif. Intell.40, 62–75 (2015).
43. Altin, N. & Sefa,İ. dSPACE based adaptive neuro-fuzzy controller of grid interactive inverter.Energy Convers. Manag56, 130–139 (2012).
44. Valan Rajkumar, M., Manoharan, P. S. & Ravi, A. Simulation and an experimental investigation of SVPWM technique on a multilevel voltage source inverter for photovoltaic systems.Int. J. Electr. Power Energy Syst.52, 116–131 (2013).
45. El-Sousy, F. F. M. & Abuhasel, K. A. Intelligent adaptive dynamic surface control system with recurrent wavelet elman neural networks for DSP-based induction motor servo drives.IEEE Trans. Ind. Appl.55, 1998–2020 (2019).
46. Ortatepe, Z. & Karaarslan, A. DSP-based comparison of PFC control techniques applied on bridgeless converter.IET Power Electron13, 317–323 (2020).
47. Suetake, M., da Silva, I. N. & Goedtel, A. Embedded DSP-based compact fuzzy system and its application for induction-motor V/f speed control.IEEE Trans. Ind. Electron.58, 750–760 (2011).
48. Choi, H. H., Yun, H. M. & Kim, Y. Implementation of evolutionary fuzzy PID speed controller for PM synchronous motor.IEEE Trans Ind. Inform.11, 540–547 (2015).
49. dos Santos, T. H., Goedtel, A., da Silva, S. A. O. & Suetake, M. Scalar control of an induction motor using a neural sensorless technique.Electr. Power Syst. Res.108, 322–330 (2014).
50. Shareef, H., Ibrahim, A. A. & Mutlag, A. H. Lightning search algorithm.Appl. Soft Comput.36, 315–333 (2015).
51. Sun, J., Fang, W., Palade, V., Wu, X. & Xu, W. Quantum-behaved particle swarm optimization with Gaussian distributed local attractor point.Appl. Math. Comput.218, 3763–3775 (2011).
52. Zhisheng, Z. Quantum-behaved particle swarm optimization algorithm for economic load dispatch of power system.Expert Syst. Appl.37, 1800–1803
(2010).
53. Mirjalili, S. & Lewis, A. The whale optimization algorithm.Adv. Eng. Softw.
95, 51–67 (2016).
54. Yazdani, M. & Jolai, F. Lion optimization algorithm (LOA): a nature-inspired metaheuristic algorithm.J. Comput. Des. Eng.3, 24–36 (2016).
55. Hannan, M. A., Lipu, M. S. H., Hussain, A., Saad, M. H. & Ayob, A. Neural network approach for estimating state of charge of lithium-ion battery using backtracking search algorithm.IEEE Access6, 10069–10079 (2018). 56. Grewal, G. S. & Singh, B. Efficiency determination of in-service induction
machines using gravitational search optimization.Measurement118, 156–163
(2018).
57. Sudha Letha, S., Thakur, T. & Kumar, J. Harmonic elimination of a photo-voltaic based cascaded H-bridge multilevel inverter using PSO (particle swarm optimization) for induction motor drive.Energy107, 335–346 (2016).
58. Ali, J. A., Hannan, M. A., Mohamed, A. & Abdolrasol, M. G. M. Fuzzy logic speed controller optimization approach for induction motor drive using backtracking search algorithm.Meas. J. Int. Meas. Confed.78, 49–62 (2016). 59. Zaky, M. S. & Metwaly, M. K. A performance investigation of a four-switch
three-phase inverter-fed IM drives at low speeds using fuzzy logic and PI controllers.IEEE Trans. Power Electron.32, 3741–3753 (2017).
60. Ghosh, L., Konar, A., Rakshit, P. & Nagar, A. K. Hemodynamic analysis for cognitive load assessment and classification in motor learning tasks using type-2 fuzzy sets.IEEE Trans. Emerg. Top. Comput. Intell.3, 245–260 (2018).
61. Abd. Ali, J., Hannan, M. A., Mohamed, A., Pin Jern, K. & Abdolrasol, M. G. Implementation of DSP-based optimal fuzzy logic speed controller for IM drive using quantum lightning search algorithm.Measurement153, 107372 (2020).
62. Ma, M., Ling, F., Li, F. & Liu, F. Torque ripple suppression of switched reluctance motor by segmented harmonic currents injection based on adaptive fuzzy logic control.IET Electr. Power Appl14, 325–335 (2020).
63. Sarabakha, A., Fu, C. & Kayacan, E. Intuit before tuning: type-1 and type-2 fuzzy logic controllers.Appl. Soft Comput. J.81, 105495 (2019).
64. Fan, F. & Wang, G. Fuzzy logic interpretation of quadratic networks.
Neurocomputing374, 10–21 (2020).
65. Arun Srinivas, T., Themozhi, G. & Nagarajan, S. Current mode controlled fuzzy logic based inter leaved cuk converter SVM inverter fed induction motor drive system.Microprocess. Microsyst.74, 103002 (2020).
66. Feng, G., Lai, C. & Kar, N. C. A closed-loop fuzzy-logic-based current controller for pmsm torque ripple minimization using the magnitude of speed harmonic as the feedback control signal.IEEE Trans. Ind. Electron.64, 2642–2653 (2017).
67. Hilletofth, P., Sequeira, M. & Adlemo, A. Three novel fuzzy logic concepts applied to reshoring decision-making.Expert Syst. Appl.126, 133–143 (2019). 68. Wang, M. & Yang, N. Three-dimensional computational model simulating the fracture healing process with both biphasic poroelasticfinite element analysis and fuzzy logic control.Sci. Rep.8, 1–13 (2018).
69. Bhattacharjee, D., Kim, W., Chattopadhyay, A., Waser, R. & Rana, V. Multi-valued and fuzzy logic realization using TaOx memristive devices.Sci. Rep.8, 1–10 (2018).
70. Chai, T. & Draxler, R. R. Root mean square error (RMSE) or mean absolute error (MAE)?–Arguments against avoiding RMSE in the literature.Geosci. Model Dev.7, 1247–1250 (2014).
Acknowledgements
This work was supported by the LRGS project grant number 20190101LRGS from the Ministry of Higher Education, Malaysia and bold project 10436494/B/2019093 both under Universiti Tenaga Nasional. The grant number DIP-2018-020 under the Universiti Kebangsaan Malaysia. We also would like to acknowledge the support by the Centre for Green Technology, University of Technology Sydney under grant 321740.2232397.
Author contributions
M.A.H., A.M. and J.A.A. designed the research. J.A.A., M.A.H. and M.S.H.L. conducted the machine learning optimization and modelling, performed the experiments, analysed the data and wrote the manuscript. K.P.J., T.M.I.M., M.M., A.H., K.M.M. and Z.Y.D. provided study oversight and edited the manuscript. All authors discussed the results and commented on the manuscript.
Competing interests
The authors declare no competing interests.
Additional information
Supplementary informationis available for this paper at https://doi.org/10.1038/s41467-020-17623-5.
Correspondenceand requests for materials should be addressed to M.A.H. or M.S.H.L.
Peer review informationNature Communicationsthanks Miltiadis Alamaniotis and the other, anonymous, reviewer(s) for their contribution to the peer review of this work. Peer reviewer reports are available.
Reprints and permission informationis available athttp://www.nature.com/reprints
Publisher’s noteSpringer Nature remains neutral with regard to jurisdictional claims in published maps and institutional affiliations.
Open Access This article is licensed under a Creative Commons Attribution 4.0 International License, which permits use, sharing, adaptation, distribution and reproduction in any medium or format, as long as you give appropriate credit to the original author(s) and the source, provide a link to the Creative Commons license, and indicate if changes were made. The images or other third party material in this article are included in the article’s Creative Commons license, unless indicated otherwise in a credit line to the material. If material is not included in the article’s Creative Commons license and your intended use is not permitted by statutory regulation or exceeds the permitted use, you will need to obtain permission directly from the copyright holder. To view a copy of this license, visithttp://creativecommons.org/ licenses/by/4.0/.
© The Author(s) 2020