Citation Brankaer, C., Ghesquière, P., & De Smedt, B. (2014). Numerical
magnitude processing deficits in children with mathematical difficulties are independent of intelligence. Research in Developmental Disabilities, 35, 2603-2613.doi: 10.1016/j.ridd.2014.06.022
Archived version Author manuscript: the content is identical to the content of the published paper, but without the final typesetting by the publisher Published version http://www.sciencedirect.com/science/article/pii/S0891422214002662 Journal homepage
http://www.journals.elsevier.com/research-in-developmental-disabilities/ Corresponding
author contact [email protected] +32 (0)16 32 61 82 Senior author
contact [email protected] +32 (0)16 325705 IR https://lirias.kuleuven.be
Numerical magnitude processing deficits in children with mathematical difficulties are independent of intelligence
Carmen Brankaer, Pol Ghesquière, and Bert De Smedt Parenting and Special Education Research Unit
KU Leuven, Belgium
Correspondence concerning this article should be addressed to Carmen Brankaer, Parenting and Special Education Research Unit, Leopold Vanderkelenstraat 32, box 3765, B-3000 Leuven, Belgium. E-mail: [email protected]. Tel. +32 16 32 61 82 or to Bert De Smedt, Parenting and Special Education Research Unit, Leopold Vanderkelenstraat 32, box 3765, B-3000 Leuven, Belgium. E-mail: [email protected]. Tel. +32 16 32 57 05. Fax. +32 16 32 59 33
ABSTRACT
Developmental dyscalculia (DD) is thought to arise from difficulties in the ability to process numerical magnitudes. Most research relied on IQ-discrepancy based definitions of DD and only included individuals with normal IQ, yet little is known about the role of intelligence in the association between numerical magnitude processing and mathematical difficulties (MD). The present study examined numerical magnitude processing in matched groups of
7-8-year-olds (n = 42) who had either discrepant MD (poor math scores, average IQ), nondiscrepant
MD (poor math scores, below-average IQ) or no MD. Both groups of children with MD showed similar impairments in numerical magnitudes processing compared to controls, suggesting that the association between numerical magnitude processing deficits and MD is independent of intelligence.
1. Introduction
Around 15 to 25% of children and adults experience difficulties with the development of mathematical skills and 5 to 7% of them even have specific mathematical learning disabilities or developmental dyscalculia (DD) (Butterworth, 2010; Butterworth, Varma, & Laurrilard, 2011; Desoete, Roeyers, & De Clerq, 2004; Geary, 2011). Over the last years, there has been an increasing interest in understanding the cognitive factors that underlie these mathematical difficulties (MD). Several studies have attributed an important role to the ability to understand and process numerical magnitude information in the development of mathematics and MD (e.g., Butterworth et al., 2011; De Smedt, Noël, Gilmore, & Ansari, 2013 for a review).
Most studies that examined these numerical magnitude processing skills in children with MD relied on IQ-discrepancy based definitions to select their participants (e.g., American Psychiatric Association, 2000; Temple, 1992) and defined DD as a specific learning disability affecting the processing of numerical and arithmetical information in the context of normal intelligence (e.g., Landerl & Kölle, 2009; Mussolin, Mejias, & Noël, 2010; Rousselle & Noël, 2007). These discrepancy-based definitions posit that different cognitive processes may underlie the MD in individuals with intact general intellectual abilities compared to individuals with lower intellectual abilities. In the context of dyslexia research, however, several studies questioned the validity of the discrepancy criterion (e.g., Fletcher, Lyon, Fuchs, & Barnes, 2007). Because no research has been found that surveyed this assumption in the context of mathematics learning, the question arises which role intelligence plays in the relation between numerical magnitude processing and mathematical development. The present study tried to answer this question by investigating the numerical magnitude processing capacities of two groups of children who had either discrepant MD (poor math skills and a normal IQ) or nondiscrepant MD (poor math skills and a low IQ). Children were
mathematics achievement test. Further, most children with MD in our sample experienced persistent problems with mathematics learning, as is illustrated by the fact that they were enrolled in special education schools that are specifically oriented to children with low academic achievement.
1.1 Numerical magnitude processing
A wealth of evidence suggests that humans and animals have an innate capacity to represent numerical magnitudes (e.g., Brannon, 2006; Izard, Sann, Spelke, & Streri, 2009). Studies have shown, for example, that infants (Xu & Arriaga, 2007), kindergarteners (Barth, Beckmann, & Spelke, 2008) and non-human primates (Jones & Brannon, 2012) are able to compare sets of non-symbolic objects or dots. An important difference between animals and humans, however, is that children learn to link these non-symbolic magnitude representations with Arabic digits and number words when they grow older (Griffin, 2003). The ability to represent numerical magnitudes has been proven to be related to and even predictive of individual differences in mathematics achievement (Bugden & Ansari, 2011; De Smedt, Verschaffel, & Ghesquière, 2009; Holloway & Ansari, 2009; Reigosa-Crespo et al., 2012). Numerical magnitude representations have been commonly investigated by means of a numerical magnitude comparison task (Sekuler & Mierkiewicz, 1977). In this task, participants are asked to select the numerically larger of two presented numerical magnitudes. These magnitudes can be presented both in a non-symbolic (dot arrays or sequences of sounds) and a symbolic (Arabic digits or number words) format (De Smedt et al., 2013). Typically, results from this task show a numerical distance effect (Moyer & Landauer, 1967), which implies that participants will be faster and more accurate in making responses when the numerical distance between the two magnitudes is relatively large (e.g., 1 vs. 9) than when it is small (e.g., 8 vs. 9). This distance effect is thought to arise from the approximate nature of numerical magnitude representations: Magnitudes that are closer to each other have more
representational overlap and are more difficult to discriminate than magnitudes that are further apart (for a review, see Noël, Rousselle, & Mussolin, 2005). This distance effect decreases with age (Sekuler & Mierkiewicz, 1977), suggesting that magnitude representations become more precise and show less overlap throughout development.
1.2 DD and numerical magnitude processing
It has been widely documented that children with DD experience particular problems with numerical magnitude processing (De Smedt et al., 2013; Noël & Rousselle, 2011), although this hypothesis of a numerical processing deficit has been challenged (Fias, Menon, & Szucs, 2013) and other specific domain-general deficits, such as difficulties in working memory (e.g., Passolunghi & Siegel, 2004), have been proposed. Trying to understand the numerical magnitude processing difficulties in DD, some researchers have postulated that DD arises
from a fundamental impairment in the representation of numerical magnitudes (defective
number module hypothesis; Butterworth, 2005), while others argued that DD originates from impairments in the ability to access numerical meaning from symbols rather than from
difficulties in the ability to process magnitude per se (access deficit hypothesis; Rousselle &
Noël, 2007). Both hypotheses have been tested by using symbolic and non-symbolic magnitude comparison tasks (see De Smedt et al., 2013 for an overview). Studies in favour of the defective number module hypothesis observed that children with DD performed more poorly than typically developing children on both symbolic and non-symbolic comparison tasks (e.g., Landerl, Fussenegger, Moll, & Willburger, 2009; Mazzocco, Feigenson, & Halberda, 2011; Mussolin et al., 2010). In contrast, studies supporting the access deficit hypothesis found that children with DD performed more poorly than typically developing children on the symbolic but not on the non-symbolic comparison task (e.g., De Smedt & Gilmore, 2011; Landerl & Kölle, 2009; Rousselle & Noël, 2007). In all, most of the existing research indicates that children with DD show deficits in their ability to compare Arabic
digits, while data on non-symbolic comparison tasks have been less conclusive so far. Several authors have tried to find an explanation for the contradictory pattern of results for the non-symbolic comparison task and pointed to methodological issues and age differences between the various studies (De Smedt et al., 2013; Gilmore et al., 2013; Noël & Rousselle, 2011), although future research on this issue is necessary.
1.3 Role of intelligence in numerical magnitude processing
Most studies that focused on the underlying causes of DD used strict inclusion criteria with respect to the intelligence of their participants, i.e. only participants with normal intelligence were included in the sample (e.g., Ashkenazi, Mark-Zigdon, & Henik, 2009; Iuculano, Tang, Hall, & Butterworth, 2008; Landerl, Bevan, & Butterworth, 2004; Mussolin et al., 2010). The rationale behind this approach is that the mathematical problems in children with a below-average intelligence (nondiscrepant MD) are thought to be secondary to children’s lower intelligence rather than being due to a specific learning disability (Maehler & Schuchardt, 2009), indicating that different cognitive processes might underlie the MD in children with an average vs. low intelligence.
In the context of dyslexia research, however, several studies questioned the validity of this discrepancy criterion (e.g., Fletcher et al., 2007). Developmental dyslexia causes reading difficulties and is characterised by an underlying phonological deficit. Both behavioral and neuroimaging studies have shown that IQ-discrepant poor readers and IQ-nondiscrepant poor readers experience similar problems with phonological processing (e.g., Hoskyn & Swanson, 2000; Stuebing et al., 2002) and exhibit similar patterns of brain activity during reading in parieto-temporal and occipito-temporal cortices (Tanaka et al., 2011). These findings seem to suggest that the association between reading difficulties and phonological processing deficits is independent of IQ.
With respect to mathematics, less is known about the role of intelligence in the association between numerical magnitude processing and MD. Only a few studies examined the numerical magnitude processing skills of children with below-average intellectual abilities (Hoard, Geary, & Hamson, 1999; Brankaer, Ghesquière, & De Smedt, 2011, 2013) and they all revealed that these children are also impaired in their ability to represent numerical magnitudes. Further, there exist some studies that investigated the association between numerical magnitude processing and mathematics while controlling for intellectual ability, both in typically developing children (Halberda, Mazzocco, & Feigenson, 2008; Linsen, Verschaffel, Reynvoet, & De Smedt, 2014; Vanbinst, Ghesquière, & De Smedt, 2012) and adults (Halberda, Ly, Wilmer, Naiman, & Germine, 2012). These studies revealed that individual differences in numerical magnitude representations are related to individual differences in mathematics achievement, even when intelligence is controlled for. Similar results were found in studies that focused on children with DD (Ashkenazi et al., 2009; Desoete, Ceulemans, De Weerdt, & Pieters, 2012; Landerl et al., 2004; Mussolin et al., 2010), as data from these studies showed that children with DD are impaired in numerical magnitude processing compared to their typically developing peers, even after matching both groups in term of intelligence. Additionally, several studies investigated symbolic and non-symbolic magnitude processing in children with genetic syndromes that are associated with lower intellectual functioning and MD, such as 22q11 deletion syndrome (e.g., De Smedt et al., 2007; Simon et al., 2008) and Williams syndrome (e.g., O’Hearn & Landau, 2007). Findings from these studies demonstrated that children who suffer from these genetic syndromes are impaired in numerical magnitude processing compared to their typically developing peers, even when their lowered intelligence is controlled for. These data suggest that the association between numerical magnitude processing and mathematics achievement cannot be explained by recourse to IQ.
To the best of our knowledge, however, no systematic comparisons between the numerical magnitude processing skills of children with a low intelligence and children with DD were made so far. Nonetheless, it is important to know whether the MD in children with a low vs. average IQ are caused by the same underlying cognitive deficits or not, because this knowledge might have important implications for the remediation and mathematics education of children with MD.
1.4 The present study
Against this background, the main goal of the present study was to examine numerical magnitude comparison simultaneously in two matched groups of children who had either discrepant MD (poor math scores and an average intelligence) or nondiscrepant MD (poor math scores and a below-average intelligence). We compared the performance of both groups with the performance of a control group of typically developing children. Based on prior research (e.g., De Smedt et al., 2013; Brankaer et al., 2013), we expected that both children with discrepant and nondiscrepant MD would have problems with numerical magnitude comparison compared to their typically developing peers. Further, if the performance of children with discrepant MD on the magnitude comparison tasks would be similar to the performance of children with nondiscrepant MD, and both groups would perform more poorly than control children, this would indicate that numerical magnitude processing is related to mathematical difficulties independent of intelligence. If, by contrast, the performance of children with discrepant MD would differ from the performance of children with nondiscrepant MD, then not only numerical magnitude processing, but also intelligence would play a role in the emergence of MD.
Additionally, we tried to contrast the defective number module hypothesis (Butterworth, 2005) and the access deficit hypothesis (Rousselle & Noël, 2007) in both children with discrepant and nondiscrepant MD by looking at their performance on the symbolic and
non-symbolic magnitude comparison tasks. If the children perform more poorly on both tasks, this supports the defective number module hypothesis. If they perform more poorly on the symbolic, but not on the non-symbolic comparison task, this favors the access deficit hypothesis.
Because a large body of research has pointed to the relation between working memory impairments and MD (see Friso-van den Bos, van der Ven, & Kroesbergen, 2013, for an overview), and given the suggested associations between this domain-general factor and numerical magnitude processing (Fias et al., 2013; Gullick, Sprute, & Temple, 2011; Passolunghi & Lanfranchi, 2012), the present study also included working memory as a variable of interest. A widely used model of working memory is the multi-component model of Baddeley (1986, 2003), which has three main components: two slave systems that are responsible for passive information storage (the phonological loop and the visual-spatial sketchpad) and a central executive that controls and regulates the information stored within the slave systems. Previous studies have demonstrated that both children with DD and children with a low IQ experience problems with all components of working memory, although task- and age-related differences with regard to the contribution of each component have been observed (e.g., Brankaer et al., 2013; De Smedt et al., 2009; Passolunghi & Siegel, 2004; Schuchardt, Gebhardt, & Mäehler, 2010; Van der Molen, Van Luit, Jongmans, & Van der Molen, 2009). Therefore, we hypothesized that both children with discrepant and nondiscrepant MD would be impaired in their working memory capacities. We also tried to examine the impact of working memory on the association between numerical magnitude processing and MD.
Finally, we assessed a motor reaction time task to control for this factor in our analyses, because children’s reaction time on the magnitude comparison tasks might also be influenced by their general response speed.
2. Method 2.1 Participants
Three groups of children participated in the present study. Children with a low IQ were selected from three special education schools for children with mild intellectual disabilities (IQ < 85). These children had poor math scores and low intelligence and therefore showed nondiscrepant mathematical difficulties (MD-nd group). Children with DD were selected from two mainstream primary schools and four special education schools specifically organized for children with learning disabilities with normal IQ (IQ > 85). These children had poor math scores but a normal intelligence and therefore showed discrepant mathematical difficulties (MD-d group). These two groups of children were compared with a control group of chronological age-matched typically developing children, who were recruited from four mainstream primary schools (CA-group). None of the control children had a developmental disorder and none of them had repeated grade.
Parental consent was obtained for 187 children (94 boys, 93 girls). All children completed the Raven’s Standard Progressive Matrices (Raven, Court, & Raven, 1992) and a standardized arithmetic test (De Vos, 1992) as measures of intellectual ability and mathematics achievement level, respectively. Additionally, children’s reading abilities were assessed by using a standardized reading test (Moelands & Rymenans, 2003). From the initial sample of 187 children, we selected children on the basis of their chronological age, arithmetic achievement level and intelligence, in order to optimize the matching of the three groups. Against the background of the DSM-IV-TR criteria for defining borderline to mild intellectual disability (American Psychiatric Association, 2000), only children with an IQ between 50 and 85 were included in the MD-nd group. Children in the MD-d and CA-group all had a normal IQ, i.e. larger than 85.
With respect to children’s arithmetic achievement level, only children with a score equal to or
below the 20th percentile on the Tempo Test Arithmetic (De Vos, 1992) were included in the
MD-nd and MD-d group. Children in the CA-group performed above the 20th percentile on
this test. Further, we excluded children with known genetic syndromes that are associated with mathematical difficulties (i.e., Williams-Beuren syndrome, Velo-cardio-facial syndrome, Turner syndrome, Down syndrome and Fragile X syndrome) from our sample.
The final sample consisted of 14 children with MD-nd, 14 children with MD-d and 14 control children. Table 1 shows the descriptive statistics of all three groups. There were more boys in the MD-d group than in the other two groups, although the groups did not significantly differ
in the number of boys and girls, ²(2, N = 42) = 5.65, p = .06. There were also no group
differences in chronological age, F(2,39) = 2.21, p = .12, ηp² = .10. As expected, the groups
differed in intellectual ability, F(2,39) = 50.88, p < .01, ηp² = .72, indicating that children from
the MD-nd group had a significantly lower intellectual ability than children from the MD-d
group (p < .01, d = -2.84) and CA-group (p < .01, d = -5.01), while these latter two groups
did not differ (p = .13). Further, groups differed in arithmetical ability, F(2,39) = 44.87,
p < .01, ηp² = .70: children from the CA-group solved significantly more addition problems
than children in the MD-nd group (p < .01, d = 3.11) and MD-d group (p < .01, d = 2.84),
who in turn did not differ (p = .29). These findings indicate that the three groups were
successfully matched.
Additionally, groups also differed in reading ability, F(2,39) = 48.86, p < .01, ηp² = .72, as
control children performed better on the reading test than children with MD-nd (p < .01,
d = 3.49) and MD-d (p < .01, d = 2.94), while the latter two groups of children did not differ
from each other (p = .26). These findings demonstrate that children in the MD-d group had
combined mathematical and reading difficulties, which is not so surprising because the comorbidity of DD and dyslexia is rather high (Landerl, Göbel, & Moll, 2013).
2.2 Procedure
Children first completed the group-administered intellectual ability test. A few days later, the arithmetic and reading achievement tests, the computerized tests and the working memory tasks were administered individually in a separate room. All children were tested at their own school during regular school hours.
2.3 Measures
2.3.1 Intellectual ability
Raven’s Standard Progressive Matrices (Raven et al., 1992) was administered in all children
as a measure of intellectual ability. For each participant, a standardized score (M = 100,
SD = 15) was calculated. Reliability for this test is reported to be .88 (Raven, Raven, & Court, 2004).
2.3.2 Arithmetical ability
The Tempo Test Arithmetic (De Vos, 1992) was used as a measure of arithmetical ability. This standardized paper-and-pencil achievement test consists of 200 basic arithmetic problems that are presented in five rows, each row concerning one arithmetic operation (e.g., 7 + 2 = ). Within each row, 40 items of increasing difficulty are presented and children are asked to solve as many problems as possible within a one-minute period. In the present study, only the addition problems were presented, as the children with MD-nd did not yet receive enough instruction in subtraction, multiplication and division. The score on this test was the number of correctly solved problems within the time limit of one minute (maximum = 40). The psychometric value of the test has been demonstrated on a sample of 10 059 children (Ghesquière & Ruijssenaars, 1994).
2.3.3 Reading ability
The Flemish version of the Three-Minutes-Test (Moelands & Rymenans, 2003) was administered as a measure of children’s reading fluency. This test contains of three reading
charts of increasing difficulty. For each chart, children are asked to read as many words as possible within one minute. In the present study, only the first reading chart was presented (monosyllables of the type vowel-consonant, consonant-vowel and consonant-vowel-consonant), as the children with MD-nd did not yet receive enough instruction in more difficult words. The score on this test was the number of correctly read words within one minute (maximum = 150). Reliability for this test is larger than .90 (Moelands, Kamphuis, & Verhoeven, 2003).
2.3.4 Computerized tasks
All computerized tasks were designed with the E-prime 2.0 software (Schneider, Eschmann, & Zuccolotto, 2002) and were administered using a 15 inch laptop. Children were instructed to perform both accurately and fast. Stimuli occurred in white on a black background (Arial font, 72 point-size). Each trial started with a 250 ms fixation cross in the centre of the computer screen. After 1000 ms, stimuli appeared and remained visible until response, except for the non-symbolic magnitude comparison task where the stimuli disappeared after 840 ms, in order to avoid counting. Each trial was initiated by the experimenter by means of a control key. Participants had to respond by pressing a key on the side of the correct answer. The left response key, labeled with a blue sticker, was letter ‘d’ on the keyboard; the right response key, labeled with a yellow sticker, was ‘k’. The position of the correct answer was counterbalanced. To familiarize children with the key assignments, three practice trials were included in each task. Answers and reaction times were recorded by the laptop.
2.3.4.1 Symbolic magnitude comparison
Children had to indicate the numerically larger of two simultaneously presented Arabic digits, one displayed on the left and one displayed on the right side of the computer screen. Stimuli comprised all combinations of the digits 1 to 9, yielding 72 trials. Split-half reliability of this test was .72 for accuracy and .85 for reaction time.
2.3.4.2 Non-symbolic magnitude comparison
In this task, children had to compare two simultaneously displayed dot arrays, one presented on the left and one presented on the right side of the computer screen. They had to indicate the numerically larger numerosity by pressing on the side of the correct response key. Stimuli comprised the same numerosities as in the symbolic magnitude comparison task, yielding 72
trials. The stimuli were generated with the MATLAB script provided by Piazza, Izard, Pinel,
Le Bihan and Dehaene (2004). Dot size, array size, and density were positively correlated with number on half of the trials and negatively correlated with number on the other half. This was done to reduce the likelihood that children would rely on these non-numerical cues or perceptual features to make a decision. Split-half reliability of this test was .79 for accuracy and .91 for reaction time.
2.3.4.3 Control task: Motor reaction time
Two figures (circle, heart, star, square or triangle) appeared on the screen and one of them was coloured white. Children had to press as soon as possible on the side of this white figure. This task was included to control for children’s response speed on the keyboard. Split-half reliability of this test was .94.
2.3.5 Working memory 2.3.5.1 Phonological loop
The Digit Span Forward task involved the immediate recall of increasingly longer series of digits between 1 and 9. These series were presented acoustically and were recorded to standardize the assessment. There were three trials for each span length (from two to nine
digits). The first two trials were taken from the Wechsler Intelligence Scale for Children - 3rd
Edition (WISC-III; Wechsler, 1992) and the third trial was taken from the Working Memory Test Battery for Children (WMTB-C; Pickering & Gathercole, 2001). When a child failed two
successive trials of the same length, testing on this task was terminated. Reliability of this test was .71 (De Smedt et al., 2009).
2.3.5.2 Visual-spatial sketchpad
In the Corsi Block task, the experimenter tapped out a sequence of blocks on a board with
nine blocks. Children were instructed to repeat this sequence in the same order. The task started with a sequence of two blocks and, if the child succeeded, gradually became more difficult, up to nine blocks. There were three trials for each span length and testing was terminated when a child failed two trials of the same length. Reliability of this test was .77 (De Smedt et al., 2009).
2.3.5.3 Central Executive
The Digit Span Backward task was similar to the Digit Span Forward task, both for construction and administration, except that children were required to recall the digits in reverse order from the order presented. Testing on this task was terminated when the child failed two trials of the same length. Reliability of this test was .55 (De Smedt et al., 2009).
3. Results 3.1 Control task
Accuracy on the motor reaction time task was high and at ceiling (MD-nd = 96%, MD-d = 95% and CA = 98%). A group difference in children’s response speed was found by
means of a one-way ANOVA, F(2,38) = 4.58, p = .02, ηp² = .19, showing that children in the
CA-group (M = 452.15, SD = 51.96) answered significantly faster than children in the MD-d
group (M = 680.50, SD = 345.99, p = .02, d = -0.98) and children in the MD-nd group
(M = 651.85, SD = 150.50, p = .05, d = -1.84), whereas the latter two groups did not differ
3.2 Numerical magnitude comparison
The mean accuracy and (adjusted) reaction time of the groups on the numerical magnitude comparison tasks are displayed in Figures 1 and 2. Reaction times were based on correct responses only. Because groups differed in their accuracy on the tasks, we divided children’s reaction times by their accuracy scores. Repeated measures analyses of variance (ANOVAs) with task (symbolic vs. non-symbolic) as within-subject factor and group as between-subjects factor were used to evaluate group differences in accuracy and reaction time. Tukey-Kramer
adjustments were used for post hoc t-tests. Partial-eta squared was computed as a measure of
effect size.
With regard to accuracy, there was a main effect of group, F(2,39) = 8.72, p < .01, ηp² = .31,
indicating that children in the CA-group performed more accurately than children with MD-d (p < .01, d = 1.45) and MD-nd (p < .01, d = 1.36) while the latter two groups did not differ
(p = .99). There was no main effect of task, F(1,39) = 0.22, p = .64, ηp² < .01 and no
significant Group Task interaction, F(2,39) = 2.68, p = .08, ηp² = .12.
Turning to reaction time, a main effect of group was found, F(2,39) = 25.42, p < .01,
ηp² = .57, showing that children in the CA-group answered significantly faster than children
with MD-d (p < .01, d = -1.85) and MD-nd (p < .01, d = -2.50), whereas the latter two groups
of children did not differ (p = .31). There was also a main effect of task, F(1,39) = 14.71,
p < .01, ηp² = .27, indicating that children performed faster on the non-symbolic comparison
task than on the symbolic comparison task. No significant Group Task interaction was
found, F(2,39) = 1.37, p = .27, ηp² = .07. To evaluate whether the group differences in
reaction time could be explained by individual differences in general response speed, we repeated the analysis with children’s performance on the motor reaction time task as a covariate. After controlling for this variable, the main effect of group remained,
significantly faster than children with MD-nd and MD-d (ps < .01), while the latter two
groups of children did not differ (p = .22).
Additionally, to obtain more detailed information about children’s performance on the numerical magnitude comparison tasks, we calculated for each child and for each task the slope of the linear regression in which adjusted reaction times were predicted by numerical distance. The size of this slope reflects the effect of numerical distance on children’s reaction times, with steeper slopes representing larger distance effects, and can therefore be considered as an index of the distance effect (e.g., De Smedt et al., 2009). We calculated these slopes for reaction times only, because children performed at ceiling level for accuracy at large distances. The average slopes are displayed for each group in Table 2. All slopes were negative, reflecting the negative relationship between distance and reaction time, and they all
were significantly different from 0 (ts < -4.41, ps < .01). To evaluate group differences in
these slopes, a repeated measures ANOVA with task (symbolic vs. non-symbolic) as within-subject factor and group as between-subjects factor was conducted. A main effect of
group was found, F(2,39) = 6.68, p < .01, ηp² = .26, demonstrating that CA-matched children
had a significantly flatter slope than children in the MD-nd group (p < .01, d = 1.10) and a
marginally flatter slope than children with MD-d (p = .06, d = 0.95). Children with MD-nd
did not differ from their peers with MD-d (p = .45). There was no main effect of task,
F(1,39) = 0.19, p = .67, ηp² < .01, nor a significant Group Task interaction, F(2,39) = 0.05,
p = .95, ηp² < .01.
3.3 Working memory
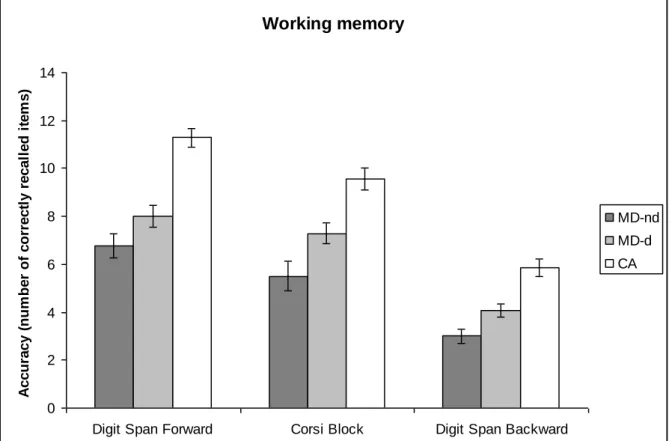
Children’s performance on the three working memory tasks is shown in Figure 3. Group differences were evaluated by using a repeated measures ANOVA with task (Digit Span Forward, Corsi Block and Digit Span Backward) as within-subject factor and group as
showing that accuracy on the Digit Span Forward task was higher than accuracy on the other
two tasks (ps < .01) and that accuracy on the Corsi Block task was higher than accuracy on
the Digit Span Backward task (p < .01). A main effect of group was also found,
F(2,39) = 49.89, p < .01, ηp² = .72, revealing that children in the CA-group performed
significantly better than children in the MD-d group (p < .01, d = 0.99), who in their turn
performed significantly better than children in the MD-nd group (p < .01, d = 0.60). There
was no interaction between group and task, F(4,78) = 1.19, p = .32, ηp² = .06, indicating that
this pattern of findings was the same for each WM-component.
These analyses suggest that the group differences in numerical magnitude processing could not be explained by working memory, because children in the MD-d group performed significantly better on the working memory tasks than children in the MD-nd group, but the two groups performed at the same level on the numerical magnitude comparison tasks. To explicitly test this assumption, we repeated the abovementioned analyses for numerical magnitude comparison with working memory as covariate. As the Pearson correlations
between all three working memory tasks were high (rs ≥ .49, ps < .01), we first calculated one
composite working memory score, which was the sum of all three working memory tasks, to facilitate the analyses.
With regard to accuracy, the main effect of group remained when controlling for working
memory, F(2,38) = 7.17, p < .01, ηp² = .27. Children in the CA-group performed more
accurately than children with MD-d (p < .01, d = 1.57) and MD-nd (p < .01, d = 1.59), while
the latter two groups did not differ (p = .48). There was no main effect of task, F(1,38) = 0.67,
p = .42, ηp² = .02, or a significant Group Task interaction, F(2,38) = 2.64, p = .09, ηp² = .12.
Similar results were obtained for reaction time. The main effect of group remained when
controlling for working memory, F(2,38) = 6.21, p < .01, ηp² = .25, indicating that children in
MD-nd (p < .01, d = -1.46), while the latter two groups did not differ from each other
(p = .56). There was only a trend towards a main effect of task, F(1,38) = 4.09, p = .05,
ηp² = .09, and no significant Group Task interaction was found, F(2,38) = 0.07, p = .93,
ηp² < .01.
4. Discussion
The ability to understand and process numerical magnitude information has been put forward as a crucial factor in the development of mathematics (e.g., Butterworth et al., 2011; De Smedt et al., 2013) and several authors have proposed that MD originate from difficulties in this ability to represent numerical magnitudes (Ashkenazi et al., 2009; Iuculano et al., 2008; Mussolin et al., 2010). Although most research in the MD context focused on children with discrepant MD (poor math scores and an average intelligence), some studies also examined the numerical magnitude processing skills of children with a below-average intelligence (Hoard et al., 1999; Brankaer et al., 2011, 2013) and found that these children were also impaired in their ability to process numerical magnitude information. This led us to the question which role intelligence plays in the association between numerical magnitude processing and mathematical development. The present study tried to answer this outstanding issue by examining the numerical magnitude comparison skills of two matched groups of children who had either discrepant MD (poor math scores and an average intelligence) or nondiscrepant MD (poor math scores and a below-average intelligence).
In line with previous studies, our findings revealed that both children with discrepant MD (e.g., De Smedt et al., 2013; Noël & Rousselle, 2011) and nondiscrepant MD (Hoard et al., 1999; Brankaer et al., 2011, 2013) have particular problems with numerical magnitude representations compared to their chronological-age matched peers. Moreover, both groups of children showed highly similar impairments in their ability to represent numerical magnitudes
as they both performed more poorly on the symbolic and non-symbolic comparison tasks. This all suggests that the association between numerical magnitude processing deficits and MD is independent of IQ. However, it is important to emphasize that these similar impairments in numerical magnitude processing at the behavioural level could originate from different aetiologies. Both groups of children differed in their intelligence, and it is plausible that the children in the MD-d group would also perform better on several measures of cognitive functioning compared to the children in the MD-nd group. In fact, the present working memory data confirm this assumption, as we found that children in the MD-d group performed significantly better on the working memory tasks than children in the MD-nd group. Therefore, it might be that the magnitude comparison problems in both groups of children with MD arise from different deficits. On the other hand, it is also possible that deficits in numerical magnitude representation constitute a core deficit in MD, and that the cognitive processes that differentiate the MD-d and MD-nd groups do not play a crucial role in the numerical magnitude processing problems that lie at the heart of the mathematical difficulties in both groups (see Stanovich, 1996 for a similar rationale in the context of dyslexia research).
The present data are also in line with studies that examined numerical magnitude processing in children with DD (Ashkenazi et al., 2009; Desoete et al., 2012; Landerl et al., 2004; Mussolin et al., 2010) and children with genetic syndromes that are associated with lower intellectual functioning and MD, such as 22q11 deletion syndrome (e.g., De Smedt et al., 2007; Simon et al., 2008) and Williams syndrome (e.g., O’Hearn & Landau, 2007). These studies have revealed that these children with DD or genetic syndromes are impaired in numerical magnitude processing compared to typically developing control children, even when their intellectual ability is taken into account. The findings of the present study are also consistent with those of studies in typically developing children (Halberda et al., 2008; Linsen
et al., 2014; Vanbinst et al., 2012) and adults (Halberda et al., 2012), which demonstrated that individual differences in numerical magnitude representations are related to individual differences in mathematics achievement, even when intelligence is controlled for.
The observation that our participants with MD performed more poorly on both the symbolic and non-symbolic comparison task is consistent with the defective number module hypothesis (Butterworth, 2005) and suggests that the mathematical difficulties in our participants might be related to a specific deficit in their ability to represent numerical magnitudes, irrespective of intelligence. Previous studies in children with nondiscrepant MD or a below-average intelligence also found evidence for the defective number module hypothesis (Brankaer et al., 2011, 2013), but the data for children with discrepant MD were less consistent. The observation that our participants with MD-d performed more poorly on the non-symbolic magnitude comparison task compared to typically achieving children corresponds with some studies (e.g., Mazzocco et al., 2011; Mussolin et al., 2010), whereas others failed to find any significant difference between children with DD and control children (De Smedt & Gilmore, 2011; Landerl & Kölle, 2009; Rousselle & Noël, 2007). As suggested by De Smedt et al. (2013), these inconsistencies regarding the non-symbolic comparison task might be explained by methodological issues, such as task design and participant characteristics.
Related to this, Murphy, Mazzocco, Hanich and Early (2007) mentioned that, depending on the method and criteria used to define DD, different deficits might be found to underlie mathematical difficulties. Additionally, Murphy et al. (2007) pointed to the role that different cutoff scores and persistence requirements may play when studying the characteristics of individuals with DD. It is crucial to be fully aware of these variations between different studies, as they might have an impact on the outcomes. In this respect, it is important to note that the arithmetic achievement level of our participants with DD had to meet specific requirements to optimize the matching between these children and children with a low
intelligence. This matching procedure might have influenced the outcomes of the present study. In relation to this issue, it is important to note that the children in the MD-d group had combined mathematical and reading disorders. As Murphy et al. (2007) noted, it is possible that reading-related skills influence the cognitive profiles of children with MD. Nevertheless, several studies that compared children with comorbid DD and dyslexia on the one hand and children with DD and normal reading skills on the other hand found similar numerical magnitude processing problems in both groups of children, suggesting that deficits in numerical magnitude representations constitute a core deficit in DD regardless of whether DD is accompanied by comorbid reading problems (see Landerl et al., 2013; Rousselle & Noël, 2007). In order to better understand the role of reading skills in the relationship between intelligence, numerical magnitude processing and mathematics, future studies should try to replicate the present findings in children with DD without reading difficulties.
Because working memory impairments have been observed in both children with DD (e.g., Geary, Hoard, Byrd-Craven, Nugent, & Numtee, 2007; Passolunghi & Siegel, 2004) and children with a low intelligence (Brankaer et al., 2013; Schuchardt et al., 2010; Van der Molen et al., 2009) and given the association between working memory and numerical magnitude processing (Fias et al., 2013; Gullick et al., 2011; Passolunghi & Lanfranchi, 2012), the present study also included working memory measures to rule out that the group differences in numerical magnitude processing could be explained by differences in working memory. Consistent with the literature (De Smedt et al., 2009; Passolunghi & Siegel, 2004; Schuchardt et al., 2010; Van der Molen et al., 2009), our data revealed that both children with discrepant and nondiscrepant MD performed more poorly than control children on all three working memory tasks. Moreover, the finding that children with discrepant MD performed better than children with nondiscrepant MD on all three measures of working memory, while they performed at the same level on the numerical magnitude comparison tasks, suggests that
the observed difficulties in numerical magnitude processing in children with d and MD-nd were not merely the result of working memory impairments. This assumption was also confirmed by including working memory as a covariate in the analyses for numerical magnitude comparison. Indeed, these analyses showed that group differences on the numerical magnitude comparison tasks remained after controlling for working memory. In line with dyslexia research (e.g., Tanaka et al., 2011), it might be interesting to use neuroimaging techniques to further explore whether the brain activation patterns of children with discrepant MD during calculation or numerical magnitude processing tasks differ from these of children with nondiscrepant MD. These techniques might provide new avenues to explore the association between intelligence and the development of mathematics.
The finding that the numerical magnitude processing skills of children with discrepant and nondiscrepant MD did not differ, despite an IQ difference of 22 points, might have important implications for the teaching and remediation of children with mathematical difficulties. The present findings do not support the IQ-discrepancy based definitions of DD, it is therefore necessary to question the notion that different remedial approaches are needed for children with discrepant vs. nondiscrepant MD. Similarly to dyslexia research (Stuebing et al., 2002), it might be possible that both groups of children would equally benefit from similar interventions, although future research is needed to empirically test this assumption. By conducting the same numerical magnitude processing interventions in both children with MD-d and MD-nd, one could also gain more insight into the relationship between numerical magnitude processing, intelligence and mathematics achievement. If both groups of children would benefit in a similar way from the same intervention, this would provide additional evidence that deficits in numerical magnitude processing constitute a core deficit in MD, regardless of general intellectual ability.
5. Acknowledgements
We would like to thank all participating children, parents and teachers. This study was supported by the Marguerite-Marie Delacroix Support Fund and by grant G.0359.10 of the Research Foundation Flanders (FWO), Belgium.
6. References
American Psychiatric Association. (2000). Diagnostic and statistical manual of mental
disorders, (4th ed., text revision). Washington, DC: American Psychiatric Association.
Ashkenazi, S., Mark-Zigdon, N., & Henik, A. (2009). Numerical distance effect in
developmental dyscalculia. Cognitive development, 24, 387-400.
Baddeley, A. D. (1986). Working Memory. New York: Clarendon.
Baddeley, A. (2003). Working memory: Looking back and looking forward. Nature Reviews
Neuroscience, 4, 829-839.
Barth, H., Beckmann, L., & Spelke, E.S. (2008). Nonsymbolic, approximate arithmetic in
children: Abstract addition prior to instruction. Developmental Psychology, 44, 1466-1477.
Brankaer, C., Ghesquière, P., & De Smedt, B. (2011). Numerical magnitude processing in
children with mild intellectual disabilities. Research in Developmental Disabilities, 32,
2853-2859.
Brankaer, C., Ghesquière, P., & De Smedt, B. (2013). The development of numerical magnitude processing and its association with working memory in children with mild
intellectual disabilities. Research in Developmental Disabilities, 34, 3361-3371.
Brannon, E. (2006). The representation of numerical magnitude. Current Opinion in
Neurobiology, 16, 222-229.
Bugden, S., & Ansari, D. (2011). Individual differences in children’s mathematical competence are related to the intentional but not automatic processing of Arabic numerals.
Cognition, 118, 32-44.
Butterworth, B. (2005). Developmental dyscalculia. In J. I. D. Campbell (Ed.), Handbook of
Mathematical Cognition (pp. 455-467). Hove: Psychology Press.
Butterworth, B. (2010). Foundational numerical capacities and the origins of dyscalculia.
Butterworth, B., Varma, S., & Laurillard, D. (2011). Dyscalculia: From brain to education.
Science, 332, 1049-1053.
De Smedt, B., & Gilmore, C. K. (2011). Defective number module or impaired access?
Numerical magnitude processing in first graders with mathematical difficulties. Journal of
Experimental Child Psychology, 108, 278-292.
De Smedt, B., Janssen, R., Bouwens, K, Verschaffel, L., Boets, B, & Ghesquière, P. (2009). Working memory and individual differences in mathematics achievement: a longitudinal
study from first grade to second grade. Journal of Experimental Child Psychology, 103,
186-201.
De Smedt, B., Noël, M. P., Gilmore, C., & Ansari, D. (2013). The relationship between symbolic and non-symbolic numerical magnitude processing and the typical and atypical
development of mathematics: evidence from brain and behavior. Trends in Neuroscience and
Education, 2, 48-55.
De Smedt, B., Swillen, A., Devriendt, K., Fryns, J. P., Verschaffel, L., & Ghesquière, P. (2007). Mathematical disabilities in children with velo-cardio-facial syndrome.
Neuropsychologia, 45, 885–895.
De Smedt, B., Verschaffel, L., & Ghesquière, P. (2009). The predictive value of numerical
magnitude comparison for individual differences in mathematics achievement. Journal of
Experimental Child Psychology, 103, 469-479.
Desoete, A., Ceulemans, A., De Weerdt, F., & Pieters, F. (2012). Can we predict mathematical learning disabilities from symbolic and non-symbolic comparison tasks in
kindergarten? Evidence from a longitudinal study. British Journal of Educational Psychology,
82, 64-81.
Desoete, A., Roeyers, H., & De Clercq, A. (2004). Children with mathematics learning
De Vos, T. (1992). Tempo-Test-Rekenen. Handleiding [Tempo Test Arithmetic. Manual]. Nijmegen: Berkhout.
Fias, W., Menon, V., & Szucs, D. (2013). Multiple components of developmental dyscalculia.
Trends in Neuroscience and Education, 2, 43-47.
Fletcher, J. M., Lyon, G. R., Fuchs, L. S., & Barnes, M. A. (2007). Learning disabilities:
From identification to intervention. New York: Guilford Press.
Friso-van den Bos, I., van der Ven, S. H. G., Kroesbergen, E. H., & van Luit, J. E. H. (2013).
Working memory and mathematics in primary school children: A meta-analysis. Educational
Research Review, 10, 29-44.
Geary, D. C. (2011). Consequences, characteristics, and causes of mathematical learning
disabilities and persistent low achievement in mathematics. Journal of Developmental and
Behavioral Pediatrics, 32, 250-263.
Geary, D. C., Hoard, M. K., Byrd-Craven, J., Nugent, L., & Numtee, C. (2007). Cognitive mechanisms underlying achievement deficits in children with mathematical learning
disability. Child Development, 78, 1343-1359.
Ghesquière, P., & Ruijssenaars, A. (1994). Vlaamse normen voorstudietoetsen rekenen en
technisch lezen lager onderwijs [Flemish standards for study evaluation of mathematics and technical reading in primary schools]. Leuven, Belgium: Catholic University of Leuven, Center for Educational and Professional Guidance.
Gilmore, C., Attridge, N., Clayton, S., Cragg, L., Johnson, S., Marlow, N., … Inglis, M. (2013). Individual differences in inhibitory control, not non-verbal number acuity, correlate
with mathematics achievement. PLoS ONE, 8, e67374.
Griffin, S. (2003). The development of math competence in the preschool and early school years: cognitive foundations and instructional strategies. In J. M. Royer (Ed.), Mathematical Cognition (1-32). Connecticut: Information Age Publishing.
Gullick, M. M., Sprute, L. A., & Temple, E. (2011). Individual differences in working memory, nonverbal IQ, and mathematics achievement and brain mechanisms associated with symbolic and nonsymbolic number processing. Learning and Individual Differences, 21, 644-654.
Halberda, J., Ly, R., Wilmer, J. B., Naiman, D. Q., & Germine, L. (2012). Number sense
across the lifespan as revealed by a massive Internet-based sample. Proceedings of the
National Academy of Sciences, 109, 11116-11120.
Hoard, M. K., Geary, D. C., & Hamson, C. O. (1999). Numerical and arithmetical cognition:
performance of low- and average-IQ children. Mathematical Cognition, 5, 65-94.
Holloway, I.D., & Ansari, D. (2009). Mapping numerical magnitudes onto symbols: The numerical distance effect and individual differences in children’s mathematics achievement.
Journal of Experimental Child Psychology, 103, 17-29.
Hoskyn, M., & Swanson, H. L. (2000). Cognitive processing of low achievers and children
with reading disabilities: A selective meta-analytic review of the published literature. School
Psychology Review, 29, 1, 102-119.
Iuculano, T., Tang, J., Hall, C. W. B., & Butterworth, B. (2008). Core information processing
deficits in developmental dyscalculia and low numeracy. Developmental Science, 11,
669-680.
Izard, V., Sann, C., Spelke, E. S., & Streri, A. (2009). Newborn infants perceive abstract
numbers. Proceedings of the National Academy of Sciences of the United States of America,
106, 10382-10385.
Jones, S. M., & Brannon, E. M. (2012). Prosimian primates show ratio dependence in
spontaneous quantity discriminations. Frontiers in Psychology, 3, 550. doi:
10.3389/fpsyg.2012.00550
Landerl, K., Bevan, A., & Butterworth, B. (2004). Developmental dyscalculia and basic
Landerl, K., Fussenegger, B., Moll, K., & Willburger, E. (2009). Dyslexia and dyscalculia:
two learning disorders with different cognitive profiles. Journal of Experimental Child
Psychology, 103, 309-324.
Landerl, K., Göbel, S. M., & Moll, K. (2013). Core deficit and individual manifestations of
developmental dyscalculia (DD): The role of comorbidity. Trends in Neuroscience and
Education, 2, 38-42.
Landerl, K., & Kölle, C. (2009). Typical and atypical development of basic numerical skills in
elementary school. Journal of Experimental Child Psychology, 103, 546-565.
Linsen, S., Verschaffel, L., Reynvoet, B., & De Smedt, B. (2014). The association between
children’s numerical magnitude processing and mental multi-digit subtraction. Acta
Psychologica, 145, 75-83.
Maehler, C., & Schuchardt, K. (2009). Working memory functioning in children with learning
disabilities: does intelligence make a difference? Journal of Intellectual Disability Research,
53(1), 3-10.
Mazzocco, M. M. M., Feigenson, L., & Halberda, J. (2011). Impaired acuity of the
approximate number system underlies mathematical learning disability (dyscalculia). Child
Development, 82, 1224-1237.
Moelands, F., Kamphuis, F., & Verhoeven, L. (2003). Verantwoording Drie-Minuten-Toets
[Justification of the Three-Minutes-Test]. Arnhem, The Netherlands: Cito.
Moelands, F., & Rymenans, R. (2003). Drie-Minuten-Toets voor Vlaanderen: Handleiding
[Three-Minute-Test for Flanders: Manual]. Arnhem, The Netherlands: Citogroep.
Moyer, R. S., & Landauer, T. K. (1967). Time required for judgements of numerical
Murphy, M. M., Mazzocco, M. M. M., Hanich, L. B., & Early, M. C. (2007). Cognitive characteristics of children with mathematics learning disability (MLD) vary as a function of
the cutoff criterion to used to define MLD. Journal of Learning Disabilities, 40, 458-478.
Mussolin, C., Mejias, S., & Noël, M. P. (2010). Symbolic and nonsymbolic number
comparison in children with and without dyscalculia. Cognition, 115, 10-25.
Noël, M. P., & Rousselle, L. (2011). Developmental changes in the profiles of dyscalculia: an explanation based on a double exact-and-approximate number representation model.
Frontiers in Human Neuroscience, 5, 165.
Noël, M. P., Rousselle, L., & Mussolin, C. (2005). Magnitude representation in children: Its
development and dysfunction. In J. I. D. Campbell (Ed.), Handbook of mathematical
cognition (pp. 179-195). Hove, UK: Psychology Press.
O’Hearn, K., & Landau, B. (2007). Mathematical skill in individuals with Williams
syndrome: Evidence from a standardized mathematics battery. Brain and Cognition, 64,
238-246.
Passolunghi, M. C., & Siegel, L. S. (2004). Working memory and access to numerical
information in children with disability in mathematics. Journal of Experimental Child
Psychology, 88, 348-367.
Passolunghi, M. C., & Lanfranchi, S. (2012). Domain-specific and domain-general precursors
of mathematical achievement: A longitudinal study from kindergarten to first grade. British
Journal of Educational Psychology, 82, 42-63.
Piazza, M., Izard, V., Pinel, P., Le Bihan, D., & Dehaene, S. (2004). Tuning curves for
approximate numerosity in the human intraparietal sulcus. Neuron, 44, 547-555.
Pickering, S., & Gathercole, S. (2001). Working Memory Test Battery for Children
Raven, J.C., Court, J.H., & Raven, J. (1992). Standard progressive matrices. Oxford, UK: Oxford Psychologists Press.
Raven, J., Raven, J. C., & Court, J. H. (2004). Manual for Raven’s Progressive Matrices and
Vocabulary Scales. San Antonio, TX: Harcourt Assessment.
Reigosa-Crespo, V., Valdés-Sosa, M., Butterworth, B., Estévez, N., Rodríguez, M., Santos, E., … Lage, A. (2012). Basic numerical capacities and prevalence of developmental
dyscalculia: The Havana survey. Developmental Psychology, 48, 123-135.
Rousselle, L., & Noël, M. P. (2007). Basic numerical skills in children with mathematics learning disabilities: a comparison of symbolic vs. non-symbolic number magnitude
processing. Cognition, 102, 361-395.
Schneider, W., Eschmann, A., & Zuccolotto, A. (2002). E-prime reference guide. Pittsburg,
PA: Psychology Software Tools.
Schuchardt, K., Gebhardt, M., Mäehler, C. (2010). Working memory functions in children
with different degrees of intellectual disability. Journal of Intellectual Disability Research,
54, 346-353.
Sekuler, R., & Mierkiewicz, D. (1977). Children’s judgments of numerical inequality. Child
Development, 48, 630-633.
Simon, T. J., Takarae, Y., DeBoer, T., McDonald-McGinn, D. M., Zackai, E. H., & Ross, J. L. (2008). Overlapping numerical cognition impairments in children with chromosome
22q11.2 deletion or Turner syndromes. Neuropsychologica, 46, 82-94.
Stanovich, K. E. (1996). Toward a more inclusive definition of dyslexia. Dyslexia, 2,
154-166.
Stuebing, K. K., Fletcher, J. M., LeDoux, J. M., Lyon, G. R., Shaywitz, S. E., & Shaywitz, B. A. (2002). Validity of IQ-discrepancy classifications of reading disabilities: a meta-analysis.
Tanaka, H., Black, J. M., Hulme, C., Stanley, L. M., Kesler, S. R., Whitfield-Gabrieli, … Hoeft, F. (2011). The brain basis of the phonological deficit in dyslexia is independent of IQ.
Psychological Science, 22, 1442-1451.
Temple, C. M. (1992). Developmental dyscalculia. In S. J. Segalowitz & I. Rapin (Eds.),
Handbook of neuropsychology (pp. 211-222). New York: Elsevier.
Vanbinst, K., Ghesquière, P., & De Smedt, B. (2012). Numerical magnitude representations
and individual differences in children’s arithmetic strategy use. Mind, Brain, and Education,
6, 129-136.
Van der Molen, M. J., Van Luit, J. E. H., Jongmans, M. J., Van der Molen, M. W. (2009). Memory profiles in children with mild intellectual disabilities: strengths and weaknesses.
Research in Developmental Disabilities, 30, 1237-1247.
Wechsler, D. (1992). Wechsler Intelligence Scale for Children – 3rd UK Edition (WISC-III
UK). London: Psychological Corporation.
Xu, F., & Arriaga, R. I. (2007). Number discrimination in 10-month-old infants. British
Table 1
Descriptive statistics of the sample
Group n Sex Age in years IQa Mathematicsb Readingc
MD-nd 14 8 boys, 6 girls 8.27 (0.60) 77.36 (4.24) 6.14 (3.74) 16.07 (14.94)
MD-d 14 12 boys, 2 girls 7.94 (0.50) 99.43 (10.58) 8.36 (2.74) 25.43 (14.36)
CA 14 6 boys, 8 girls 8.27 (0.24) 105.21 (6.96) 19.00 (4.77) 70.57 (17.33)
Note. a IQ-score on Raven’s Standard Progressive Matrices. b Number of correctly solved
addition problems on Tempo Test Arithmetic. c Number of correctly read items on Three
Minute Test. MD-nd = Nondiscrepant Mathematical Difficulties; MD-d = Discrepant Mathematical Difficulties; CA = Chronological Age matched control children. Standard deviations are presented in parentheses.
Table 2
Average slopes and standard deviations for each group and numerical magnitude comparison task
Group Symbolic comparison Non-symbolic comparison
M SD M SD
MD-nd -88.32 74.91 -88.41 50.67
MD-d -68.53 32.20 -75.79 61.53
CA -37.64 17.54 -42.90 11.20
Note. MD-nd = Nondiscrepant Mathematical Difficulties; MD-d = Discrepant Mathematical
Figure Captions
Figure 1. Mean accuracy on the numerical magnitude comparison tasks as a function of group. MD-nd = Nondiscrepant Mathematical Difficulties; MD-d = Discrepant Mathematical
Difficulties; CA = Chronological Age matched control group. Error bars depict 1SE of the
mean.
Figure 2. Mean adjusted reaction time (based on correct responses only) on the numerical magnitude comparison tasks as a function of group. MD-nd = Nondiscrepant Mathematical Difficulties; MD-d = Discrepant Mathematical Difficulties; CA = Chronological Age matched
control group. Error bars depict 1SE of the mean.
Figure 3. Number of correctly recalled items on the working memory tasks as a function of group. MD-nd = Nondiscrepant Mathematical Difficulties; MD-d = Discrepant Mathematical
Difficulties; CA = Chronological Age matched control group. Error bars depict 1SE of the
Figure 1
Numerical Magnitude Comparison
,70 ,75 ,80 ,85 ,90 ,95 1,00 Symbolic Non-symbolic A c c ura c y ( P rop ort ion c orr e c t) MD-nd MD-d CA
Figure 2
Numerical Magnitude Comparison
500 600 700 800 900 1000 1100 1200 1300 1400 Symbolic Non-symbolic A dj us te d R T (m s ) MD-nd MD-d CA
Figure 3 Working memory 0 2 4 6 8 10 12 14
Digit Span Forward Corsi Block Digit Span Backward
A c c ura c y ( nu m be r of c orr e c tl y r e c a ll e d it e m s ) MD-nd MD-d CA