R E S E A R C H A R T I C L E
Open Access
An
“
Axiom
Cajanus
SNP Array
”
based high
density genetic map and QTL mapping for
high-selfing flower and seed quality traits
in pigeonpea
Pooja Yadav
1,2, K. B. Saxena
1, Anupama Hingane
1, C. V. Sameer Kumar
1, V. S. Kandalkar
2, Rajeev K. Varshney
1and
Rachit K. Saxena
1*Abstract
Background:Pigeonpea has considerable extent of insect-aided natural out-crossing that impedes genetic purity of seeds. Pre-anthesis cleistogamy in pigeonpea promotes self-pollination which helps in maintaining genetic purity. The cleistogamous flowers are linked with shriveled seeds, an undesirable trait from variety adoption point of view, and breeding using genomics tools can help in overcoming this constraint. Therefore, in order to identify genomic regions governing these target traits, one recombinant inbred line (RIL) population was developed using contrasting parents (ICPL 99010 and ICP 5529) for flower shape and shriveled seeds. The RILs were phenotyped for two years and genotyped using the AxiomCajanusSNP Array.
Results:Out of the 56,512 unique sequence variations on the array, the mapping population showed 8634 single nucleotide polymorphism (SNPs) segregating across the genome. These data facilitated generation of a high density genetic map covering 6818 SNPs in 974 cM with an average inter-marker distance of 0.1 cM, which is the lowest amongst all pigeonpea genetic maps reported. Quantitative trait loci (QTL) analysis using this genetic map and phenotyping data identified 5 QTLs associated with cleistogamous flower, 3 QTLs for shriveled seed and 1 QTL for seed size. The phenotypic variance explained by these QTLs ranged from 9.1 to 50.6%. A consistent QTL“qCl3.2” was identified for cleistogamous flower on CcLG03 covering a span of 42 kb in the pigeonpea genome. Epistatic QTLs were also identified for cleistogamous flower and shriveled seed traits.
Conclusion:Identified QTLs and genomic interactions for cleistogamous flower, shriveled seed and seed size will help in incorporating the required floral architecture in pigeonpea varieties/lines. Besides, it will also be useful in understanding the molecular mechanisms, and map-based gene cloning for the target traits.
Keywords:Cleistogamous flower, Selfing, Mapping, Shriveled seed, AxiomCajanusSNP Array, QTLs Background
Worldwide legumes are recognized for their high protein seeds and various soil improvement properties, as they occupy 5.8% of the total arable land [1]. For those living in the tropics and sub-tropics and earning their liveli-hoods with subsistence agriculture, pigeonpea [Cajanus cajan(L.) Millsp.] is an important legume crop. Globally
pigeonpea is cultivated on 5.41 m ha with a production of 4.49 m t [2] in parts of Asia, Africa, Latin America, and Caribbean islands.
Most legume species are highly self-pollinated but there are some exceptions and pigeonpea is one of them with average insect-aided natural cross-pollination up to 40% [3]. Although the natural out-crossing of pigeonpea has been successfully used in breeding hybrids [4], it causes serious inefficiencies in pure line and mainten-ance breeding programs. There are several examples where the key varietal traits such as productivity, disease
© The Author(s). 2019Open AccessThis article is distributed under the terms of the Creative Commons Attribution 4.0 International License (http://creativecommons.org/licenses/by/4.0/), which permits unrestricted use, distribution, and reproduction in any medium, provided you give appropriate credit to the original author(s) and the source, provide a link to the Creative Commons license, and indicate if changes were made. The Creative Commons Public Domain Dedication waiver (http://creativecommons.org/publicdomain/zero/1.0/) applies to the data made available in this article, unless otherwise stated. * Correspondence:[email protected]
1International Crops Research Institute for the Semi-Arid Tropics (ICRISAT),
Patancheru 502 324, India
resistance, and seed quality were lost due to uncon-trolled pollination of released cultivars [5,6].
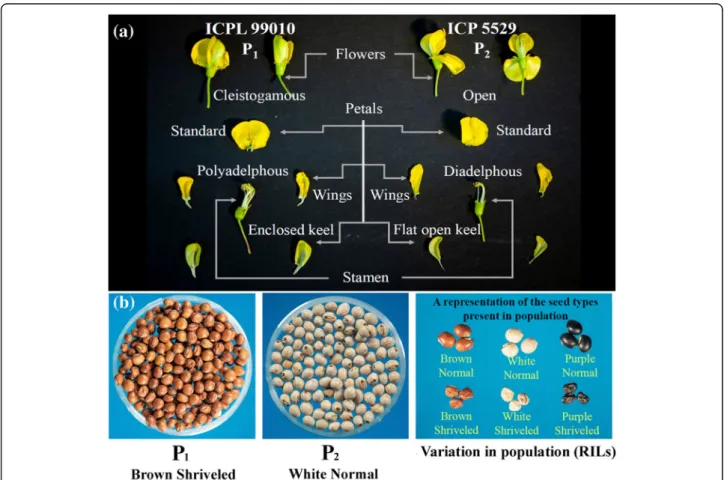
For a long time pigeonpea breeders were on the look-out for a genetic solution for this constraint and the suc-cess was achieved when Saxena et al. (1992) selected a unique recombinant within the segregating population of an inter-specific cross betweenC. cajanandC. lineatus [7]. This transgressive segregant, designated as “ pre-anth-esis cleistogamous flower”, was characterized by delayed flower opening and modified floral morphology and anther configuration. In such unique flowers, the keel, standard and wing petals are wrapped (Fig.1a). Also in these flowers, unlike typical pigeonpea flowers with diadelphous (9 + 1) anther configuration, all the 10 anthers are individually
attached to the base. Saxena et al. [8] demonstrated
that in the lines with cleistogamous flowers the natural out-crossing under field conditions was around 2%, as compared to over 30% in the genotypes with normal flowers. Unfortunately, the pre-anthesis cleistogamous flower trait was found to be strongly linked to undesirable traits such as shriveled and small seeds (Fig.1b). Such gen-etic linkages adversely affect the breeding of marketable
pigeonpea cultivars with high self-pollinating habit. This constraint, however, can be overcome through the integra-tion of modern genomics technologies in pure line breeding programs.
In the last decade there have been significant develop-ments in pigeonpea genomics including development of molecular markers e.g. simple sequence repeats (SSRs) [9–12] single nucleotide polymorphism (SNP) [13], high
density genotyping platforms [13–15] genetic maps
[10, 13, 16, 17], transcriptome assemblies [12, 18, 19], gene expression atlas [20], reference genome [21] and whole genome re-sequencing data for hundreds of pigeon-pea lines [22,23] have become available. These resources have been used in identification of genomic segments or quantitative trait loci (QTL) associated with economical important traits for pigeonpea improvement [24–27]. How-ever, genomic segments/molecular markers associated with cleistogamous flower and shriveled seed in pigeonpea have not been identified till now. Therefore, the present study has been planned to use one recombinant inbred line (RIL) population developed for cleistogamous flower and shriv-eled seed traits. The high density genotyping with Axiom
Fig. 1Diagrammatic representation of the contrasting features in crossing parents (P1: ICPL 99010 and P2: ICP 5529) of mapping population.a
Dissection of cleistogamous flower in P1and open flower in P2to present difference in aestivation and stamen structure.bFirst from the left i.e.
CajanusSNP Array [28] and phenotyping of RILs have pro-vided genomic segments associated with cleistogamous flower and shriveled seed traits. Further, we have also iden-tified a number of interactions in the genomic segments re-sponsible for above mentioned traits. These results will be of help in designing the crop improvement strategies for understanding/transferring the cleistogamous flower in re-leased/target varieties with desirable seed size and shape following genomics-assisted breeding (GAB) approaches. Results
Phenotyping of target traits
In the present study a high-selfing cleistogamous line ICPL 99010 was crossed with an adapted pigeonpea in-bred line ICP 5529 and a mapping population of 80 RILs was developed. The phenotypic data on cleistogamous flowers and shriveled seeds were collected for two years on 80 RILs derived from this cross in F6and F7 genera-tions. In year 1, 35 RILs showed cleistogamous flowers while 45 RILs had open flowers. To confirm the traits stability in year 2, 10 to 12 individual plants from each RIL were phenotyped in progeny to row manner. Out of 80 RILs (880 plants), 76 RILs (832 plants) had no intra-progeny segregation or true types to the first year phenotype (cleistogamous flowers: 33 RILs and open flowers: 43 RILs), whereas, 48 plants representing 4 RILs showed segregation for cleistogamous and open flowers. The segregation pattern for cleistogamous and open flowers in RILs have indicated the involvement of single gene withP value 0.26 and 0.25 in year 1 and year 2 re-spectively (Additional file1: Table S1).
For second target trait i.e. shriveled/normal seeds, the phenotypic data were collected on all the harvested seeds from individual plants. In the year 1, 21 and 59 RILs possessed shriveled and normal seeds respectively. Similar to the cleistogamous flower trait in the year 2, seeds from individual plants were also phenotyped. Out of 80 RILs (880 plants), 61 RILs (684 plants) had no seg-regation or true types to the first year phenotype (shriv-eled seeds: 17 RILs and normal seeds: 44 RILs), whereas, 196 plants in 19 RILs showed segregation for shriveled and normal seeds. Phenotyping data on shriveled/normal seeds have shown possible control of two genes on this trait (P value 0.8 and 0.6 in year 1 and year 2 respect-ively) (Additional file 1: Table S1). In parallel, seed size data were also recorded in RILs for the year 1 and the year 2. In the year 1, the seed size ranged from 4.8 g to 11.4 g with an average of 8.5 g whereas in the year 2, it ranged from 4.6 g to 17.8 g with an average of 8.4 g. In order to see the possible correlation between seed size data with the shriveled and normal seeds, a scatter plot was formed with the RILs showing consistent behavior in both the years. In general, in both the years shriveled seeds showed lesser seed size as compared to normal
seeds (Fig.2). In year 1 the average value of seed size in 16 RILs carrying shriveled seeds was 6 .4g and in 37 RILs carrying normal seeds was 9 .4g. Almost similar observa-tions were made in year 2, where average value of seed size in 16 RILs carrying shriveled seeds was 5 .7g and in 37 RILs carrying normal seeds was 9 .5g.
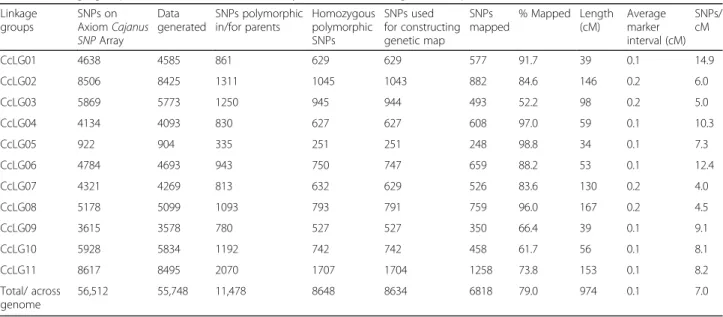
High density genetic map with 6 .8K SNPs
High quality DNA could be isolated from 72 RILs from a total of 80 RILs. These 72 RILs were used for high
density genotyping using Axiom Cajanus SNP Array.
Out of 56,512 SNPs placed on Axiom Cajanus SNP
Array, the genotyping data on 72 RILs and parents were
generated for 55,748 SNPs (Table 1). From these SNPs,
11,478 SNPs were polymorphic and 44,270 SNPs were monomorphic between parents. Further, polymorphic SNPs showing heterozygous alleles (2830 SNPs) in any
of the parents and 14 duplicated SNPs in Axiom
Caja-nus SNP Array (placed two times in array due to their
importance) [28] were removed from further analysis. As a result, a total of 8634 non redundant SNPs with homo-zygous alleles and polymorphic between parents were considered for the construction of genetic map (Table 1). Genotyping data obtained for all 8634 SNPs on RILs were tested for the Mendelian/non-Mendelian segregation pat-tern. The largest group i.e. 5733 SNPs were categorized into Pvalues ranging from 0.00–0.05. While the smallest group of 264 SNPs were falling intoPvalues ranging from 0.06– 0.10. The other two marker groups contained 1384 and
1253 SNPs with P values of 0.11–0.50 and 0.51–1.00
respectively. Genotyping data for 8634 polymorphic SNPs generated on 72 RILs were used for genetic map
con-struction. ElevenCajanus cajanlinkage groups (CcLGs:
CcLG01–CcLG11) were generated using an LOD
(loga-rithm of the odds) threshold value of 5. A total of 1816 SNPs that failed to be assigned to these CcLGs were not incorporated in further genetic mapping. As a re-sult, 6818 SNPs could be mapped on 11 CcLGs
cover-ing 974 cM (Table 1). CcLG05 was the shortest with
248 SNPs mapped with 34 cM distance. The longest was CcLG11 with 1258 mapped SNPs covering a dis-tance of 153 cM. Highest marker density was observed for CcLG01, which had 14.9 markers per cM, whereas the lowest marker density was observed for CcLG07 with 4.0 markers per cM. Overall, the genetic map had 7 markers per cM (Table 1, Fig. 3, Additional file 2: Table S2).
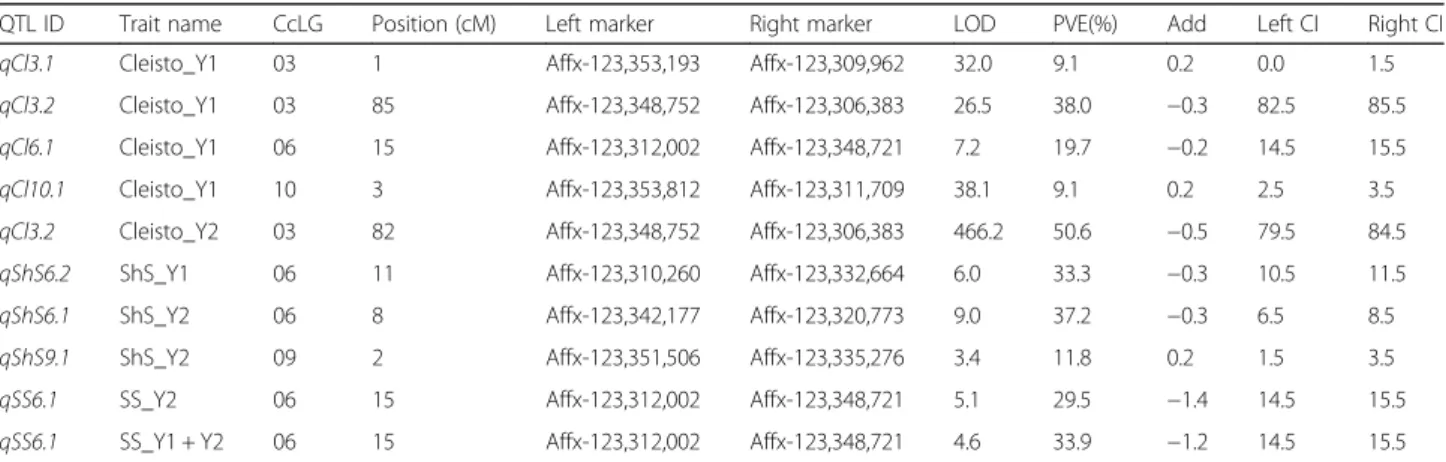
QTLs for target traits
Phenotypic data together with SNP genotyping data were used for QTL analysis using composite interval mapping (CIM). Based on the phenotypic variance ex-plained (PVE), identified QTLs were classified as major
identified QTLs were also classified as consistent QTLs (appeared in more than one year). For each trait details on QTLs identified have been explained below.
QTLs for cleistogamous flower
A total of five QTLs (four in year 1 and one in year 2) were identified for cleistogamous flower. In year 1, two
major QTLs (qCl3.2andqCl6.1) on CcLG03 and CcLG06
and two minor QTLs (one each on CcLG03 and CcLG10) were detected (Table 2). The "qCl3.2" QTL flanked by Affx-123,348,752 and Affx-123,306,383 markers has shown 38% PVE. Another major QTL i.e."qCl6.1"flanked by Affx-123,312,002 and Affx-123,348,721 markers has shown 19.7% PVE. Whereas, in the year 2 only one major QTL flanked by Affx-123,348,752 and Affx-123,306,383
markers with 50.6% PVE was identified (Table 2). The
Fig. 2Scatter plot showing lower seed size in shriveled seeds compared to normal seeds.“Y-axis”represents the seed size (100 seed weight in grams) and“X-axis”shows line numbers
Table 1Linkage group wise distribution and summary on SNPs used for genetic map construction
Linkage groups SNPs on AxiomCajanus SNPArray Data generated SNPs polymorphic in/for parents Homozygous polymorphic SNPs SNPs used for constructing genetic map SNPs mapped % Mapped Length (cM) Average marker interval (cM) SNPs/ cM CcLG01 4638 4585 861 629 629 577 91.7 39 0.1 14.9 CcLG02 8506 8425 1311 1045 1043 882 84.6 146 0.2 6.0 CcLG03 5869 5773 1250 945 944 493 52.2 98 0.2 5.0 CcLG04 4134 4093 830 627 627 608 97.0 59 0.1 10.3 CcLG05 922 904 335 251 251 248 98.8 34 0.1 7.3 CcLG06 4784 4693 943 750 747 659 88.2 53 0.1 12.4 CcLG07 4321 4269 813 632 629 526 83.6 130 0.2 4.0 CcLG08 5178 5099 1093 793 791 759 96.0 167 0.2 4.5 CcLG09 3615 3578 780 527 527 350 66.4 39 0.1 9.1 CcLG10 5928 5834 1192 742 742 458 61.7 56 0.1 8.1 CcLG11 8617 8495 2070 1707 1704 1258 73.8 153 0.1 8.2 Total/ across genome 56,512 55,748 11,478 8648 8634 6818 79.0 974 0.1 7.0
major QTL “qCl3.2” flanked by Affx-123,348,752 and Affx-123,306,383 markers was also classified as consist-ent QTL for cleistogamous flower. Flanking markers (positions in the draft genome) of the consistent QTL
“qCl3.2” were used to retrieve the gene information from the draft genome [21]. As a result, 20 genes were found in 42 Kb genomic region covered by "qCl3.2". Out of 20 genes, 5 were uncharacterized and for two
genes with unknown function (Additional file 3: Table
S3). Functional annotation of remaining 13 genes have shown their role in biological process such as cell wall synthesis, protein transport, cell signaling and in defense mechanism such as response to heat shock etc. Further, above mentioned 20 genes in "qCl3.2" can be considered as a starting point in identification of causal
genes responsible for cleistogamous flower in pigeon-pea. A number of approaches can be used in future for this purpose such as region specific deep sequencing or whole genome resequencing based fine mapping, func-tional studies based on transcriptome, etc.
QTLs for shriveled seed
There were three major QTLs (one appeared in the year 1 and two appeared in the year 2) identified for shriveled seed on CcLG06 and CcLG09. In the year 1, the major QTL
“qShS6.2” on CcLG06 flanked by Affx-123,310,260 and Affx-123,332,664 has shown 33.3% PVE. Whereas, in the year 2, two major QTLs one each on CcLG06 (qShS6.1) and CcLG09 (qShS9.1) were identified. The QTL“qShS6.1”
flanked by Affx-123,342,177 and Affx-123,320,773 Fig. 36 .8K high density genetic map with QTLs for target trait. QTL names in green color are for cleistogamous flower; QTL names in blue color are for shriveled seed; QTL names in black color for seed size
Table 2QTLs identified for target traits in RILs developed from ICPL 99010 × ICP 5529
QTL ID Trait name CcLG Position (cM) Left marker Right marker LOD PVE(%) Add Left CI Right CI
qCl3.1 Cleisto_Y1 03 1 Affx-123,353,193 Affx-123,309,962 32.0 9.1 0.2 0.0 1.5
qCl3.2 Cleisto_Y1 03 85 Affx-123,348,752 Affx-123,306,383 26.5 38.0 −0.3 82.5 85.5
qCl6.1 Cleisto_Y1 06 15 Affx-123,312,002 Affx-123,348,721 7.2 19.7 −0.2 14.5 15.5
qCl10.1 Cleisto_Y1 10 3 Affx-123,353,812 Affx-123,311,709 38.1 9.1 0.2 2.5 3.5
qCl3.2 Cleisto_Y2 03 82 Affx-123,348,752 Affx-123,306,383 466.2 50.6 −0.5 79.5 84.5
qShS6.2 ShS_Y1 06 11 Affx-123,310,260 Affx-123,332,664 6.0 33.3 −0.3 10.5 11.5
qShS6.1 ShS_Y2 06 8 Affx-123,342,177 Affx-123,320,773 9.0 37.2 −0.3 6.5 8.5
qShS9.1 ShS_Y2 09 2 Affx-123,351,506 Affx-123,335,276 3.4 11.8 0.2 1.5 3.5
qSS6.1 SS_Y2 06 15 Affx-123,312,002 Affx-123,348,721 5.1 29.5 −1.4 14.5 15.5
explained phenotypic variation of 37.2% and QTL
“qShS9.1”flanked by Affx-123,351,506 and Affx-123,335,276
had 11.8% PVE (Table 2). Though major QTLs namely
“qShS6.1”and“qShS6.2”were closely located on CcLG06 (at 3 cM distance) appeared in the year 1 and 2, respectively but not considered as consistent QTL. A total of 113 genes were found in the above mentioned QTL regions. The QTLs “qShS6.1” (21 kb), “qShS6.2” (22 kb) and “qShS9.1” (16 kb) contained 13, 96 and 4 genes respectively (Add-itional file4: Table S4).
QTLs for seed size
Two major QTLs (one each appeared in the year 2 and in pooled analysis) were detected for seed size on CcLG06 (Table2). In the year 1, though few minor QTLs with very low PVE were detected but no major QTL identified.
In the year 2, one major QTL “qSS6.1” flanked by
Affx-123,312,002 and Affx-123,348,721 markers with 29.5% PVE was identified. The pooled analysis of year 1 and 2 data has also detected“qSS6.1”with 33.9% PVE. Epistatic QTLs associated with target traits
The epistatic interactions for all three traits were also ana-lyzed. As a result, 64 pairwise QTLs were detected across all the CcLGs (Fig. 4, Additional file 5: Table S5). These pairwise QTLs have shown the PVE in the range of 1.2 to 8.5% with LOD > 5. There were 59 epistatic QTLs in-volved with cleistogamous flower whereas, 5 epistatic
QTLs associated with shriveled seed. The genetic variance caused by additive × additive epistasis was ranging from− 0.3 to + 0.5 in 64 pairwise QTLs. There were 13 different epistatic interactions (4 in year 1 and 9 in year 2) found for the consistent QTL“qCl3.2”for cleistogamous flower with similar PVE of 5.9%. The QTL“qCl6.1”for cleistog-amous flower showed 8 epistatic interactions in which 5 epistatic QTL pairs were detected for cleistogamous flower (4 in year 1 with 3.7% PVE and 1 in year 2 with 5.9% PVE) whereas 3 epistatic QTL pairs were found for shriveled seed with 8.5% PVE (Table3). There was no sig-nificant epistatic interaction found for seed size.
Discussion
Pigeonpea improvement activities over the last sixty years have led to the release of over 100 varieties through pedi-gree breeding http://iipr.res.in/pdf/iipr_piegeonpea.pdf In these cultivars, a number of advancements were made in terms of crop adaptation patterns, reduction of crop dur-ation, enhanced diseases resistance etc. These traits have helped in increasing the area but sustaining these gains is becoming difficult due to varietal contamination caused by natural cross-pollination. The incorporation of pre-anthesis cleistogamy [29] in future pigeonpea cultivars can help in overcoming this menace. Although, some efforts were made in the past to incorporate this trait but so far no success has been achieved in breeding high yielding high-selfing cultivars due to the difficulties posed by its
Fig. 4A schematic illustration of the epistatic QTLs for cleistogamous flower and shriveled seed traits. Different colors in the ring represent 11 CcLGs. The number in ovals on ring indicating marker positions on CcLGs. Dash lines are representing epistatic interactions between loci. Numbers on dash lines indicating the LOD scores of additive × additive effects
adverse association with unwanted seed traits. Inherit-ance studies of cleistogamous flower trait in pigeonpea [29], durum wheat [30] and rice [31] revealed its single gene control. Whereas, in soybean [32] and barley [33] two or more genes showing epistatic interactions gov-erned this trait. The development of a dense genetic map and genomic regions associated with cleistogam-ous flower, shriveled seed and seed size is an important event in pigeonpea breeding which can lead to a break-through in breeding the desired genotypes.
A genetic map containing 6818 SNPs with a map
dis-tance of 974 cM was constructed using Axiom Cajanus
SNP array. Number of markers mapped in the present study was higher than the earlier genetic maps in pigeonpea [10, 13, 16, 17, 25–27, 34, 35]. The average inter-marker distance observed (0.1 cM) was the lowest in all the genetic mapping studies conducted in pigeon-pea so far [10,13,16,17,25–27,34,35], which indicates better saturation of available genetic map. The present genetic map has shown only 2 large gaps one each on CcLG03 and CcLG08 with marker intervals > 20 cM. Therefore, the developed genetic map in the present study will be an important resource for not only QTL identification and understanding the association between cleistogamous flower with shriveled seed trait but also in QTL cloning and identification of candidate genes.
QTL mapping for cleistogamous flower, shriveled seed and seed size have revealed 10 significant QTLs with 8 of these QTLs showing major effects with PVE of more than 10%. The identified QTLs in the present study are novel as this is the first report of mapping QTLs for above men-tioned traits in pigeonpea. However, only one consistent QTL for cleistogamous flower and no consistent QTLs for shriveled seeds and seed size were identified. This might be due to the presence of environment interactions over the years coupled with small population size. It is interesting to
note that we found 5 QTLs on CcLG06 with significant ef-fects for cleistogamous flower, shriveled seeds and seed size.
For pigeonpea, the association between any modifica-tion to the flower structure and deformed or shriveled seed shape has been commonly observed, including in the present study. Moreover, the genomic segments or QTLs for these traits have not been investigated earlier and remain unknown. The existence of five major QTLs
(qCl3.2, qCl6.1, qShS6.1, qShS6.2 and qSS6.1) with
op-posite effects for cleistogamous flower, shriveled seeds and seed size in the current study provides an ideal ex-ample to test above mentioned hypothesis at the genome level. This is also the first study that provides genomic evidences to clearly demonstrate the presence of linkage drag among cleistogamous flower, shriveled seeds and seed size in pigeonpea. It is also important to mention here that shriveled seed may have a confounding effect on seed size as also seen in the regression between the two traits; hence seed size should be mapped in a popu-lation or sub-popupopu-lation with normal seeds only. In this study, the presence of only additive × additive epistatic interactions reaffirms the fact that the trait was governed by one or two major genes. Also the range of PVE was very less for cleistogamous flower interactions but was high for the major consistent QTL which suggested that there were not many genomic regions governing this trait and the major contribution for cleistogamous flower was attributed to“qCl3.2”. Therefore, a strategy is required to introgression of "qCl3.2" through GAB for transferring cleistogamous flower in elite cultivars with-out decreasing the seed size and shriveled seeds.
Methods
Mapping population
The experimental material consisted of 80 RILs derived from a cross between ICPL 99010 and ICP 5529. The Table 3Epistatic interactions identified for cleistogamous flower and shriveled seeds across pigeonpea genome
Trait CcLG Total interactions aCcLGs in interaction PVE range
Cleistogamous flower CcLG01 5 3, 4, 7, 8, 11 1.2–5.9 CcLG02 9 3, 4, 5, 6, 7, 8, 10, 11 1.2–5.9 CcLG03 16 4, 5, 6, 7, 8, 9, 10, 11 1.2–5.9 CcLG04 7 5, 6, 7, 8, 9, 11 1.2–3.7 CcLG05 7 6, 7, 8, 9, 10, 11 1.2–1.8 CcLG06 5 7, 8, 9, 10, 11 1.2–3.7 CcLG07 4 8, 9, 10, 11 1.2 CcLG08 4 9, 10, 11 1.2–2.5 CcLG09 1 11 1.2 CcLG10 1 11 1.2 Shriveled seed CcLG03 3 6, 8, 11 6.0–8.5 CcLG06 2 8, 11 8.5 a
female parent (ICPL 99010) contains cleistogamous flowers and shriveled seeds, whereas, the male parent
(ICP 5529) had open flowers and normal seeds (Fig. 1).
The F1s produced were advanced till F6 generation by
using single seed descent method. The population was advanced with 75 cm distance between rows and 30 cm distance between plants in a 4 m long row following the recommended agronomic practices as mentioned in Obala et al. [36].
Phenotyping
Phenotyping of RILs for cleistogamous flower and shriv-eled seed traits was carried out in two cropping seasons
(2016–17 and 2017–18). The flowers from each RIL
were phenotyped for cleistogamous and open flower based on visual assessment in the field three times in a day viz. morning (0700 h), afternoon (1300 h) and even-ing (1800 h). The observations on cleistogamous and open flower were taken on at least 10 flowers represent-ing different parts of the srepresent-ingle plant. The phenotypic observation divided flowers into two categories based on pattern of arrangement of petals and fused or non-fused anthers. The cleistogamous flowers remained closed while the open flowers gradually exposed its stamen and carpel when buds bloomed into flowers. On the con-trary, cleistogamous flowers were observed to be en-wrapped throughout the flowering season viz. initiation of flowering, at 50% flowering, at 75% flowering till the pod formation. In year 1 (2016–17) single plant repre-senting individual RIL was phenotyped, whereas, in sec-ond year (2017–18) 10–12 plants were phenotyped from each RIL. Thus a total of 880 plants representing 80 RILs were phenotyped for cleistogamous flower in year 2. Harvested seeds from all above mentioned plants representing 80 RILs were also phenotyped for shriveled or normal shape and seed size in both the years.
DNA isolation and SNP genotyping
Genomic DNA was isolated from three to four young leaves of individual plants of each RIL, using a NucleoSpin Plant II kit (Macherey-Nagel, Düren, Germany). The qual-ity of DNA was checked on 0.8% agarose gel and DNA quantity assessed on Qubit® 2.0 Fluorometer (Thermo Fisher Scientific Inc., USA). The high density genotyping
on RILs was performed through 56 K Axiom Cajanus
SNP Array as described in Saxena et al. (2018) [28]. This
Axiom Cajanus SNP Array has been developed recently
using WGRS data on elite breeding lines and filtering se-quence variations through Axiom GTv1 algorithm [28]. Genetic map construction
The maternal and paternal alleles were marked ‘2’ and
‘0’ while the missing values were marked ‘-1’. The link-age analysis was done by comparing SNPs with expected
segregation ratio of 1:1 using χ2 test. The SNPs were
sorted and grouped into different CcLGs. The SNPs showing polymorphism between parental genotypes were selected for construction of genetic map. The MAP
model of QTL IciMapping software version 4.1 (www.
isbreeding.net) was used for construction of genetic map
[37]. QTL IciMapping was based on inclusive composite
interval mapping (ICIM) method [38, 39]. Kosambi
mapping function was used to estimate the map dis-tances (cM) from recombination frequencies [40]. There were three steps in building a linkage map using ICI-Mapping viz. grouping, ordering and rippling. Grouping in QTL IciMapping was done based on regression map-ping algorithm with a threshold LOD score of 5.
Order-ing algorithm of ‘nnTwoOpt’ and the rippling criteria
SARF (sum of adjacent recombination frequencies) were used with a window size of 5 SNPs.
Quantitative trait locus (QTL) analysis
The phenotypic data together with the genotyping data were used for QTL analysis for target traits using BIP model of QTL IciMapping version 4.1 [37]. The main ef-fect QTLs were determined by ICIM-ADD with a default LOD threshold value of 2.5. The nomenclature of QTLs include“q”for quantitative trait (distinguished from major gene) followed by trait code (“Cl”for cleistogamous flower,
“ShS” for shriveled seeds and “SS” for seed size) with chromosome/linkage group number and chronological order of QTL for that trait on the chromosome/ linkage group separated by a dot. The epistatic effect QTLs were determined by ICIM-EPI in BIP model of QTL IciMap-ping v4.1. with a LOD threshold value of 5 [37,41]. Conclusions
A high density genetic map was constructed using
Axiom Cajanus SNP Array. Based on genetic map and
phenotypic data, one consistent QTL for pre-anthesis cleistogamy was identified on CcLG03. This QTLs can be deployed in GAB for development of pigeonpea geno-types with cleistogamous flowers and acceptable seed size and shape.
Additional files
Additional file 1:Table S1.Chi-square distribution for cleistogamous flower and shriveled seed traits in RILs. (XLSX 10 kb)
Additional file 2:Table S2.SNP ID, map position, genotyping data and Pvalue for 6 .8K SNPs used to construct genetic map in RILs developed from ICPL 99010 × ICP 5529 (XLSX 1988 kb)
Additional file 3:Table S3.List of genes and their functions in the 42 kb region of the consistent QTL“qCl3.2”for cleistogamous flower. (XLSX 10 kb)
Additional file 4:Table S4.List of genes and their functions in QTL regions for shriveled seeds trait. (XLSX 16 kb)
Additional file 5:Table S5.Epistatic QTLs among two years’data for cleistogamous flower and shriveled seed in pigeonpea. (XLSX 15 kb)
Abbreviations
CcLG:Cajanus cajanlinkage group; CI: Confidence interval; CIM: Composite interval mapping; cM: centimorgan; DNA: Deoxyribonucleic acid; GAB: Genomics-assisted breeding; ICIM: Inclusive composite interval mapping; LOD: Logarithm of the odds; PVE: Phenotypic variance explained; QTL: Quantitative trait loci; RIL: Recombinant inbred line; SARF: Sum of adjacent recombination frequencies; SNP: Single nucleotide polymorphism; SSR: Simple sequence repeat
Acknowledgements
This work has been undertaken as part of the CGIAR Research Program on Grain Legumes and Dryland Cereals (GLDC). ICRISAT is a member of CGIAR Consortium. Authors would also like to thank Mr. Suryanarayana, Mr. Sudhakar and Mr. Johiruddin for the technical help. Further sincere thanks to Dr. Lekha Pazhamala for useful discussions.
Funding
Authors are thankful to the Department of Agriculture Cooperation & Farmers Welfare, Ministry of Agriculture & Farmers Welfare, Government of India; United States Agency for International Development (USAID); Department of Biotechnology, Government of India; Ministry of Agriculture, Government of Karnataka and CGIAR Research Program on Grain Legumes and Dryland Cereals (GLDC) for funding.
Availability of data and materials
All the data generated or analyzed during this study have been included in the present article as Additional files1,2,3,4and5.
Authors’contributions
RKS and KBS conceived the study. RKS, RKV, CVSK, KBS, VSK designed the experiment and analysis. PY conducted the experiments and performed the data analyses with RKS. KBS, AH and CVSK contributed the mapping population for this study. PY, RKS, KBS and RKV wrote the manuscript. All authors read and approved the final manuscript.
Ethics approval and consent to participate
Not applicable.
Consent for publication
Not applicable.
Competing interests
The authors declare that they have no competing interests.
Publisher’s Note
Springer Nature remains neutral with regard to jurisdictional claims in published maps and institutional affiliations.
Author details
1International Crops Research Institute for the Semi-Arid Tropics (ICRISAT),
Patancheru 502 324, India.2Department of Genetics and Plant Breeding,
Rajmata Vijayaraje Scindia Krishi Vishwa Vidyalaya (RVSKVV), Gwalior 474 002, India.
Received: 22 November 2018 Accepted: 11 March 2019
References
1. Joshi PK, Rao PP. Global pulses scenario: status and outlook. Ann N Y Acad Sci. 2017;1392:6–17.
2. FAOSTAT (2018) FAOSTAT Database. Available online at:http://www.fao.org/ faostat/en/#data/QC.
3. Saxena KB, Tikle AN, Kumar RV, Choudhary AK, Bahadur B. Nectarivore-aided hybridization and its exploitation for productivity enhancement in pigeonpea. Int J Sci Res Pub. 2016;06:321–31.
4. Saxena KB, Kumar RV, Srivastava N, Shiying B. A cytoplasmic-nuclear male-sterility system derived from a cross betweenCajanus cajanifoliusand Cajanus cajan. Euphytica. 2005;145:289–94.
5. Gupta SC, Reddy LJ, Sharma D, Green JM, Murthy AN, Saxena KB. Maintenance of pigeonpea cultivars. Proc Intl Workshop Pigeonpeas 15–19 Dec, 1980. ICRISAT 1981;1:295–302.
6. Njung'e V, Deshpande S, Siambi M, Jones R, Silim S, Villiers SD. SSR genetic diversity assessment of popular pigeonpea varieties in Malawi reveals unique fingerprints. Electron J Biotechnol. 2016;21:65–71.
7. Saxena KB, Ariyanayagam RP, Reddy LJ. Genetics of a high-selfing trait in pigeonpea. Euphytica. 1992;59:125–7.
8. Saxena KB, Jayasekera SJBA, Ariyaratne HP, Ariyanayagam RP, Fonseka HHD. Frequency of natural out-crossing in partially cleistogamous pigeonpea lines in diverse environments. Crop Sci. 1994;34:660–2.
9. Saxena RK, Prathima C, Saxena KB, Hoisington DA, Singh NK, Varshney RK. Novel SSR markers for polymorphism detection in pigeonpea (Cajanusspp.). Plant Breed. 2010;129:142–8.
10. Bohra A, Dubey A, Saxena RK, Penmetsa RV, Poornima KN, Kumar N, Farmer AD, Srivani G, Upadhyaya HD, Gothalwal R, et al. Analysis of BAC-end sequences (BESs) and development of BES-SSR markers for genetic mapping and hybrid purity assessment in pigeonpea (Cajanusspp.). BMC Plant Biol. 2011;11:56.
11. Bohra A, Jha R, Pandey G, Patil PG, Saxena RK, Singh IP, Singh D, Mishra RK, Mishra A, Singh F, et al. New hypervariable SSR markers for diversity analysis, hybrid purity testing and trait mapping in pigeonpea (Cajanus cajan(L.) Millspaugh). Front Plant Sci. 2017;8:377.
12. Dutta S, Kumawat G, Singh BP, Gupta DK, Singh S, Dogra V, Gaikwad K, Sharma TR, Raje RS, Bandhopadhya TK, et al. Development of genic-SSR markers by deep transcriptome sequencing in pigeonpea [Cajanus cajan(L.) Millspaugh]. BMC Plant Biol. 2011;11:17.
13. Saxena RK, Penmetsa RV, Upadhyaya HD, Kumar A, Carrasquilla-Garcia N, Schlueter JA, Farmer A, Whaley AM, Sarma BK, May GD, et al. Large-scale development of cost-effective SNP marker assays for genetic mapping in pigeonpea and comparative mapping in legumes. DNA Res. 2012;19:449–61. 14. Saxena RK, Von Wettberg E, Upadhyaya HD, Sanchez V, Songok S, Saxena
KB, Kimurto P, Varshney RK. Genetic diversity and demographic history of Cajanusspp. illustrated from genome-wide SNPs. PLoS One. 2014;9:e88568. 15. Roorkiwal M, Sawargaonkar SL, Chitikineni A, Thudi M, Saxena RK, Upadhyaya
HD, Vales MI, Riera-Lizarazu O, Varshney RK, et al. Single nucleotide polymorphism genotyping for breeding and genetics applications in chickpea and pigeonpea using the BeadXpress platform. Plant Genom. 2013;6:1–10. 16. Gnanesh BN, Bohra A, Sharma M, Byregowda M, Pande S, Wesley V, Saxena
RK, Saxena KB, Kavi Kishor PB, Varshney RK. Genetic mapping and quantitative trait locus analysis of resistance to sterility mosaic disease in pigeonpea [Cajanus cajan(L.) Millsp.]. Field Crop Res. 2011;123:53–61. 17. Bohra A, Saxena RK, Gnanesh BN, Saxena KB, Byregowda M, Rathore A, Kavi
Kishor PB, Cook DR, Varshney RK. An intra-specific consensus genetic map of pigeonpea (Cajanus cajan(L) Millsp) derived from six mapping populations. Theor Appl Genet. 2012;125:1325–38.
18. Dubey A, Farmer A, Schlueter J, Cannon SB, Abernathy B, Tuteja R, Woodward J, Shah T, Mulasmanovic B, Kudapa H, et al. Defining the transcriptome assembly and its use for genome dynamics and transcriptome profiling studies in pigeonpea (Cajanus cajanL.). DNA Res. 2011;18:153–64.
19. Kudapa H, Bharti AK, Cannon SB, Farmer AD, Mulaosmanovic B, Kramer R, Bohra A, Weeks NT, Crow JA, Tuteja R, et al. A comprehensive transcriptome assembly of pigeonpea (Cajanaus cajanL.) using sanger and second-generation sequencing platforms. Mol Plant. 2012;5:1020–8. 20. Pazhamala LT, Purohit S, Saxena RK, Garg V, Krishnamurthy L, Verdier J,
Varshney RK. Gene expression atlas of pigeonpea and its application to gain insights into genes associated with pollen fertility implicated in seed formation. J Exp Bot. 2017;68:2037–54.
21. Varshney RK, Chen W, Li Y, Bharti AK, Saxena RK, Schlueter JA, Donoghue MTA, Azam S, Fan G, Whaley AM, et al. Draft genome sequence of pigeonpea [Cajanus cajan(L.) Millsp.] an orphan legume crop of resource poor farmers. Nat Biotechnol. 2012;30:83–9.
22. Kumar V, Khan AW, Saxena RK, Garg V, Varshney RK. First-generation HapMap inCajanusspp. reveals untapped variations in parental lines of mapping populations. Plant Biotechnol J. 2016;14:1673–81.
23. Varshney RK, Saxena RK, Upadhyaya HD, Khan AW, Yu Y, Kim C, Rathore A, Kim D, Kim J, An S, et al. Whole-genome resequencing of 292 pigeonpea accessions identifies genomic regions associated with domestication and agronomic traits. Nat Genet. 2017;49:1082–8.
24. Singh VK, Khan AW, Saxena RK, Kumar V, Kale SM, Sinha P, Chitikineni A, Pazhamala LT, Garg V, Sharma M, et al. Next-generation sequencing for identification of candidate genes for Fusarium wilt and sterility mosaic disease in pigeonpea (Cajanus cajan). Plant Biotechnol J. 2016;14:1183–94. 25. Saxena RK, Singh VK, Kale SM, Tathineni R, Parupalli S, Kumar V, Garg V, Das
RR, Sharma M, Yamini KN, et al. Construction of genotyping by sequencing based high-density genetic maps and QTL mapping for fusarium wilt resistance in pigeonpea. Sci Rep. 2017;7:1911.
26. Saxena RK, Kale SM, Kumar V, Parupali S, Joshi S, Singh V, Garg V, Das RR, Sharma M, Yamini KN, et al. Genotyping-by-sequencing of three mapping populations for identification of candidate genomic regions for resistance to sterility mosaic disease in pigeonpea. Sci Rep. 2017;7:1813.
27. Saxena RK, Obala J, Sinjushin A, Sameer Kumar CV, Saxena KB, Varshney RK. Characterization and mapping of Dt1 locus which co-segregates with CcTFL1 for growth habit in pigeonpea. Theor Appl Genet. 2017;130:1773–84. 28. Saxena RK, Rathore A, Bohra A, Yadav P, Das RR, Khan AW, Singh VK,
Chitikineni A, Singh IP, Sameer Kumar CV, et al. Development and application of high density axiomCajanusSNP Array with 56K SNPs to understand the genome architecture of released cultivars and founder genotypes for redefining future pigeonpea breeding programs. Plant genom. 2018;1:1–10.
29. Saxena KB, Singh L, Ariyanagam RP. Role of partial cleistogamy in maintaining genetic purity of pigeonpea. Euphytica. 1993;66:225–9. 30. Chhabra AK, Sethi SK. Inheritance of cleistogamic flowering in durum wheat
(Triticum durum). Euphytica. 1991;55:147–50.
31. Nagao S, Takahashi M. Trial construction of twelve linkage groups in Japanese rice. J Fac Agric. 1963;53:72–130.
32. Takahashi R, Kurosaki H, Yumoto S, Han OK, Abe J. Genetic linkage analysis of cleistogamy in soybean. J Hered. 2001;92:89–92.
33. Turuspekov Y, Mano Y, Honda I, Kawada N, Watanabe Y, Komatsuda T. Identification and mapping of cleistogamy genes in barley. Theor Appl Genet. 2004;109:480–7.
34. Kumawat G, Raje RS, Bhutani S, Pal JK, Mithra AS, Gaikwad K, Sharma TR, Singh NK. Molecular mapping of QTLs for plant type and earliness traits in pigeonpea (Cajanus cajanL. Millsp.). BMC Genet. 2012;13:84.
35. Arora S, Mahato AK, Singh S, Mandal P, Bhutani S, Dutta S, Kumawat G, Singh BP, Chaudhary AK, Yadav R, et al. A high-density intraspecific SNP linkage map of pigeonpea (Cajanas cajanL. Millsp.). PLoS One. 2017;12:e0179747. 36. Obala J, Saxena RK, Singh V, Sameer Kumar CV, Saxena KB, Tongoona P,
Sibiya J, Varshney RK. Development of sequence-based markers for seed protein content in pigeonpea. Mol Gen Genomics. 2018.https://doi.org/10. 1007/s00438-018-1484-8.
37. Li H, Ribaut JM, Li Z, Wang J. Inclusive composite interval mapping (ICIM) for digenic epistasis of quantitative traits in biparental populations. Theor Appl Genet. 2008;116:243–60.
38. Wang J, Li H, Zhang L, Meng L. Users’manual of QTL IciMapping. 2014.
http://www.isbreeding.net/software/?type=detail&id=18.
39. Meng L, Li H, Zhang L, Wang J. QTL IciMapping: integrated software for genetic linkage map construction and quantitative trait locus mapping in biparental populations. Crop J. 2015;3:269–83.
40. Kosambi DD. The estimation of map distances from recombination values. Ann Eugenics. 1944;12:172–5.
41. Wang Z, Cheng J, Chen Z, Huang J, Bao Y, Wang J, Zhang H. Identification of QTLs with main, epistatic and QTL 9 environment interaction effects for salt tolerance in rice seedlings under different salinity conditions. Theor Appl Genet. 2012;125:807–15.