Mining Product Data Models: A Case Study
Cristina-Claudia DOLEAN
Business Information Systems Department, Faculty of Economics and Business Administration.
Babeş-Bolyai University, Cluj-Napoca, Romania [email protected]
This paper presents two case studies used to prove the validity of some data-flow mining algorithms. We proposed the data-flow mining algorithms because most part of mining algorithms focuses on the control-flow perspective. First case study uses event logs generated by an ERP system (Navision) after we set several trackers on the data elements needed in the process analyzed; while the second case study uses the event logs generated by YAWL system. We offered a general solution of data-flow model extraction from different data sources. In order to apply the data-flow mining algorithms the event logs must comply a certain format (using InputOutput extension). But to respect this format, a set of conversion tools is needed. We depicted the conversion tools used and how we got the data-flow models. Moreover, the data-flow model is compared to the control-flow model.
Keywords: Product Data Model, Process Mining, Data-Flow
Introduction
Processes are all over the world. Even the steps of buying a car may be viewed as a process. Most organizations use information systems (e.g.: Workflow Management Systems (WfMS), Customer Relationship Management systems (CRM), Enterprise Resource Planning (ERP)) to support their businesses. If an information system has the ability to record the actions performed by users within it we speak about Process-aware information systems (PAISs [1]). The actions performed by users recorded by information systems are called (event) logs. An event log consists of several events. An event stores information about the name of the event, the resource performing the action, the timestamp when the action has been started / completed, or data elements recorded within the event (e.g.: the name of a new client from a hotel). Process mining domain [2] analyzes this kind of event logs. Thus, the goal of process mining is to extract information about the process from event logs. On the one hand, process mining aim is to extract process models from event logs (process discovery) and on the other hand one question pops-us: does the discovered model depict the intended behavior of the process?(conformance checking). Moreover,
comparing the intended behavior of a process with the real behavior, the future behavior may be discovered (enhancement).
Generally, the discovering algorithms focus on control-flow perspective [3,4,5] or resource perspective [6]. But what can we say about data needed in order to execute process’ activities? This paper aims to offer a dynamic data-flow perspective of a process using synthetic event logs from two different
sources: Navision
(http://www.navisioninfo.com/) and YAWL system (http://www.yawlfoundation.org/). Generally the employees from a company know the internal processes. But after the execution of a particular number of activities, the arising question is what data we need in order to continue our process. Moreover, being in a certain state of a process (after the execution of certain number of activities), the question asked by the employees is “what data is available and can/must be used in the future activities of the process”; or “what data do we still need in order to execute a particular activity”. The control-flow perspective doesn’t have the ability to provide these answers. Being in a certain state of a process’ execution, it may only show the activities which can/must be
executed, but it cannot ensure the execution of the activities.
Second section presents some modeling methods and techniques which provide the data perspective of an information system or a process. We briefly presented the shortcomings of each of them, starting with basic data modeling techniques like ERDs until mining techniques using event logs. Third section introduces our approach in order to depict the data-flow perspective of a process. The case studies are depicted in the fourth section of this paper. For each case study we analyzed the way of data collection, then the data source, after that we presented the conversion tools used in order to get the desired event log format and finally we presented the resulted data-models.
2 Related Work
The 1970s and 1980s were flooded by data-driven approaches, while at the beginning of 1990s process driven approaches appeared [2]. The last trend is kept nowadays: the most part of information systems are process-centric.
Basic types of data modeling like Entity Relationship Diagrams (ERDs)[7] underlie the design of relational databases by offering a static data model. Each entity is defined by attributes related to it, while an activity from a process needs data related to different entities. Thus, an ERD cannot depict the data movement through a process.
Another basic approach used in modeling using activities is depicted using UML Activity Diagram. This approach focuses on the activities, not on data; thus it may describe the control-flow perspective of a process. Furthermore, control-flow perspective may be depicted using Petri Nets [8]. The most part of mining algorithms [3,4,5] are based on this and are implemented in ProM Framework [9]. But, both UML Activity Diagram and Petri Nets focus on the order of activities without offering insights about data movements. A Data Flow Diagram (DFD) depicts the activities which are directly related to the data processing. Thus the activities that do not involve any
data modification are not depicted in a DFD. Moreover, it also involves the actors (resources), from whom to whom data is transferred; so it does not offer a pure data-flow model.
In [10] is depicted an approach which bring DFD more closer to workflows using web services and metadata: the Data Centric Workflow. This model focuses on data types and data-flow without emphasizes the characteristics of each service separately. The main drawback of this approach is that it does not provide a visualization of the resulted model.
An approach combining the control-flow with data flow is described in [11]. First the UML Activity Diagram is built, then the Data-Flow matrix is generated. The last one uses all data objects (elements) from the process and splits them into two categories: input (data element is read) or output (data element is written or over written). Then, the Process Data Diagram is constructed based on the UML Activity Diagram and Data-Flow matrix. This approach does not offer a pure data-flow model of the process.
There are also approaches which starting from a data model constructs the control-flow perspective of the model [12]. Here we refer to Data-Flow Skeleton Filled with Activities (DFSFA) approach. Basically, the workflow process is derived from the data-flow skeleton and then is filled with activities. First, a data-flow dependency tree is generated based on the data dependency, then the data-flow skeleton is built and then it is filled with activities. This approach a-priori input and output data elements are known. Thus, none automatically extraction of data elements is proposed.
Metagraphs [13] want to integrate the three dimensions of workflows in a single model. The visualization provided using metagraphs combines data elements and the tasks of workflows. Therefore it does not present a pure data-centric approach, but the real shortcoming appears when we are dealing with complex metagraph: they are difficult to be read, respectively to be analyzed.
The shortcoming of the approaches reminded above is that none of them use an event log as starting point in order to analyze the data perspective. The Product Data Model (PDM) as it was defined in [14] maps to our approach. An approach that uses PDMs is depicted in [15]: automatic data processing steps are grouped into activities. The XSD file to be imported in ProM. The drawback of this approach is that it considers the PDM XML file already created and based on it the aggregation is build. Our goal is to automatically create the PDM (first the XML file in XES format, then its visualization). 3 Theoretical Approach
3.1 General Approach
Each PAIS has its own data structure. For that, the event logs produced by different PAIS have different formats. The first standard format proposed for event logs was MXML (Mining Extensible Markup Language [9,16, 17]). Then, XES format standard was introduced [18]. We used XES format for the event logs analyzed.
As we argued earlier the current process mining algorithms focus on the control-flow
perspective. Therefore from a control-flow perspective of a process we can only see the order of the activities, but what data do we need in order to execute a particular activity? This kind of information is “hidden” in the control-flow perspective. But a data-flow perspective may emphasize the data needed for each activity. The data produced is also depicted by the data-flow model as well (see Fig. 1). If we look at the control-flow process model after the execution of activity A1, we can only figure out that either activity A2 or activity A3 may be executed, but what data do we need in order to execute these activities?
On the other side a data-flow model depicts the data needed for every activity in order to be executed (e.g. for the execution of activity
A1 data elements a and b are needed and data element c is produced; while in order to complete activity A2 data elements c and d
are consumed and data element f results). Moreover, having data elements c,d or e
available we can figure out what activities can be executed (A2 or A3).
Fig. 1. Control-Flow perspective versus Data-Flow perspective 3.2 InputOutput Extension
In order to generate the data-flow perspective of a process, the event logs must comply XES format. Besides the existing extension already defined (concept extension, lifecycle extension, organizational extension, time extension and semantic extension [18]), the event logs must use InputOutput extension.
The input/output extension defines nested elements in order to associate input, respectively output data elements to each event. Therefore, each event will have input and output data elements. Moreover, for each input/output data element the names, respectively the values are stored.
Event Log Control-Flow perspective Data-Flow perspective A1 A2 A3 A4 g c h f d e A3 A2 A4 a b A1
Table 1. InputOutput XES definition
Name InputOutput
Prefix io
Extension URI http://granturi.ubbcluj.ro/decision_mining/xes/InputOutput.xese xt
XML
representation
extension name="InputOutput" prefix="io"
uri="http://granturi.ubbcluj.ro/decision_mining/xes/InputOutput .xesext"/
This extension defines input and output attributes at event level. The attributes for input and output data elements are defined at meta level. Each input attribute has a name and a value. Output attribute is treated in a similar way.
Considering the fact that an event may contain more than one input or output data element we choose to delimitate the data elements by hashtags („#”).
In order to comply with InputOutput extension some conversion tools have been developed. Next we will briefly depict these conversion tools.
3.3 Data-flow Event Log Format Convertor
This approach is not fully automated because it needs additional information about the process retrieved in the event logs. Here we speak about business specialists which know the process or documents which depicts it (e.g. internal procedures).
First step is to determine the process to be analyzed. In this phase, business specialists (e.g. business analysts, managers, head of departments, etc) derive process steps based on internal procedures and based on their experience. Initialize InputNames Initialiaze InputValues Initialize OutputNames Initialiaze OutputValues Set caseIDValue
Search for clusters If Found ()
CN = cluster name CV = cluster value Add caseID to InputNames Add caseIDValue to InputValues For each data from cluster Extract data elements (name, value) Add name to InputNames Add value to InputValues
EndFor each OutputNames = CN OutputValues = CV EndIf
EndSearch
Once we have the event log generated by the system we can apply the Data-flow Event Log Format algorithm (the pseudo-code is described above). First we have to define the clusters for our process. These are extracted from the process activities (e.g. for Order to Cash process we can have the following clusters: create order, generate invoice and cash invoice). Basically each activity represents a cluster. Once we have the clusters created, we analyze each of them. For each cluster all data is collected (including their names and values). Hence, these are the input data elements according to InputOutput extension. As for the output data element we create an artificial data element which takes as name the initials of the belonging cluster. It also will keep the related value. Therefore we will get the data elements needed for InputOutput extension; so the data-flow mining algorithms can be used in order to provide the visualization of data movements within the process.
3.4 Convert to I/O Log Tool
In order to apply the data-flow mining algorithms to en event log consisting of start and complete events an intermediary filter step is compulsory because start and complete events do not respect the Data-Flow Event Log Format (using InputOutput extension). That is the reason why we propose an algorithm which makes this conversion. The pseudo-code is depicted below.
Read Event Log Foreach trace
get concept:name attribute value //name of the trace Foreach event
get concept:name attribute value //name of the event Foreach attribute from event
Search for start event //lifecycle:transition = „start”
If start event found
Search for attributes different than the defined extensions create new event with input elements
Endif
Search for corresponding complete event if complete event found
Search for attributes different than the defined extensions add output elements
Endif End foreach
End foreach End foreach
The conversion plug-in is integrated in the ProM Framework („Convert to I/O log”
plug-in). It takes an event log having start and complete events (in XES format) as input and it returns the corresponding event log in Data-Flow Event Log Format (with input and output data elements for each event).
For a better understanding of the corresponding algorithm of Convert to I/O
log plug-in, an example is depicted below. The name of the operation corresponds to the event’s name (e.g. the name of the operation from the example below is A1) and the data elements will be extracted depending on event’s type. The event logs using XES format store the event type on
lifecycle:transition attribute.
Fig. 2. Convert to I/O example Event logs with start and complete events
make the separation of data elements easier. Furthermore artificial data elements are no more needed (like in the previous conversion approach - DFC).
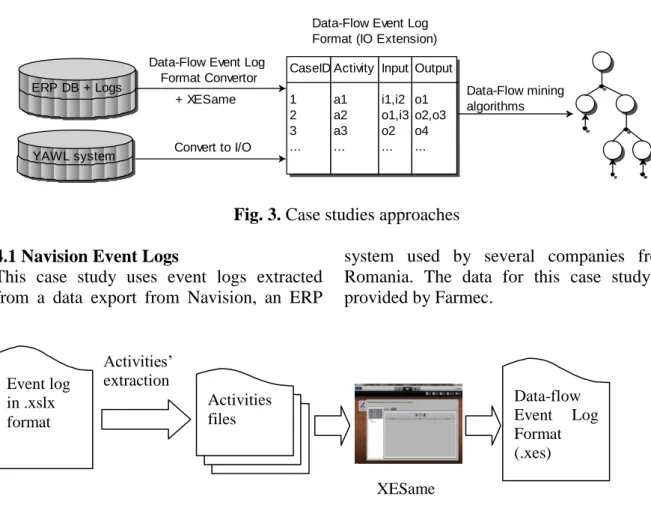
4 Case Studies
In order to test the developed algorithms two case studies have been performed: using Navision event logs, respectively using the event logs generated by YAWL system. For each case study different conversion tools were used because Navision and YAWL
system provide logs in their own way (see Fig. ). The first case study uses Data-Flow Event Log Format Convertor and XESame converter in order to provide the event logs because the data source is given by Excel (.xlsx) files while for the second case-study we implemented a new conversion tool for event logs using start and complete events. These conversion tools offer the event logs in the desired format (IO format). Therefore we can apply the Data-Flow mining algorithms. For each case study we presented the visualizations provided by some plug-ins concept:name:A1 lifecycle:transition=start a=valueA b=valueB concept:name=A1 lifecycle:transition=complete c=valueC Operation: A1 InputNames:a, b
InputValues: valueA, valueB OutputNames: c
which emphasize the control-flow perspective of a process (e.g. Alpha Miner, Fuzzy Miner). Then we applied Data-Flow
mining algorithms and we presented the advantages provided by the data-flow perspective.
Fig. 3. Case studies approaches 4.1 Navision Event Logs
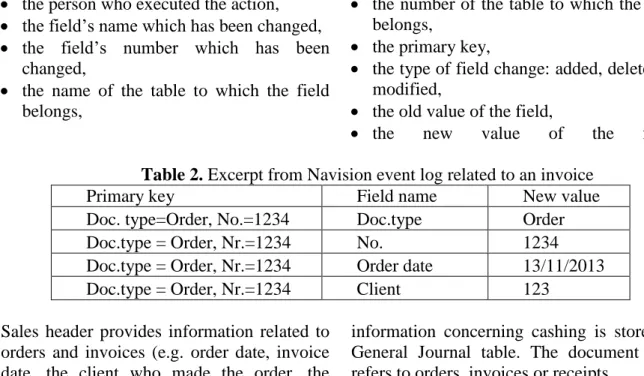
This case study uses event logs extracted from a data export from Navision, an ERP
system used by several companies from Romania. The data for this case study is provided by Farmec.
Fig. 4. General approach 4.1.1. Data Collection
ERP systems do not have all the properties of PAISs. They do not record all the actions performed by users within the ERP system. Therefore we have to set trackers on the tables which are providing the necessary data related to the analyzed process. We choose to evaluate Order to Cash process. Hence, we set trackers to all data elements related to Orders, Invoices and Payments. These are recorder in Sales and General Journal tables. The system will generate event logs based on the data needed. Data collection is a time consuming phase; so, after we set the trackers we have to wait in order to get the event logs. We analyzed the data elements used between 13th of November and 15th of November 2013.
Sales header provides information related to orders and invoices (e.g. order date, invoice
date, the client who made the order, the receipt date, the document type), while the information concerning cashing is stored in General Journal table.
4.1.1 Data Source
The event logs provided by Farmec are stored into two Excel worksheets. The first worksheet shows the actions performed by each user and the second one provides the link between some data depicted in the first worksheet (e.g. the corresponding invoice to each order). Basically the first worksheet represents the event log and the second worksheet provides some additional information. For each action performed the following information is provided:
the time when an action has been performed,
ERP DB + Logs YAWL system
Data-Flow mining algorithms Data-Flow Event Log
Format Convertor
Data-Flow Event Log Format (IO Extension) CaseID 1 2 3 ... Activity a1 a2 a3 ... Input i1,i2 o1,i3 o2 ... Output o1 o2,o3 o4 ... Convert to I/O + XESame Event log in .xslx format Activities files XESame 1.3 Activities’ extraction Data-flow Event Log Format (.xes)
the person who executed the action, the field’s name which has been changed, the field’s number which has been
changed,
the name of the table to which the field belongs,
the number of the table to which the field belongs,
the primary key,
the type of field change: added, deleted or modified,
the old value of the field,
the new value of the field. Table 2. Excerpt from Navision event log related to an invoice
Primary key Field name New value
Doc. type=Order, No.=1234 Doc.type Order
Doc.type = Order, Nr.=1234 No. 1234
Doc.type = Order, Nr.=1234 Order date 13/11/2013 Doc.type = Order, Nr.=1234 Client 123
Sales header provides information related to orders and invoices (e.g. order date, invoice date, the client who made the order, the receipt date, the document type), while the
information concerning cashing is stored in General Journal table. The document type refers to orders, invoices or receipts.
Table 3. Navision tables and records Table Number of records Sales header 7603
General Journal 9294
Total 16897
4.1.3 Conversion
The conversion to Data-flow Event Log Format was possible using XESame 1.3. We used the order number as case instance. Each trace may contain information related to the order (e.g. the date when the order was initiated, the client who asked the order, the date when the corresponding invoice and/or receipt were made etc.). In the event log, the information related to an order is depicted on different rows (see Table 1). The information about invoices is described in a similar way. First step is to group each record by order number. Hence, all information about orders will be retrieved in one CSV file (ordersNew.csv). We will proceed in a similar manner for invoices’ details and we will get the second CSV file (invoicesNew.csv). At this we made a selection of orders, by filtering only those orders for which the invoice was issued. Moreover, in order to link the orders to
invoices we added an artificial data element: the case number (order number - ON). The information about cashing is stored in cashingNew.csv. If for orders and invoices a single filter was enough in order to get the desired information, for cashing details we applied several filters because the information about cashing was not available by selecting the document type. Therefore, cashing information does not belong to Sales header table. Generally the information related to cashing is taken from Cash Receipts Journal (JR.INC. attribute in our event log).
Beside the event log from Navision we also used a file which stores the link between Order Number and the correspondent invoice. The link between invoices and cashing is made based on the information from the event log (records about cashing contain information about the number of the corresponding invoice).
So far we have all the information we need in order to get the data-flow visualization. We have only to map this information into a Data-flow Event Log format. XESame allows to add child attributes. We need these kinds of attributes in order to respect the Data-flow Event Log format (each input/output data element needs two child attributes: name and value).
Basically each CVS file depicts an activity from the event log. Therefore there are three CSV files – related to orders, invoices, respectively cashing. Next we will depict the mappings done according to our CSV files:
The case id is stored in CaseNo (concept:name at trace level),
The person who executed the activity can be found in Resource field (org:resource),
The time when an activity was performed is stored in Timestamp field (time:timestamp),
The EventID represents the name of the activity (concept:name at event level), InputNames stores the names of data
elements needed in order to execute a particular activity,
InputNewValues refers to the values of data elements that an activity needs in order to be executed,
OutputNames stores the names of data elements produced after the execution of a particular activity,
OutputNewValues contains the values of data elements resulted behind an activity’s execution
For each event lifecycle transition attribute is set to „complete“.
As we mentioned before, a trace instance is represented by the order number. Due to the
fact that we analyze a short period of time (from 13th of November until 15th of November) there are orders whose invoices were not issued and there are uncollected invoices as well. This leads to the incompleteness of our event logs. So, we added an artificial “end event”.
The next step after we set up the mapping is to execute the conversion. The result is an event log in XES format according to the requirements of Data-flow Event Log Format (with input and output data elements).
4.1.4 Data analysis
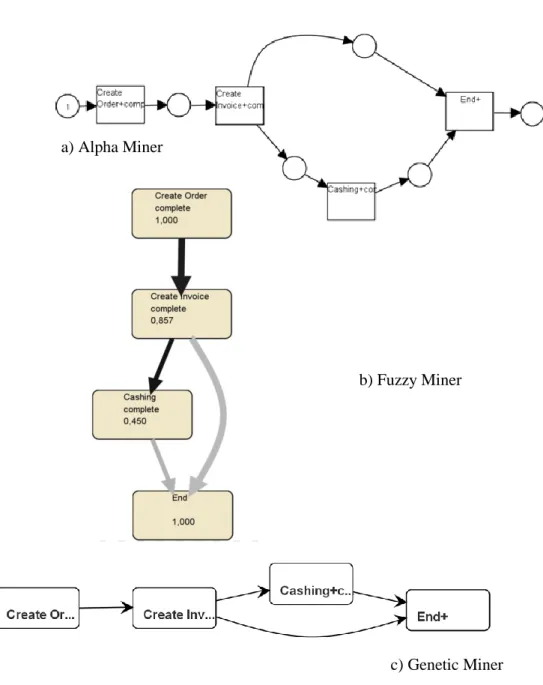
The resulted event log was importer into ProM Framework and a series of analysis were made. The event log has 251 cases and 523 events. The maximum number of events per trace is three (Create Order, Create Invoice and Cashing) and there are 26 persons which executed the activities from Order to Cash process.
First we applied some algorithms that focus on the control-flow perspective. This type of algorithms emphasizes the order of activities. Each of them shows the activities presented in the process: Create Order, Create Invoice and Cashing. Alpha Miner shows that all orders have a corresponding invoice, but not all invoices are collected. Hence, we have an XOR split operator after Create Invoice activity. These models do not show which data is consumed or produced by a particular activity even if this data is stored at activity level.
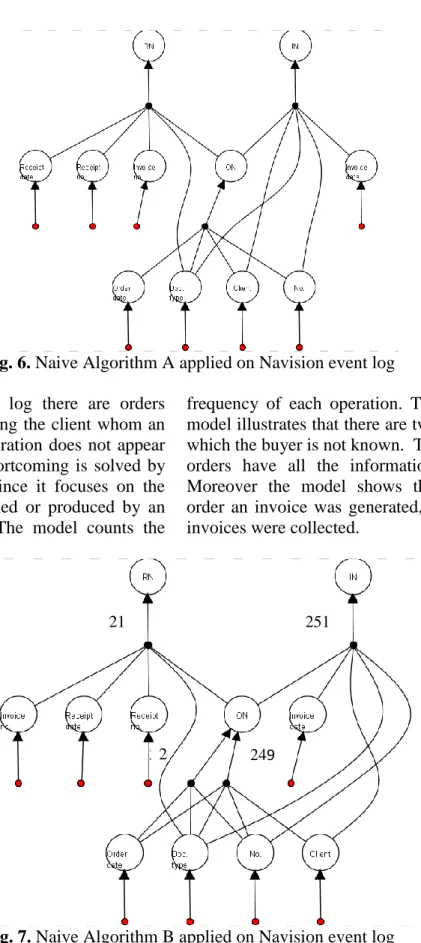
Then we applied the first two naive algorithms proposed to emphasize the data-flow perspective in form of PDM. Fig. and Fig. show the visualization of the process from data movement point of view.
Fig. 5. Control-flow perspective of Order to Cash process using different algorithms Naive algorithm A focuses on the operations
(activities), while Naive Algorithm B concentrates on the input and output data elements of operations. As a result, first algorithm identifies the operations uniquely based on their names (e.g. Create Order)
regardless the input or output data elements are. The input data elements needed for Create Order activity are: Order date, Document type, Number and Client and the output data element is the artificial element ON (order number).
b) Fuzzy Miner
c) Genetic Miner a) Alpha Miner
Fig. 6. Naive Algorithm A applied on Navision event log Even if in the event log there are orders
which are not specifying the client whom an order belongs this operation does not appear in the model. This shortcoming is solved by Naive Algorithm B since it focuses on the data elements consumed or produced by an activity (see Fig. ). The model counts the
frequency of each operation. Therefore, the model illustrates that there are two orders for which the buyer is not known. Therefore 251 orders have all the information available. Moreover the model shows that for each order an invoice was generated, but only 21 invoices were collected.
Fig. 7. Naive Algorithm B applied on Navision event log 4.2 YAWL event logs
Fig. shows the data source of the event logs providing the data-flow model. The second one refers to the event logs produced by YAWL system. First, these respect XES
format and second this kind of event logs consists of start and complete event logs. Nevertheless they need a conversion tools in order to apply data-flow mining algorithms on them.
21 251
249 2 2
4.2.1 Data collection
The event logs are generated after some simulations of a process (approval process for going in an international or national
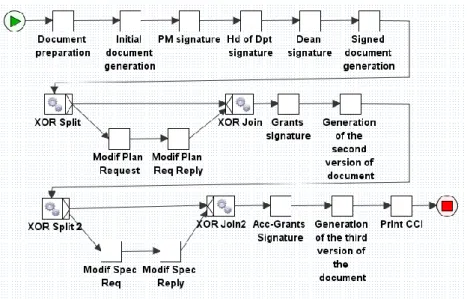
mobility) implemented in YAWL system. This process is briefly depicted in [19] (see Fig. ).
Fig. 8. Workflow of getting the approval to go in an international or national mobility For a better understanding we will use two
traces generated after the workflow execution. On the first execution of the workflow specification all the conditions are
accomplished by the users (see the red tasks from Error! Reference source not found.9).
Fig. 2. Control-flow for approval to go in an international or national mobility process On the other hand, on the second execution
(see the green tasks from Fig. 2Error! Reference source not found.), the mobility is not preview in the Plan. Therefore, a modification of the Plan is necessary and then it must be approved. The rest of the
workflow has the same execution like the first one.
4.2.2 Data source
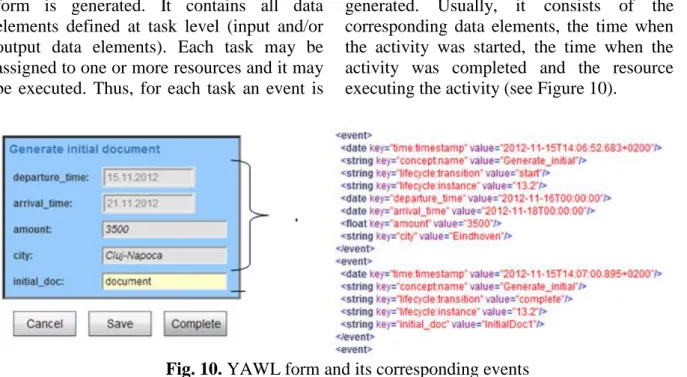
YAWL system allows the simulation of the process depicted in the specifications. Thus, for each task defined in the specification a
form is generated. It contains all data elements defined at task level (input and/or output data elements). Each task may be assigned to one or more resources and it may be executed. Thus, for each task an event is
generated. Usually, it consists of the corresponding data elements, the time when the activity was started, the time when the activity was completed and the resource executing the activity (see Figure 10).
Fig. 10. YAWL form and its corresponding events 4.2.3 Conversion
One characteristic of YAWL event logs is that they consist of start and complete events. Regularly the existing plug-ins implemented in ProM Framework use as input complete event log. Having the start component of an event helps to the separation of the component data elements of the PDM. Thus: a) each event corresponds to an operation, b) the attributes from start events form the
set of input data elements,
c) the attributes from complete events form the set of output data elements (see Fig. Error! Reference source not found.). The grayed textboxes are input data elements (shown to the user just for informative purposes) while the enabled textbox is the output data element (for this example there is a single output). The elements shown in the GUI are stored as start and complete events in the log (also shown in Fig. 0Error! Reference source not found.). The data-flow visualization shows the input data elements (grayed textboxes in form) ‘knotted together’ in an operation that produces the output data element (the enabled textbox in the GUI).
4.2.4 Data Analysis
There are some exceptions when we refer to the first task of the workflow. The first task
of the workflow refers to the preparation of the mobility document. Being the first task, this is a particular case because it only involves input data elements in the PDM visualization (departure_time, arrival_time, city, holder and amount). In order to make the PDM executable, at implementation level an exception is thrown. If the current data element is certified as input data element, before it is added to the PDM model verification is performed: namely if the data element is produced (it is output data element in a previous operation) until the current state.
The input/output converter does not take into consideration the XOR (OR) pattern from control-flow perspective. Yet the XOR pattern may be easily identified in the PDM visualization.
5 Conclusions
In order to validate the proposed algorithm two case studies are introduced. For the first case study we used the event logs produced by an ERP (Navision), while for the second one we used the event logs generated by YAWL system. In order to transform the event logs from Navision in the desired format we used Data-Flow Event Log Format Convertor and XESame 1.3., while for the event logs generated by YAWL system, we
used Convert to I/O log convertor. The data-flow visualization of a process is possible if information about each operation presented in the event log can be extracted (name of operation, input data element(s) and output data element(s)). Considering the event logs generated by YAWL the extraction of PDM elements was possible by analyzing the start and complete events.
Both case studies show the additional information brought by the data-flow perspective because it provides more information about the process than control-flow perspective does. Moreover PDMs are able to represent XOR and AND patterns specific to control-flow perspective.
The main improvement brought by data-flow perspective refers to the fact that having some data elements available we may decide what activity can be executed further. Moreover, having a set of data elements available, the data elements needed in order to execute further activities are depicted in the data-flow model.
Acknowledgement
This work was supported by CNCSIS-UEFISCSU, project number PN II – RU - TE 52/2010 code 292/2010.
References
[1] M. Dumas, W.M.P. van der Aalst and A.H.M. ter Hofstede, „Process-Aware Information Systems: Bridging People and Software through Process Technology“, Wiley & Sons, 2005
[2] W.M.P. van der Aalst, „Process Mining: Discovery, Conformance and Enhancement of Business Processes“, Springer Verlag, 2011
[3] A.K.A. de Medeiros, B.F. van Dongen, W.M.P.van der Aalst, A.J.M.M. Weijters, „Process Mining: Extending the α-algorithm to Mine Short Loops“, BETA Working Paper Series, WP 113, Eindhoven University of Technology, Eindhoven, 2004
[4] C.W. Gűnther and W.M.P.van der Aalst, „Fuzzy Mining: Adaptive Process Simplification Based on
Multi-perspective Metrics“ , In G. Alonso, P. Dadam, and M. Rosemann, editors, International Conference on Business Process Management (BPM 2007), volume 4714 of Lecture Notes in Computer Science, Springer-Verlag, Berlin, 2007, pp. 328-343,
[5] A.K.A. de Medeiros, „Genetic Process Mining“, PhD thesis, Technische Universiteit Eindhoven, Eindhoven, The Netherlands, 2006, Weijters A.J.M.M. and van der Aalst W.M.P., „Rediscovering Workflow Models from Event-Based Data using Little Thumb“, Integrated Computer-Aided Engineering, 10(2):151-162, 2003, pp. 151-162
[6] W.M.P. van der Aalst , H.A. Reijers H. A. , and M. Song, „Discovering social networks fromevent logs“, Computer Supported CooperativeWork, 14(6):549-593, 2005, pp. 549-593
[7] P.P.-S. Chen, „The entity-relationship model toward a unified view of data“, ACM Transaction Database System 1, 1976, pp. 9-39
[8] C.A. Petri , „Kommunikation mit Automaten“, PhD thesis, Institut fur instrumentelle Mathematik, 1962
[9] B. van Dongen B., A.K. Alves de Medeiros, H.M.W. Verbeek, A.J.M.M. Weijters, and W.M.P. van der Aalst, „The ProM framework: A New Era in Process Mining Tool Support“, In G. Ciardo and P. Darondeau, editors, Application and Theory of Petri Nets 2005, volume 3536 of Lecture Notes in Computer Science, Springer-Verlag, Berlin, 2005, pp. 444-454
[10] A. Akram, J. Kewley, R. Allan, „A DataCentric approach for Workflows“, Enterprise Distributed Object ComputingConference Workshops, EDOCW '06. 10th IEEE International, 2006
[11] S.X.Sun, J.L. Zhao, J.F. Nunamaker, O.R. Liu Sheng, „Formulating the Data-flow Perspective for Business Process Management“, Information Systems Research, 17(4), 2006, pp. 374-391 [12] N. Du, Y. Liang, L. Zhao, „Data-flow
skeleton filled with activities driven workflow design“, in Won Kim & Hyung-Jin Choi, ed., 'ICUIMC' , ACM, , 2008, pp. 570-574
[13] A. Basu, R.W. Blanning, „Metagraphs and Their Applications“, Integrated Series in Information Systems, Senes, Springer, 2007
[14] I. Vanderfeesten, „Product-Based Design and Support of Workflow Processes“, Eindhoven University of Technology, Eindhoven, 2009
[15] H. van der Aa, H.A. Reijers, and I. Vanderfeesten, „Composing Workflow Activities on the Basis of Data-flow Structures“, In: Proceedings of the 11th International Conference on Business Process Management (BPM 2013), Lecture Notes in Computer Science, vol. 8094, Springer Verlag, Berlin, 2013, pp. 275-282
[16] B.F. van Dongen and W.M.P. van der
Aalst, „A meta model for process mining data“, In Proceedings of the CAiSE, 2005, vol. 5, pp. 309-320
[17] C. Gűnther and W.M.P. van der Aalst, „A Generic Import Framework for Process Event Logs“, In J. Eder and S. Dustdar, editors, Business Process Management Workshops, Workshop on Business Process Intelligence (BPI 2006), volume 4103 of Lecture Notes in Computer Science, Springer-Verlag, Berlin, 2006, pp. 81-92
[18] C.W. Gűnther,„XES Standard Definition“, Fluxicon Process Laboratories, November 2009
[19] C.C. Dolean, R. Petruşel, „Data-Flow Modeling: A Survey of Issues and Approaches“, Informatica Economica, Academy of Economic Studies - Bucharest, Romania, vol. 16(4), 2012, pp. 117-130
Cristina-Claudia DOLEAN has graduated the Faculty of Economics and Business Administration, Babeş Bolyai University, Cluj-Napoca in 2008. She holds a bachelor degree in Business Informatics and a master degree in E-Business. She is currently a PhD student in the field of Business Informatics. Her current research interest include Process mining and Workflow Management.