De-noising Analysis of Mammogram Images in the Wavelet Domain using
Hard and Soft Thresholding
Saima Anwar Lashari
Faculty of Computer Science & Information System Universiti Tun Hussein Onn Malaysia, 86400 Parit Raja,
Batu Pahat, Johor, Malaysia. * [email protected]
Rosziati Ibrahim
Faculty of Computer Science & Information System Universiti Tun Hussein Onn Malaysia, 86400 Parit Raja,
Batu Pahat, Johor, Malaysia. [email protected]
Norhalina Senan
Faculty of Computer Science & Information System
Universiti Tun Hussein Onn Malaysia, 86400 Parit Raja, Batu Pahat, Johor, Malaysia. [email protected]
Abstract—The noisy nature of digital mammograms and low contrast of suspicious areas which make medical images de-noising a challenging problem. Therefore, image de-noising is an important task in image processing, thus the use of wavelet transform provides better and improved quality of an image and reduces noise level. For medical images, many wavelets like db1, sym8, coif1, coif3 etc can be used for de-noising of a medical image. However, in this paper, haar, sym8 daubechies db3 (mallat), daubechies db4 at certain level of soft and hard threshold have been calculated. Later, peak signal to noise ratio (PSNR) values are calculated for these wavelet methods. These experiments help to select the best wavelet transform for the de-noising of particular medical images such as mammogram images.
Keywords—Wavelet de-noising, hard Thresholding, soft Thresholding, Peak Signal-to-Noise Ratio
I. INTRODUCTION
The noise present in the images may appear as additive or multiplicative components and the main purpose of denoising is to remove these noisy components while preserving the important signal as much as possible [1]. Therefore, de-noising plays a very important role in the field of the medical image pre-processing. It is often done before the image is to be analyzed. De-noising is mainly used to remove noise that is present and retains the significant information, regardless of the frequency contents of the signal. During the process of de-noising, much attention is kept on how well the edges are preserved and how much of noise granularity been removed. Thus, the main purpose of image denoising algorithm is to eliminate the unwanted noise level while preserving the important features of an image.
Unlike Fourier transform, wavelet transforms shows localization in both time and frequency and hence it has proved itself to be an efficient tool for a number of image
based methods are less useful because, they cannot work on non-stationary signals and they can capture only global features. But in real scenario, as the images are only piecewise smooth and the noise distributions are random in nature, Fourier transform cannot perform well for the stochastic noise, but wavelets can do. Hence, wavelets based noise removal has attracted much attention of the researchers for several years [3]. Thus, the objective of this paper is to see the viability of wavelet domain using hard and soft Thresholding for de-nosing mammogram images.
In the wavelet domain, the noise is uniformly spread throughout the coefficients while mostly the image information is concentrated in the few largest coefficients. The most important way of distinguishing information from noise in the wavelet domain consists of Thresholding the wavelet coefficients. Mainly hard and soft Thresholding techniques are performed [4].
The organization of this paper is as follows: a brief review of wavelet Thresholding, hard and soft threshold function are presented in Section 2, the modeling process is given in Section 3, and experimental results are shown in Section 4. Finally Section 5 presents the conclusion.
II. WAVELET THRESHOLDING DE-NOISING
Wavelet Thresholding de-noising is based on the idea that the energy of the signal to be defined concentrates on some wavelet coefficients, while the energy of noise spreads throughout all wavelet coefficients. Similarity between the basic wavelet and the signal to be defined plays a very important role, making it possible for the signal to concentrate on fewer coefficients. The components of the impulse should be made as prominent as possible so as to improve the performance of impulse isolation. Wavelet threshold de-noising is a very efficient method, the purpose
of which is to remove independent and identically distributed Gaussian noise.
Let x(t)=
{
x1( ) ( )
t,x2t...,xn( )
t}
be the signal series acquired by means of a senor. This signal series consists of impulses and noise. x(t) can be expressed as follows [5].( ) ( )
t nt p tx()= + (1)
Where p(t)=
{
p1( ) ( )
t,p2t...,pn( )
t}
indicates identically distributed and in depended Gaussian noise with mean zero and standard deviationσ . The wavelet threshold de-nosing producer has following steps:1. Transform signal x(t) to the time-scale plane by means of a wavelet transform. It is possible to acquire the results of the wavelet coefficients on different scales.
2. Assess the threshold λand in accordance with the establish rules , shrink the wavelets coefficients
3. Use the shrunken coefficients to carry out the inverse wavelet transform. The series recovers is the estimation of impulse p(t)
The second step has a great impact upon the effectiveness of the procedure. According to Donoho, the universal threshold rule should be applied in the second step. According to him, the universal threshold is defined as follows [5]. InN 2 σ λ= (2) where
σ refers to the standard deviation of the noise and if it is not known , a robust median estimator is used from the finest scale wavelet coefficients :
σ
=MAD/0.6745Where MAD refers to the median absolute value of the finest scale wavelet coefficients, whereas N refers to the number of data samples in the measured signal.
A. Haar Wavelet
Haar wavelet is one of the oldest and simplest types of wavelet. The Haar Transform provides prototype for all wavelet transforms. Like other wavelets transforms, The Haar Transform decomposes the discrete signal into sub-signals of half its length. One sub-signal is a running average or trend and other sub-signal is running difference or fluctuation. The advantage of Haar wavelet is that it is fast, memory efficient and conceptually simple The mother Wavelet function is as Haar mother wavelet [1][6]:
( )
t = ψ ە ۖ ۔ ۖ ۓ ͳ 2 1 0≤t≤ െͳ 1 2 1≤t≤ Ͳ otherwise (3)Its scaling function
ٞ ሺݐሻ
can be described asٞ
(t) ቊͳ 0≤t≤1Ͳ otherwise (4)
B. Daubechies Wavelet Db3
Daubechies wavelet is the first wavelet family which has set of scaling function which is orthogonal. This wavelet has finite vanishing moments. Daubechies wavelets have balanced frequency response but non-linear phase responses. Daubechies wavelets are useful in compression and noise removal of audio signal processing because of its property of overlapping windows and the high frequency coefficient spectrum reflect all high frequency changes [7-8] Thresholding is one of imported steps to remove noise. Thresholding function is the wavelet shrinking function which determines how the threshold is applied to wavelet coefficients. Thresholding is used to segment an image by stetting all pixels whose intensity values are above a threshold to a foreground value and all the remaining pixels to a background value. Thresholding is mainly divided into two categories: hard Thresholding and soft Thresholding..
C. Hard Thresholding
The hard-Thresholding function used by Donoho is [9-10] = k j w~ , ൞ k j w , wj,k ≥λ Ͳ wj,k <λ (5)
It is called keep or kill, keep the elements whose absolute value is greater than the threshold. Set the elements lower than the threshold to zero, where w~j,kthe signal is,
λis the threshold.
D. Soft Thresholding
The soft-Thresholding function used by Donoho is [9-10]
= k j w~ , ൞
( )
(
)
λ − k j w k j w , , sgn wj,k ≥λ Ͳ wj,k ≥λ (6)It is called shrink or kill which is an extension of hard Thresholding, first setting the elements whose absolute values are lower than the threshold to zero and then shrinking the other coefficients where sgn(∗)is symbol function:
( )
n =sgn ቊ ͳ n>0
െͳ n<0 (7)
III. MODELING PROCESS
The modeling process consists of five phases which are data collection, wavelet selection (Sym8, Haar, db3 & db4), hard & soft Threshold, calculation of PSNR and MSE and comparison of PSNR as show in Figure 1. Each of the phases is discussed in details in next sub-sections.
Fig. 1. Modeling Process
A. Data Collection
The data was collection from the Mammographic Image Analysis Society (MIAS). There are 322 images, which belong to three categories: normal, benign and
malign. Every of the mammograms are an x-ray image with a size of 1024*1024 pixels with 256 level gray scale. All the mammograms are medio-lateral oblique view. For this paper, several experiments are conducted only on benign (Mdb001) and malign (Mdb155) images.
B. Wavelet Selection
For medical images many wavelets like db1, sym8, coif3 etc. can be used for denoising of a medical images, however in this study, sym8, haar, db3 (mallat) and db4 at certain level of hard and soft Thresholding and then decomposed and reconstructed the denoised image. PSNR and MSE values are calculated for comparing these wavelets filters.
C. Calculation & Comparison of PSNR
PSNR values can be calculated by comparing two images one is original image and other is distorted image. The PSNR has been computed using the following formula;
db MSE R PSNR ¸¸ ¹ · ¨ ¨ © § =10log10 2 (8) where
R is the maximum fluctuation in the input image data. For example, if the input image has a double precision floating point data type, then R is1. If it has an 8-bit unsigned integer data type, R is 255, etc
Mean squared error .
( ) ( )
2 1 1 , , 1¦
¦
= = ¨©§ − ¸¹· = M I NJ j i y j i x MN MSE (9)where x
( )
i,j represents the original image and y( )
i,jrepresents the denoised (modified) image and I and j are pixels of M×Nimage. MSE is zero when x
( )
i,j =y( )
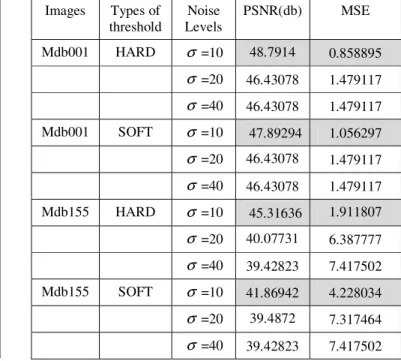
i,jIV. EXPERIMENTAL RESULTS AND DISCUSSION
In this paper, experiments are conducted on mammography images (begin (mdb001) and malignant (mdb155) images only). Different PSNR and MSE values are calculated at different levels of Gaussian noise on both medical images at hard and soft Thresholding levels by applying these wavelets filters techniques such as Haar, db3, sym8 and db4 filters one after the other and then comparison is made from the Tables below I, II, III, IV. From these observation made in theses tables it can be seen that db3 wavelet is better in terms of PSNR and MSE values than haar , db4 and sym8 for purpose of denoising in the Data Collection
Wavelet Selection (Sym8, Haar, db3 & db4)
Hard & soft Threshold
Calculation of PSNR &MSE
mammogram images. Later these experiments are help to select the best wavelet transform for the de-noising of particular medical images such as mammogram images.
TABLE I. PSNR VALUES OF MIAS AFTER PROCESSING THROUGH
SYM8 WAVELET Images Types of threshold Noise Levels PSNR(db) MSE Mdb001 HARD σ =10 46.92137 1.321123 σ =20 44.13577 2.509017 σ =40 41.88418 4.213685 Mdb001 SOFT σ =10 44.81338 2.146555 σ =20 42.83949 3.38167 σ =40 41.88418 4.213685 Mdb155 HARD σ =10 44.5391 2.286496 σ =20 43.11897 3.170906 σ =40 43.11897 3.170906 Mdb155 SOFT σ =10 43.07823 3.200793 σ =20 40.77002 5.446003 σ =40 40.77002 5.446003
TABLE II. PSNR VALUES OF MIAS AFTER PROCESSING THROUGH
DB4 WAVELET Images Types of threshold Noise Levels PSNR(db) MSE Mdb001 HARD σ =10 47.56058 1.140309 σ =20 47.56058 1.140309 σ =40 47.56058 1.140309 Mdb001 SOFT σ =10 47.56058 1.140309 σ =20 47.56058 1.140309 σ =40 47.56058 1.140309 Mdb155 HARD σ =10 44.20299 2.470482 σ =20 40.83046 5.370742 σ =40 39.36035 7.534335 Mdb155 SOFT σ =10 41.85874 4.238441 σ =20 39.82153 6.775285 σ =40 39.36035 7.534335
TABLE III. PSNR VALUES OF MIAS AFTER PROCESSING THROUGH
HAAR WAVELET Images Types of threshold Noise Levels PSNR(db) MSE Mdb001 HARD σ =10 48.30335 0.961049 σ =20 44.12837 2.513294 σ =40 38.57406 9.029718 Mdb001 SOFT σ =10 44.3201 2.404753 σ =20 40.77241 5.443008 σ =40 38.57406 9.029718 Mdb155 HARD σ =10 44.30429 2.413522 σ =20 42.80994 3.404756 σ =40 38.59682 8.982514 Mdb155 SOFT σ =10 42.48787 3.666848 σ =20 40.1137 6.334471 σ =40 38.53589 9.109433
TABLE IV. PSNR VALUES OF MIAS AFTER PROCESSING THROUGH
DB3 WAVELET Images Types of threshold Noise Levels PSNR(db) MSE Mdb001 HARD σ =10 48.7914 0.858895 σ =20 46.43078 1.479117 σ =40 46.43078 1.479117 Mdb001 SOFT σ =10 47.89294 1.056297 σ =20 46.43078 1.479117 σ =40 46.43078 1.479117 Mdb155 HARD σ =10 45.31636 1.911807 σ =20 40.07731 6.387777 σ =40 39.42823 7.417502 Mdb155 SOFT σ =10 41.86942 4.228034 σ =20 39.4872 7.317464 σ =40 39.42823 7.417502
TABLE V. COMPARISON OF DIFFERENT MEDICAL IMAGES WITH DIFFERENT FILTERS
Author(s) Year Filter Type PSNR (db) MSE Ramani Vanitha & Valamathy, 2013 Median Filter (Gaussian noise) 36.4411(Mdb 001) 35.1238 (Mdb 155) 36.0199 (Mdb 322) 14.7559 19.9849 16.2589 Adaptive Median Filter (Gaussian noise) 38.8812(Mdb 001) 35.8423 (Mdb 155) 36.8811 (Mdb 322) 8.4131 16.9375 13.3343 Weiner Filter (Gaussian noise) 35.3998(Mdb 001) 35.1695 (Mdb 155) 35.9499 (Mdb 322) 18.7543 19.7755 16.5229 Mean Filter (Gaussian noise ) 34.1888(Mdb 001) 32.5136 (Mdb 155) 33.1645 (Mdb 322) 24.7854 36.4494 31.3787 Sidh,Khaira,Virk, 2012 MRI Images Harr filter (Speckle noise) 39.1906(hard threshold) 40.5521(soft threshold) 0.0208 0.0175 This study Db3 wavelet 48.7914(Mdb001hard Thresholding) 47.89294(Mdb001soft Thresholding) 0.85889 1.91180
Table V summarizes existing four types of filters for mammography images (MIAS database of digital mammograms) with Gaussian and simulation results are given. The simulated parameters such as mean square error and peak signal to noise ratio are reported. From these results the Db3 wavelet filter using hard and soft Thresholding perform better than the existing filters such as adaptive median filter, Weiner filter, mean filter and haar filter. The mean square error value is small for haar filter 0.0208 8.4131(hard Thresholding) and 0.0175 for soft Thresholding based on MRI images as shown in Table V. However, the PSNR for Db3 filter is 48.7914 db (hard Thresholding) and 47.89294 for soft Thresholding as shown in Table V which is high while compare with other reported filters.
V. CONCLUSION
In this paper, de-noising MIAS dataset is performed using different filter types such as sym8, haar,db3 and db4 at both soft and hard threshold levels and then the mean square error and peak signal to noise ratio is calculated. After applying these denoising wavelets filters, PSNR values are compared and it is found that db3 wavelet is more efficient than the rest filters. It is found the hard threshold is more suitable for mammogram images since edges are kept and noise was almost suppressed. These experiments helps
to select the best wavelet transform for the denoising of particular medical images such as mammograms images.
VI. FUTURE SCOPE
All the above mentioned calculations are being performed on two images (begin and malignant) from MIAS dataset to remove noise of the images and future work is to make it valuable for whole dataset and to enhanced PSNR values. Meanwhile, to extract statistical features for mammogram images.
ACKNOWLEDGMENT
The authors would like to thank Universiti Tun Hussein Onn Malaysia (UTHM) and office for Research, Innovation, Commercialization and Consultancy Management (ORICC) for supporting this research under the grant vote No.U110.
REFERENCES
[1] R. Rangarajan, R.Venkataramanan, and S. Shah, “Image denoising using wavelets”, Wavelet and Time Frequencies. 2002.
[2] R. M. Rao and A. S. Bopardikar, “Wavelet transforms-introduction to theory and application,”pp. I-XIII, Addison-Wesley-Longman, 1997.
[3] D. L Donoho, “ De-noising by soft-thresholding,”Information Theory, IEEE Transactions on, 41(3), 613-627. 1995.
[4] K. Sidh, B. Khaira and I. Virk, “Medical image denoising in the wavelet domain using haar and DB3 filtering.
,”
International Refereed Journal of Engineering and Science, 1, 1-8, 2012.[5] H. Zang, Z. Wang, and Y Zheng, “Analysis of signal de-noising method based on an improved wavelet thresholding,”. In Electronic Measurement & Instruments, 2009. ICEMI'09. 9th International Conference onpp. 1-987, IEEE. August 2009.
[6] A. Bhardwaj and M. K. Singh, “A Novel approach of medical image enhancement based on Wavelet transform,” International Journal of Engineering Research and Applications (IJERA). Vol. 2, Issue 3, May-Jun 2012, pp.2356-2360, June 2012.
[7] Y. Yang, Z. Su and L. Sun, “Medical image enhancement algorithm based on wavelet transform,” Electronics letters, 46(2), 120-121, 2010.
[8] I. Daubechies, “Ten lectures on wavelets,” Philadelphia: Society for industrial and applied mathematics, Vol. 61, pp. 198-202, 1992. [9] D. L., Donoho, I. M Johnstone, G. Kerkyacharian, , and D. Picard,
“Wavelet shrinkage: asymptopia?,”Journal of the Royal Statistical Society. Series B (Methodological), 301-369. 1995.
[10] R. K Rai, and T. R. Sontakke, “Implementation of Image Denoising using Thresholding Techniques,” International Journal of Computer Technology and Electronics Engineering (IJCTEE), 1(2), 6-10. 2011. [11] Ramani, R., Vanitha, N. S., & Valarmathy, S. (2013). The Pre-Processing Techniques for Breast Cancer Detection in Mammography Images.International Journal of Image, Graphics & Signal Processing, 5(4).