저작자표시-비영리-변경금지 2.0 대한민국 이용자는 아래의 조건을 따르는 경우에 한하여 자유롭게 l 이 저작물을 복제, 배포, 전송, 전시, 공연 및 방송할 수 있습니다. 다음과 같은 조건을 따라야 합니다: l 귀하는, 이 저작물의 재이용이나 배포의 경우, 이 저작물에 적용된 이용허락조건 을 명확하게 나타내어야 합니다. l 저작권자로부터 별도의 허가를 받으면 이러한 조건들은 적용되지 않습니다. 저작권법에 따른 이용자의 권리는 위의 내용에 의하여 영향을 받지 않습니다. 이것은 이용허락규약(Legal Code)을 이해하기 쉽게 요약한 것입니다. Disclaimer 저작자표시. 귀하는 원저작자를 표시하여야 합니다. 비영리. 귀하는 이 저작물을 영리 목적으로 이용할 수 없습니다. 변경금지. 귀하는 이 저작물을 개작, 변형 또는 가공할 수 없습니다.
Performance Analysis of MapReduce
with In-Memory Caching in HDFS
Tae-kyung Yoo
Department of Computer Engineering
Graduate School of UNIST
Abstract
In this paper, we study the effects of HDFS in-memory caching on various MapReduce applications. We first evaluate the performance of seven MapReduce applications to understand different resource usage patterns. We then modify the centralized cache management system in HDFS such that individual blocks of a file can be cached. Using the modified system in HDFS, we compare the performance of MapReduce applications with in-memory caching to that without in-memory caching for workloads of a single MapReduce application and multiple MapReduce applications. In the experiments, the same workload was executed multiple times to see the effects of in-memory caching. Our experimental results show that the in-memory cache system can be beneficial to workloads of multiple I/O-intensive MapReduce applications, but the in-memory cache system cannot improve the performance of non-I/O-intensive MapReduce applications, possibly degrading the performance due to the overhead of in-memory caching.
Content
I. Introduction ... 1
II. Experimental Setup ... 3
2.1 Hardware Specification ... 3
2.2 Hadoop Configuration ... 3
2.3 MapReduce Applications ... 5
III. Resource Usage Patterns of MapReduce Applications ... 7
IV. HDFS Cache Management System ... 13
4.1 Centralized Cache Management ... 13
4.2 Modified Cache Management ... 13
4.2.1 Cache registration ... 13
4.2.2 Modification in Hadoop ... 14
V. Performance Analysis: Single MapReduce Applications ... 15
VI. Performance Analysis: Multiple MapReduce Applications... 22
6.1 Setup ... 22
6.2 Workloads ... 23
6.2.1 Performance of Workloads ... 23
6.2.2 Performance of Applications ... 24
6.2.3 Resource Usage Patterns of Workloads ... 25
6.2.4 Cache Hit Ratio of Applications ... 26
6.2.5 Pure Runtime of Applications ... 27
VII. Related Work ... 29
List of Figures & Tables
Figure 2.1 The architecture of YARN framework ... 4
Figure 3.1 The resource usage pattern of Aggregation ... 8
Figure 3.2 The resource usage pattern of Grep ... 8
Figure 3.3 The resource usage pattern of Join ... 9
Figure 3.4 The resource usage pattern of KMeans ... 10
Figure 3.5 The resource usage pattern of Pagerank ... 10
Figure 3.6 The resource usage pattern of Sort ... 11
Figure 3.7 The resource usage pattern of Wordcount ... 11
Figure 5.1 The runtime of each application ... 15
Figure 5.2 The resource usage pattern of Aggregation when using the in-memory cache ... 17
Figure 5.3 The resource usage pattern of Grep when using the in-memory cache ... 17
Figure 5.4 The resource usage pattern of Join when using the in-memory cache ... 18
Figure 5.5 The resource usage pattern of KMeans when using the in-memory cache ... 19
Figure 5.6 The resource usage pattern of Pagerank when using the in-memory cache ... 19
Figure 5.7 The resource usage pattern of Sort when using the in-memory cache ... 20
Figure 5.8 The resource usage pattern of Wordcount when using the in-memory cache ... 21
Figure 6.1 The normalized runtime of workloads ... 24
Figure 6.2 The normalized runtime of each application ... 24
Figure 6.3 The CPU usage of workloads on the original and cache Hadoop system ... 25
Figure 6.4 The disk throughput of workloads on the original and cache Hadoop system ... 26
Figure 6.5 The cache hit ratio of workloads ... 27
Table 2.1 The hardware specifications ... 3
Table 2.2 The resource properties ... 4
Table 2.3 The input size of applications ... 5
Table 3.1 The average resource usage of all applications ... 7
Table 5.1 The normalized runtime using cache ... 16
Table 5.2 The average resource usage of all applications when using an in-memory cache ... 16
Table 6.1 The unique input sets used in the experiments ... 22
- 1 -
Chapter 1
Introduction
MapReduee is a generally used programming model to process large data sets [4]. This programming model has advantages that easily utilize distributed computing for users by high level methods. Also, it is actually commanly used in read-world companies like Facebook, Yahoo, etc.
Apache Hadoop project [10] is widely used framework for MapReduce. It has strength that users simply control many nodes. On the contrary, although it provides limited detail settings, there are not the settings about data reuse. Data reuse is very common in machine learning or clustering algorithms implemented by MapReduce such as Pagerank and KMeans. In addition to applications based on iterative algorithms, data reuse is occurred a lot in ordinary real-world applications. According to the workloads of Facebook and Bing, the portion of single-accessed files is only 11% and 6% of jobs in the Facebook and Bing workloads [7]. Therefore, data reuse is an easy approach to increase the performance of large data processing frameworks. However, Hadoop framework cannot use resources efficiently when data reuse exists.
In Hadoop Distributed File System (HDFS), it basically uses an OS buffer cache for data reuse. When files are used by users, it is cached in the OS buffer cache if the memory is sufficient. But, this method has a problem that it cannot identify whether files are cached or not, and it wastes a remaining memory when the same block is accessed to another replica. Fortunately, these problems can be solved by explicitly checking whether those files are cached or not. Recently an explicit caching mechanism was added to new Hadoop version 2.3.0, and so users can simply cache files to memory.
However, this feature has the following issues: users must register caches by file units. HDFS supervises files by block units, but users cannot select what block is cached. This means that users cannot select the desired datanode. We can confirm that large files have higher access counts from the workloads of Facebook and Bing [7]. Also, according to distribution of input job sizes of a large cluster from Microsoft [8], in-memory caching by file units will inefficiently use memory resources.
In this paper, we study the effects of HDFS in-memory caching on various MapReduce applications. We first evaluate the performance of seven MapReduce applications to understand different resource usage patterns. From the evaluation, we confirm that the I/O resource is not a dominant position in all MapReduce applications. Overall, the average I/O wait is lower than 10%.
- 2 -
We then modify the centralized cache management system in HDFS. We change the registration of cache to explicitly add the datanode and block ID. It allows that individual blocks of a file can be cached. And, the application master of MapReduce and the resource manager do not know the information about caches in the original version of Hadoop. So we added new information type, cache type for node, rack and off-switch locality. This information can be used for delay scheduling.
Lastly, we compare the performance of MapReduce applications with in-memory caching to that without in-memory caching for workloads of single MapReduce applications and multiple MapReduce applications using the modified system in HDFS. The results of single MapReduce applications show that aggregation, grep, join and sort have the improvement of performance at least 8.1%, and up to 35.5%. In Multiple MapReduce applications, the worst applications set has the increased time by 15.4% and the best applications set has the decreased time by 10.6%. Also, the improvement of performance of the pure runtime is much better than the runtime of workloads. The pure runtime means the total execution time of all tasks in the application except other factors like scheduling overhead. This result shows that benefits of the cache system are not perfectly reflected to the runtime of workload. Therefore, if we can identify this reason, the results of in-memory caching have much more the improved performance.
- 3 -
Chapter 2
Experimental Setup
2.1 Hardware Specification
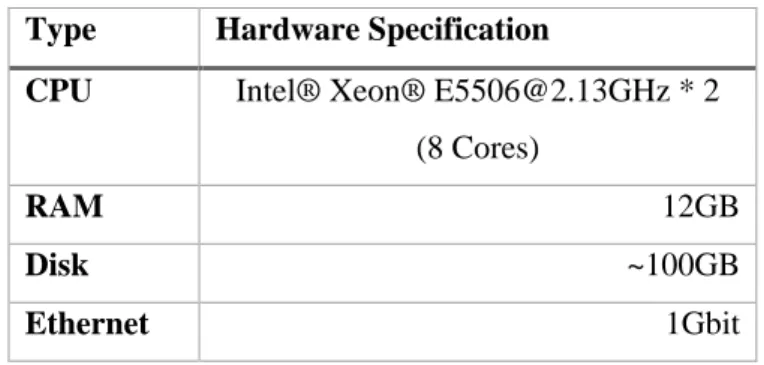
For our experiments, we have used total 39 nodes which are bounded by one rack. All of nodes have the same hardware specifications, Intel Xeon CPU [email protected] * 2, 12GB of memory, and nearly 100GB local disk. These nodes are connected via1Gbit Ethernet. Consequently, those experiments were tested on total 304 CPUs, 456GB RAM and 3.8TB hard disk.
Table 2.1 The hardware specifications Type Hardware Specification
CPU Intel® Xeon® [email protected] * 2 (8 Cores)
RAM 12GB
Disk ~100GB
Ethernet 1Gbit
2.2 Hadoop Configuration
In our experiments, we used Hadoop-2.4.1, which is a new version of Hadoop project which implemented new features of HDFS and MapReduce NextGen as known as YARN. In this version of Hadoop, the job tracker and the task tracker was changed. The two major functionalities of the job tracker, resource management and job scheduling / monitoring were divided into separate daemons [1]. The resource manager, the new daemon of Hadoop framework, has responsibility for resource management of all nodes. It only handles virtual cores and memory, and then provides resources to clients by scheduling policies. The task tracker is changed to the node manager, but it has very similar functionality with the task tracker. However, to change the number of map and reduce tasks, we do not
- 4 -
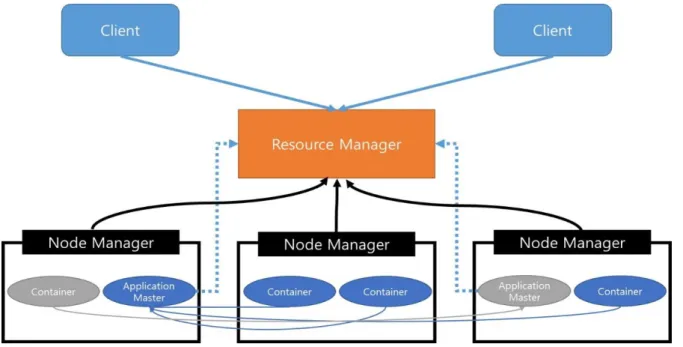
have to configure the number of map or reduce task slots anymore. Instead, we edit memory usage of a task. Hence, the number of running tasks in the node manager varies depending on configuration values in the node manager and task configuration files. The application master, which has authority for job scheduling / monitoring, is assigned to the container. Comparing the previous version with the new version, it uses a task slot to manage a job. Figure 2.1 represents a new architecture of YARN.
Figure 2.1 The architecture of YARN framework
Table 2.2 The resource properties
Properties Values
Map.memory 1024 MB
Reduce.memory 2048 MB
Nodemanager.resource.memory 8192 MB
Table 2.2 shows memory configuration used in the experiments. The amounts of memory allocated for the node manager, a map task, and a reduce task are 8GB, 1GB, and 2GB, respectively. These configurations are related to recommended values by hortonworks [12]. We use the memory less than the recommended value, because we have to hold a remaining memory for in-memory caching. In YARN paper [1], they used more under-committed settings than our settings. Thus, it is fully reasonable.
- 5 -
Regarding default properties related to HDFS, the block size is 128MB and the number of replicas is three.
2.3 MapReduce Applications
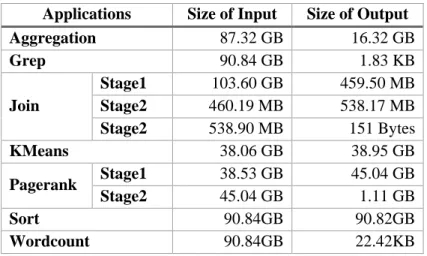
In this section, we describe MapReduce applications used in our experiments. To test MapReduce, we use Intel HiBench, Hadoop benchmark suite [2]. We test seven MapReduce applications which are widely used for benchmarks or real-world applications. The name, input and output size of applications are represented in Table 2.2.
Table 2.3 The input size of applications
Applications Size of Input Size of Output
Aggregation 87.32 GB 16.32 GB Grep 90.84 GB 1.83 KB Join Stage1 103.60 GB 459.50 MB Stage2 460.19 MB 538.17 MB Stage2 538.90 MB 151 Bytes KMeans 38.06 GB 38.95 GB Pagerank Stage1 38.53 GB 45.04 GB Stage2 45.04 GB 1.11 GB Sort 90.84GB 90.82GB Wordcount 90.84GB 22.42KB
Aggregation and Join supported by Hive project, which is a top level project in Hadoop project, are well-known applications to benchmark the Hadoop system. The actual Hive-QL query sentences are provided in [13]. We tried to process the input size of applications similar with the original settings used in the paper, but we could not do it due to a limited remaining disk capacity.
Grep, Sort, Wordcount are supported by Hadoop MapReduce examples, and these applications are generally used to test the Hadoop system whether it is correctly behaved or not. In our experiments, Grep searches files specified as regular expression, ‘^a[a-z]*’. It means that Grep searches files for starting small letter ‘a’. Sort and Wordcount are worked on defaults settings. The input files used in those applications are generated by random-text-writer.
- 6 -
KMeans is the part of the Apache Mahout project. It is famous for cluster analysis in data mining. This workload computes the centroid of each cluster until the maximum number of iterations. Lastly, driver Hadoop job is launched to assign each sample to the cluster and write outputs [2]. The number of iteration value is set by users, so we set the number of iteration to five.
Pagerank is a really popular algorithm used by Google Search to rank websites in their search engine results according to the number of reference links [2]. In HiBench, the Pagerank algorithm included in Pegasus 2.0 is used. This Pagerank application consists of multiple stages, and if the convergence condition is not satisfied, a new iterative Hadoop job runs [2]. In this experiment, the convergence condition is fulfilled by one Pagerank application composed of two stages.
- 7 -
Chapter 3
Resource Usage Patterns of MapReduce Applications
In this section, we analyze the resource usage patterns of the seven applications on the Hadoop system. We then discuss the characteristics of resource usage patterns of each application for assuming the effect of in-memory caching system.
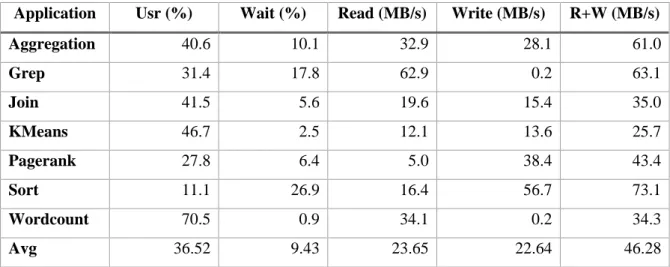
Table 3.1 The average resource usage of all applications
Application Usr (%) Wait (%) Read (MB/s) Write (MB/s) R+W (MB/s)
Aggregation 40.6 10.1 32.9 28.1 61.0 Grep 31.4 17.8 62.9 0.2 63.1 Join 41.5 5.6 19.6 15.4 35.0 KMeans 46.7 2.5 12.1 13.6 25.7 Pagerank 27.8 6.4 5.0 38.4 43.4 Sort 11.1 26.9 16.4 56.7 73.1 Wordcount 70.5 0.9 34.1 0.2 34.3 Avg 36.52 9.43 23.65 22.64 46.28
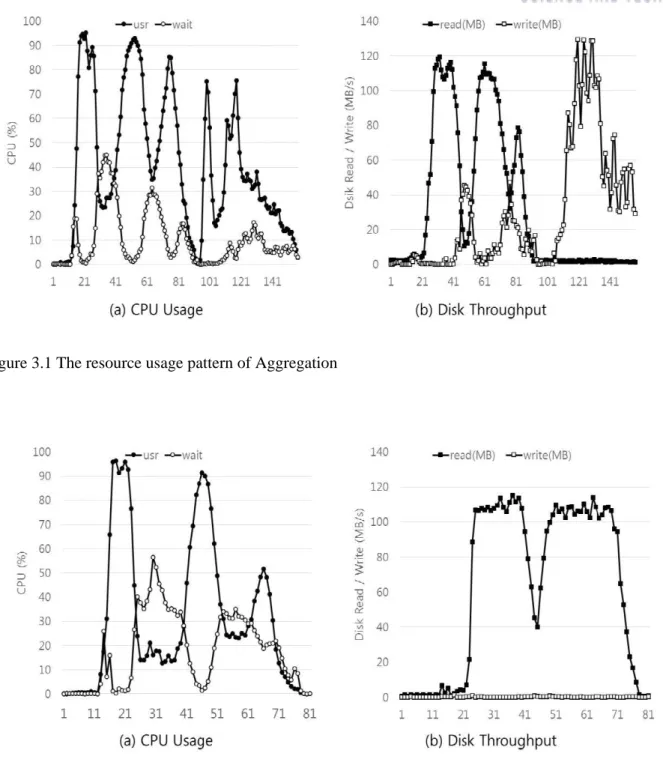
Aggregation this application has an average disk read / write usage, 32.9MB/s and 28.1MB/s, respectively. Most of the disk reads in Aggregation occur in the map phase. On the contrary, most of disk writes are in the reduce phase. Comparing I/O wait values between the map phase and the reduce phase in Figure 3.1, we can see that the disk read in map tasks causes more I/O contention than disk write in reduce tasks. And, there is the decrement of CPU usage in the map phase by I/O contention.
- 8 - Figure 3.1 The resource usage pattern of Aggregation
Figure 3.2 The resource usage pattern of Grep
Grep Grep has the highest the amount of disk reads in all of applications. Overall, disk read is the dominant influence on Grep, and disk write of Grep is close to 0. Thus, the reduction in CPU usage by the disk read can be seen in Figure 3.2 (a). Also, the rapid decrease of disk read exists in Figure 3.2 (b) due to the initialization of tasks. We discuss it in detail later.
- 9 - Figure 3.3 The resource usage pattern of Join
Join Join is an application composed of three stages. In these multiple stages, the input of stage2 is the output of stage1. Similarly, stage3 uses the result of stage2. In terms of disk usage, stage1 has higher disk read and write than other stages. The resource usage patterns of stage1 are similar with the patterns of Aggregation. In Figure 3.3, CPU usage of this application seems like well-distributed within stages, and disk write in stage2 has lower I/O contention than disk writes in stage1 because the amount of disk reads is small in stage2.
KMeans KMeans has high CPU usage in each iteration. But, since each iteration is made by one Hadoop job, it spends a lot of time to initialize the job. For this reason, KMeans cannot use computing resources efficiently. It is revealed in the average of CPU usage. In Figure 3.4 (a), CPU usage peaks at nearly 100%, but the average CPU usage is 46.7%. And we can find two characteristics in Figure 3.4. First, disk read values are gradually decreased at each iteration. It is the effect of an OS buffer cache. When blocks in HDFS are read, HDFS uploads that blocks to the OS buffer cache. Thus, if a memory capacity of cluster is sufficient to upload all input files of KMeans, then later iterations are affected by the OS buffer cache. Second, only last iteration has high disk write values. The reason it has high I/O write usage is that it has responsibility to write the final output to HDFS. Thus, disk read and write are occurred concurrently in last iteration, but we cannot see disk read values due to the OS buffer cache in the result.
- 10 - Figure 3.4 The resource usage pattern of KMeans
Figure 3.5 The resource usage pattern of Pagerank
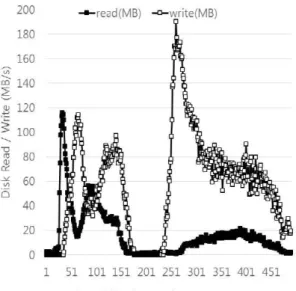
Pagerank Pagerank is composed of two stages. Similar with Join, stage 2 uses the output of stage 1. The map phase in stage1 transfers the entire input files to reduce phases, and the reduce phase in stage1 writes the overall input files to HDFS. The size of output files is slightly larger than the original size. Similarly, the map phase in stage 2 writes intermediate files which have same size with input files. After
- 11 -
that, the reduce phase in stage 2 filters the own input data and writes the final output to HDFS. As a result, this application writes a lot of data to local disk and HDFS. We can see heavy-disk write in Figure 3.5 (b), and I/O wait values caused by this disk write in Figure 3.5 (a).
Figure 3.6 The resource usage pattern of Sort
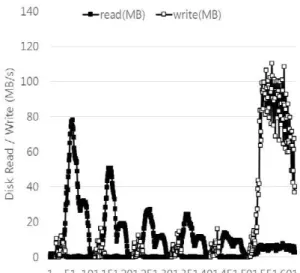
Sort Sort is a typical I/O-intensive application. In Figure 3.6 (b), it is influenced by heavy I/O in most of running time. Since the size of input data of Sort is same with the input of Grep and Wordcount, a lot of disk read exists in map phase and map tasks in Sort transfer all input data to reduce tasks like Pagerank. Therefore, we can see that I/O wait values are larger than CPU usage in most of time in Figure 3.6 (a).
- 12 - Figure 3.7 The resource usage pattern of Wordcount
Wordcount Wordcount consumes a lot of CPU resources more than all applications in these experiments. In Figure 3.7 (a), Wordcount has almost 100% CPU usage in most of time. Also we can see that there are some disk read in Figure 3.7 (b), but it incurred a little I/O contention. It can be seen by the rise of I/O wait values in the early map phase.
In summary, Join, KMeans, Pagerank and Wordcount have I/O wait under 10%. This means that I/O wait is not a universal element for decreasing the performance of applications. As a result, we can know that the runtimes of MapReduce applications are influenced by the diverse resource usage patterns. However, there is the same reason between applications. All applications implemented in Hadoop MapReduce have too long initialization task time. As a representative, we checked the initialization time of map tasks in Grep. This time was measured between the start of newly launched containers and the point which really executed ‘run’ method. As a result, the average, the min and the max of initialization time of map tasks are 6.15 seconds, 3.01 seconds and 10.02 seconds respectively. The mean time of map tasks in Grep is 21 seconds. Therefore, the initialization is about 30% of the total. Consequently, we can know that MapReduce implemented in Hadoop project has the critical issue about initializing tasks, and this factor disturbs an entire system to use compute resources efficiently.
- 13 -
Chapter 4
HDFS Cache Management System
In this section, we describe the new feature of HDFS, centralized cache management system and we discuss the modified cache management system. Because the original cache management system in Hadoop has uncomfortable methods and uses resources inefficiently, we focus on using the system flexibly.
4.1 Centralized Cache Management
When HDFS uses the OS buffer cache, there are two basic problems; First, HDFS reads are cached in each datanode’s OS buffer cache, but high level framework (e.g. MapReduce) cannot recognize locations of caches. Second, users cannot control files in the OS buffer cache. Although users want to permanently store blocks in the OS buffer cache, it may be replaced with other files when the OS buffer cache is fully filled. Fortunately, both of these problems can be easily solved if files are explicitly cached on HDFS. As a result, explicit cache management called centralized cache management was implemented on HDFS.
4.2 Modified Cache Management
4.2.1 Cache registration
In the original system, only HDFS file path is needed to cache files. We modified these things to use memory more flexibly. First, we can upload a file by block units to the cache system. It means that some selected blocks of a file can be cached in this system. Second, we can also add a datanode IP. This information represents the specific location in which the block will be cached. If users do not add a datanode IP, a block will be cached by default algorithms.
These changes have advantage as follows: we can use the cache memory space more flexibly. This flexibility provides that cache policy (e.g. add, evict) can be applied more delicately. This is needed because of the following issues: First, the large files have high access counts than the small files. This trend is shown in the workload of Facebook and Bing [7]. Second, 20% input files in the large cluster have more than 1TB size in the distribution of input size on a production cluster in Microsoft [8].
- 14 -
Considering the largest input size of job in a production cluster, a flexible cache memory management system is required to gain the highest data reuse in the environment of limited memory capacities.
4.2.2 Modification in Hadoop
In current YARN system, though in-memory cache feature is added in HDFS, the resource manager cannot recognize whether block is cached or not. Hence, it cannot allocate resources by optimized ways. To solve this issue, we write the information about task IDs and block IDs to a job setup xml file when initializing a job. The mapping information about task and block is used when the application master requests resources to the resource manager and receives resources from the resource manager. When requesting resources, we add the new ‘cache’ type to default three types, node, rack, and off-switch type. This information can be used for delay scheduling [9]. When the application master receives resources, it allocates resources on cache level at first.
Since cache policies are out of our research scope, we apply a very simple policy. Our cache policy add requests to the cache system at the first-come order. If the memory capacity of cache system is out of limit, tasks do not send the request to cache the block. This policy is similar with MRU (Most Recently Used) policy, because oldest files are always in cache. Thus, the performance of this policy is not bad in data reuse [17].
Our delay scheduling is very simple. Since the cached blocks in our system are a subset of node locality, the scheduler awaits cache locality first. We set the default cache delay value to 20. Therefore, at first, the scheduler misses the opportunity until the number of missed opportunity exceeds the cache delay value, 20. Next, it also waits until the number of missed opportunity exceeds the node delay value, 40. Thus, the total count of missed nodes to satisfy the node locality is equal to the original delay scheduling. And the rack and off-switch locality are same with the original delay scheduling.
- 15 -
Chapter 5
Performance Analysis: Single MapReduce Applications
In this chapter, we analyze the results of single MapReduce applications using in-memory caching. Also we discuss about what elements affect the performance. Before experiments, we set a cache memory capacity. Each node has 4GB memory for an in-memory caching, the other settings are equal to the original configurations.
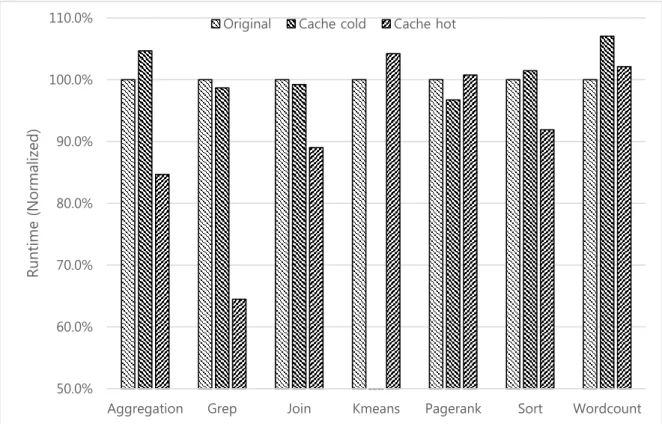
Figure 5.1 The runtime of each application
Figure 5.1 and table 5.1 show the normalized runtime graph of these experiments. The caching overhead is small enough to dynamically cache files. The worst cache cold result is Wordcount. The overhead of Wordcount is 10 seconds. On the contrary, the best cache cold result is Pagerank, and the
50.0% 60.0% 70.0% 80.0% 90.0% 100.0% 110.0%
Aggregation Grep Join Kmeans Pagerank Sort Wordcount
Ru
nt
ime
(Normalized)
- 16 -
overhead of it is -13 seconds. Rather, it has the decreased running time. Therefore, the caching overhead is sufficiently within the error range.
Table 5.1 The normalized runtime using cache Applications Cache – Cold Cache – Hot
Aggregation 104.7% 84.7% Grep 98.7% 64.5% Join 99.2% 89.7% KMeans - 104.2% Pagerank 96.7% 100.8% Sort 101.5% 91.9% Wordcount 107.0% 102.1%
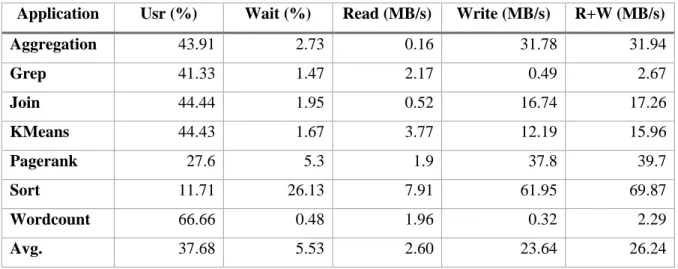
Table 5.2 The average resource usage of all applications when using an in-memory cache Application Usr (%) Wait (%) Read (MB/s) Write (MB/s) R+W (MB/s)
Aggregation 43.91 2.73 0.16 31.78 31.94 Grep 41.33 1.47 2.17 0.49 2.67 Join 44.44 1.95 0.52 16.74 17.26 KMeans 44.43 1.67 3.77 12.19 15.96 Pagerank 27.6 5.3 1.9 37.8 39.7 Sort 11.71 26.13 7.91 61.95 69.87 Wordcount 66.66 0.48 1.96 0.32 2.29 Avg. 37.68 5.53 2.60 23.64 26.24
- 17 -
Figure 5.2 The resource usage pattern of Aggregation when using the in-memory cache
Aggregation The runtime of Aggregation is decreased by 15% compared to the original execution. Comparing the CPU usage of original and cache in Figure 3.1 and Figure 5.2, I/O wait is dramatically decreased in map phases and it causes the increase of CPU usage. The reduce phase has the same result with the original Aggregation because our cache system does not affect the reduce phase,
- 18 -
Grep Grep is the best application in these application sets. The runtime of Grep is rapidly decreased by 36% compared to the original execution. In Figure 5.3 (a), we can see that the increased CPU usage like Aggregation. However, the rapid decrease of CPU usage caused by the initialization of tasks still exists.
Figure 5.4 The resource usage pattern of Join when using the in-memory cache
Join The runtime of Join is decreased by 10% compared to the original execution. Since the resource usage patterns of stage 1 are similar with Aggregation, we can see the increased CPU usage in Figure 5.4 (a). However, stage 2 and stage 3 are not affected by the cache because they use the output of stage 1 and 2 respectively. Nevertheless, Join can shorten its execution time since the portion of stage 1 are the largest part in Join.
- 19 -
Figure 5.5 The resource usage pattern of KMeans when using the in-memory cache
KMeans The runtime of KMeans is increased by 4.2% compared to the original execution. We did not measure the caching overhead because this application is based on iteration. Hence, this result includes the caching overhead on first iteration. In Figure 5.5 (a), iterations are CPU intensive except last iteration. Thus, disk read cannot affect a lot. The last driver iteration is shortened because it causes disk read and write concurrently. However, the proportion of five iterations is larger than the last iteration. As a result, the result of this application has slow execution time than the original execution time.
- 20 -
Figure 5.7 The resource usage pattern of Sort when using the in-memory cache .
Pagerank Pagerank is increased by 0.8% compared to the original execution. This result is enough in error rates. Similarly with Join, the effect of cache exists only in stage 1 because this application is composed of multiple stages. But, in contrast with Join, stage 1 and 2 have similar runtime and the execution time of first map phase does not have large portion in Pagerank. Thus, the influence of cache is very small. As a result, Pagerank does not have a better performance.
Sort Sort is decreased by 8% compared to the original execution. Comparing the resource usage patterns of Figure 3.6 and Figure 5.7, we can see the reduced I/O wait values in the map phase by using an in memory cache. But, there are still high I/O wait values because of the heavy disk write.
- 21 -
Figure 5.8 The resource usage pattern of Wordcount when using the in-memory cache
Wordcount Wordcount is increased by 2% compared to the original execution. We already know that this application cannot cause an I/O contention. Likewise, in Figure 5.8 (a), the cache system removes the I/O wait at first of map phase, but it cannot decrease the execution time of Wordcount. Rather, it is increased by 3 seconds; but it is in error rates.
In summary, Aggregation, Grep, Join and Sort can be shortened by using in-memory cache, but, KMeans, Pagerank and Wordcount do not. These results show the followings:
CPU intensive applications like Wordcount, KMeans have low disk read. On the contrary, applications which spend most of time on reading blocks like Grep increase a lot of performance. Comparing the CPU usage of those applications, the former rather has reduced CPU usage, but the latter has increased CPU usage. Therefore, the portion of read in applications is an important feature.
Multiple stages applications like Join and Pagerank are hard to reuse the input files. These applications use the output of previous stage result to the input of next stage. This usage is not suitable for HDFS cache system because it does not repeatedly read input files from the HDFS. Hence, the increased performance of this type of applications is decided according to the portion of stages which can use input repeatedly.
- 22 -
Chapter 6
Performance Analysis: Multiple MapReduce Applications
In this chapter, we analyze workloads of applications submitted by multiple users. The reason for this measure is as follows: If users submit one or more applications, resource usage of nodes is more dynamically changed due to composition of map and reduce phases. In this situation, the benefit from applications like Aggregation, Grep, Join and Sort can help the improvement of overall performance.
6.1 Setup
These experiments have the following conditions: First, we submit four applications concurrently. Second, each application can use resources by 25% of all nodes. If not, resource imbalance between submitted applications is occurred; some applications can get free slots immediately, but the others cannot get it. Due to this situation, time difference between executions can be really big. Third, all of resource usage values are averaged when the shortest application is ended. Because it guarantees that all applications are executed together until this time. Table 6.1 represents input sets which are shared between applications. Grep, Sort, Wordcount share input files, and also same hive application - Aggregation and Join share input files. Kmeans and Pagerank cannot share input files with the other applications due to a specific input format. And due to the execution time, the size of input files of Pagerank is a half of the single MapReduce application setup.
Table 6.1 The unique input sets used in the experiments Input sets Applications
Input set 1 Grep, Sort, Wordcount Input set 2 Aggregation, Join Input set 3 KMeans
- 23 -
6.2 Workloads
Table 6.2 represents that the name of applications used in workloads, the number of unique sets and the number of cache affined applications. Cache affined applications mean that applications have a benefit of the in-memory cache system in chapter 5. Aggregation Grep, Join and Sort belong to the here. Except KMeans, we submitted application more than two times due to achieving cache effects. And we finished experiments when the last application which executed more than two times was ended.
Table 6.2 The composition of workloads
Workloads App.1 App.2 App.3 App.3 Unique
Sets
Cache affined
Workload 1 Grep Grep Sort Wordcount 1 3
Workload 2 Aggregation Grep Join Sort 2 4
Workload 3 Aggregation KMeans Pagerank Wordcount 4 1
Workload 4 Join Pagerank KMeans Sort 4 2
Workload 5 Aggregation Grep KMeans Wordcount 3 2
Workload 6 Aggregation Grep Sort Wordcount 2 3
Workload 7 Aggregation Grep Pagerank Sort 3 3
Workload 8 Aggregation Grep KMeans Sort 3 3
6.2.1 Performance of the System
Figure 6.1 represents the normalized runtime between the original and cache system. Makespan means the difference between the start time of workload and end time of the last application. And Average is the average of normalized runtime for each application in workloads.
The best workload is workload 6. It has the improved performance at 89.4% in Makespan, and at 88.6% in Average. And the worst case is workload 4. It has the increased time than the original Hadoop. The increased value is 115.4% in Makespan, and 112.8% in Average. These results show that the cache system can increase the performance of application sets, but the reverse also exists.
We already know that workload 3 and workload 4 are little influenced by the cache system from the composition of applications since they have all different unique sets. However, although workload 5, 6, 7, and 8 have similar unique sets and cache affined applications, but the results are very different. Hence, we must analyze why those workloads have the difference of performance.
- 24 -
Figure 6.1 The normalized runtime of workloads
6.2.2 Performance of Applications
Figure 6.2 The normalized runtime of each application
We also check the characteristics of each application result. It is as in the following:
The trend of this result is the same with the result of workloads. It means that the result of each application is different with the result of chapter5, single MapReduce application. The best application is Sort. It has the improvement of performance at minimum 4.3% and maximum 19%.
- 25 -
The worst application is Pagerank. In Figure 6.2, it always has the increased time than the original execution.
The results of Pagerank and KMeans are bad, or even have worse performance than the original. Especially, Pagerank has similar resource usage patterns with Sort, but the result is really difference. The cause why Pagerank cannot increase the performance is equal to the result of single MapReduce application. The benefit of first map phases is smaller than the overhead of other three phases. However, in Sort, this benefit is larger than the increased time of reduce phase in multiple MapReduce applications.
Aggregation and Grep have not always increased performance. We guess that those applications may have a lot of increased performance because their performance are increased a lot in the single application cache analysis. We discuss about it later in 6.2.5. Wordcount has better performance most of time unlike KMeans, but it does not mean that Wordcount really has increased performance on task level. It is also discussed in 6.2.5.
6.2.3 Resource Usage Patterns of Workloads
- 26 -
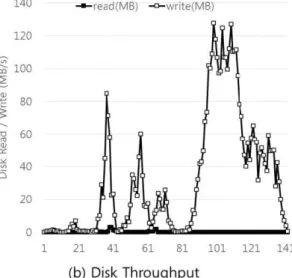
Figure 6.4 The disk throughput of workloads on the original and cache Hadoop system
Figure 6.3 and 6.4 represent the resource usage of each workload on the original Hadoop system or cache system. Averagely, disk throughput and I/O wait values are decreased in cache system because they read files from memory. The amount of decrease is from 64.1 to 51.8 MB/s, and from 12.8 to 8.7 %, respectively. On the contrary, disk writes and CPU usage cannot be increased to the amount of decreased disk throughput and I/O wait values. Except workload 2, the increased CPU usages are lower than the decreased I/O wait value. The average of CPU usage in workloads even decreases from 45.6 to 45.1 %.
In Figure 6.3, workload 3 and workload 5 have the similar IO wait value. Workload 3 has the decreased performance, on the other hand, workload 5 have a lot of increased performance. The difference between workload 3 and 5 is in Figure 6.4. Comparing disk read of workload 3 and 5, they have different portion of disk read. Thus, workload 5 reduce a lot of disk read and increases its performance, but, workload 3 do not. This result show that the portion of read in disk throughput is important element to decide the improvement of performance of application sets. !!!
6.2.4 Cache Hit Ratio of Applications
Figure 6.5 represents that the cache hit ratio of each application in each workload. Since we do not develop any cache policies except upload, first uploaded blocks are located in the memory until the end. Applications which have multiple stages like Join and Pagerank have really low cache hit ratio. The
- 27 -
average of cache hit ratio is 37.6% and we can remove disk read about 15 MB/s. This is about 10% of disk bandwidth of widely used hard disk specification [15] in these days.
Figure 6.5 The cache hit ratio of workloads
6.2.5 Pure Runtime of Applications
Figure 6.6 The pure runtime of each application
Figure 6.6 represents that the pure runtime of all tasks in each workload. The pure runtime means that the time spent by all tasks in the application. Thus, we can know that how much each task execution
- 28 -
performance is risen compared to the original except other factors like scheduling overhead by the pure runtime values.
Comparing Figure 6.2 and Figure 6.6, we can know as followings:
Overall, time spent by all tasks have some different trends with runtime values. The runtime of Grep in workload 1 or Aggregation in workload 3 exceeds 100% normalized runtime, which means cache system spent more time than original system. But, in the case of the pure runtime of all tasks values, both Grep and Aggregation have short values when using the cache system. Also, the runtime values of Sort have more increased performance than Grep in workload 8, however, the improvement of Grep was much better than Sort in the pure runtime of all tasks.
Second, when we used the cache system, applications except KMeans, Pagerank and Wordcount have increased performance than the original Hadoop system. The trend of this result is different with the runtime result, but it is same with the result of single MapReduce applications.
Lastly, the average pure runtime of applications is less than the average runtime of applications of workloads by 6.2%. These results show that the system cannot fully utilize the benefit of compute resources gained by caches due to another reasons (e.g. scheduling overhead, load-balancing, etc.). If we can accurately analyze these reasons and solve them, then we can show the more improved performance.
- 29 -
Chapter 7
Related Work
Spark [3] is a framework to implement Resilient Distributed Datasets (RDDs) [5]. It provides several parallel operations to programmer and can use in-memory computation by RDDs. Spark writes the output of iterations to in-memory, and it can be reused for the next iteration or fault-tolerance. The difference with RDDs and our system is the file system. One of the main objectives of RDDs keeps the output of each iteration of iteration applications for reusing the repeated data. Since our approach flexibly caches files on HDFS to obtain the improvement of performance, it has a different goal with RDDs.
PACMan [7] suggests that data reuse is frequent in real-world applications as well as iteration applications. It makes the PACMan client and the coordinator to caching the input files. Clients take charge of caching and sending files to the datanode. The coordinator manage the state of their cache information, so it supports queries where a block is cached. This architecture is similar with the centralized cache management, but it is different that datanodes ask whether a block is cached or not to PACMan clients.
Main Memory Map Reduce (M3R) [6] is a new framework of MapReduuce. This framework modified that reduce tasks read the intermediate files through the block device. It keeps the output of map tasks in memory, so reduce tasks can read their inputs from in-memory.
In [14], a novel distributed cache system named HDCache is built on the top of HDFS. If users want to use this system, they must use the methods in the C/C++ library of HDCache. Using those methods, users upload files on HDFS to the cache system or read files from the cache system.
- 30 -
Chapter 8
Conclusion
Data reuse is the most important element in frameworks which process large data sets. Existing Hadoop framework tries to resolve data reuse by using the OS buffer cache, but it has weaknesses like the absence of information about cache locations and inefficient memory usages. To solve these issues, explicit cache mechanism was added to HDFS. However, it still has limitations on applying to real-world applications proposed other papers. Thus, we modified these restrictions to use cache more flexibly. We then evaluate and analyze the performance of seven MapReduce applications using an in-memory caching system.
Our experiment results show the following points:
All of MapReduce applications did not show the I/O-intensive resource usage patterns. The influence of I/O was different each application. Some applications had the increased performance, but the others did not.
The effect of cache was changed by co-runner applications when the application was executed concurrently. One of the composition of I/O-intensive applications had a lot of improved performance by using an in-memory cache. On the contrary, some workloads had similar results to original results, and the others rather decreased the performance.
The average pure runtime of applications was less than the average runtime of applications of workloads by 6.2%.
These results show that if we discover specific reasons about difference between the results of task-level pure execution time and the results of runtime, and modify it to reflect obtained benefits by in-memory caches to this system, then MapReduce will get a better performance by in-in-memory caching in HDFS.
- 31 -
References
[1] V. K. Vavilapalli, A. C. Murthy, C. Douglas, S. Agarwal, M. Konar, R. Evans, T. Graves, J. Lowe, H. Shah, S. Seth, B. Saha, C. Curino, O. O’Malley, S. Radia, B. Reed, and E. Baldeschwieler. Apache Hadoop YARN: yet another resource negotiator. In Proceedings of the Third ACM Symposium on Cloud Computing (SoCC), 2013
[2] Huang, S., Huang, J., Dai, J., Xie, T., Huang, B.: The HiBench Benchmark Suite: Characterization of the MapReduce-Based Data Analysis. In: 2010 IEEE 26th International Conference on Data Engineering Workshops (ICDEW)
[3] Zaharia, M., Chowdhury, M., Franklin, M., Shenker, S., Stoica, I.: Spark: Cluster Computing with Working Sets. In the 2nd USENIX Workshop on Hot Topics in Cloud Computing (HotCloud), 2010
[4] Dean, J., Ghemawat, S.: MapReduce: Simplified Data Processing on Large Clusters. In: the 6th Symposium on Operating Systems Design and Implementation (OSDI), 2004
[5] Zaharia, M., Chowdhury, M., Das, T., Dave, A., Ma, J., McCauley, M., Franklin, M., Shenker, S., Stoica, I.: Resilient Distributed Datasets: A Fault-Tolerant Abstraction for In-Memory Cluster Computing. In: the 9th USENIX Symposium in Networked Systems Design and Implementation (NSDI), 2012
[6] A. Shinnar, D. Cunningham, B. Herta, and V. Saraswat. M3R: Increased performance for in-memory Hadoop jobs. Proceedings of the VLDB Endowment (PVLDB), 5(12): 1736-1747, 2012. [7] Ananthanarayanan, G., Ghodsi, A., Wang, A., Borthakur, D., Kandula, S., Shenker, S., Stoica, I.: PACMan: Coordinated Memory Caching for Parallel Jobs. In: the 9th USENIX Symposium in Networked Systems Design and Implementation (NSDI), 2012
[8] Appuswamy, R., Gkantsidis, C., Narayanan, D., Hodson, O., Rowstron, A.: Scale-up vs Scale-out for Hadoop: Time to rethink? In Proceedings of the Third ACM Symposium on Cloud Computing (SoCC), 2013.
[9] Zaharia M., Borthakr D., Sarma J. S., Elmeleegy K., Shenker S., and Stoica I. Delay scheduling: A simple technique for achieving locality and fairness in cluster scheduling. In Proceedings of the 5th European Conference on Computer Systems (EuroSys), 2010.
- 32 -
[11]Centralized Cache Management in HDFS, Apache Hadoop, http://hadoop.apache.org/docs/c -urrent/hadoop-project-dist/hadoop-hdfs/CentralizedCacheManagement.html
[12]Determine YARN and MapReduce Memory Configuration Settings, Hortonworks, http://docs.hortonworks.com/HDPDocuments/HDP2/HDP2.0.8.0/bk_installing_manually_book -/con -tent/rpm-chap1-11.html
[13]Pavlo, A., Paulson, E., Rasin, A., Abadi, D., DeWitt, D., Madden, S., Stonebraker, M. A Comparison of Approaches to Large-Scale Data Analysis. In SIGMOD, 2009
[14]Zhang, J., Wu, G., Hu, X., Wu, X. A Distributed Cache for Hadoop Distributed File System in Real-time Cloud Services. In 2012 ACM/IEEE 13th Internaltional Conference on Grid Computing (GRID), 2012.
[15]WD Caviar Blue Desktop Hard Drives, a Western Diginal company, http://www.wdc.com/wdpr -oducts/library/SpecSheet/ENG/2879-701277.pdf
[16]Memcached, Memecached, http://memcached.org/
[17]Hong-Tai Chou and David J. Dewitt. An Evaluation of Buffer Management Strategies for Relational Database Systems. In VLDB, 1995