Why is Access to Basic Services Not
Inclusive? A Synthesis with a Special
Focus on Developing Asia
Wan, Guanghua and Francisco, Ruth
Asian Development Bank
April 2009
Online at
https://mpra.ub.uni-muenchen.de/18861/
How is the Global Recession Impacting on Poverty and
Social Spending?
An ex ante assessment methodology with applications to developing Asia
Guanghua Wan and Ruth Francisco
No. 8 | August 2009
How Is the Global Recession Impacting on Poverty and
Social Spending?
An ex ante assessment methodology with applications to
developing Asia
Guanghua Wan and Ruth Francisco
No. 8 August 2009
Guanghua Wan is Senior Economist in the Regional and Sustainable Development Department of the Asian Development Bank..
1550 Metro Manila, Philippines www.adb.org
© 2009 by Asian Development Bank August 2009
Publication Stock No. WPS090825 ISSN ISSN 2071-9450
The views expressed in this paper are those of the author and do not necessarily reflect the views or policies of the Asian Development Bank.
ADB does not guarantee the accuracy of the data included in this publication and accepts no responsibility for any consequence of their use.
By making any designation of or reference to a particular territory or geographic area, or by using the term "country" in this document, ADB does not intend to make any
judgments as to the legal or other status of any territory or area.
The authors would like to thank Xianbin Yao (Director General, Regional Sustainable Development Department), Bart Edes (Director, Gender, Social Development, and Civil Society), Shiladitya Chatterjee (Advisor, Strategy and Policy Department), Rana Hasan and Douglas Brooks (Principal Economists, Economics and Research Department), Tun Lin (Economist, East Asia Department), and other ADB colleagues for helpful comments and suggestions.
This working paper series is maintained by the Regional and Sustainable Development Department. Other ADB working paper series are on economics, regional cooperation, and ADBI Working Paper Series. Further ADB Publications can be found at
2. Transmission Mechanism of the Current Crisis 2
3. Research Framework 4
4. Social Impact of the Crisis 6
5. Summary and Suggestions for Further Research 16
References 17
Appendixes
A. Interrelationship between poverty, economic growth, and income inequality 18 B. Long- and short-run relationships between social spending and
economic growth 25
C. EIU and ADO 2009 growth projections 29
List of Figure and Tables Figure
2.1. Transmission mechanism of the current crisis Tables
2.1. Projected real GDP growth (%), World and G3 countries (2008–2011) 3.1. Real GDP growth and income shock due to the current crisis
4.1. Estimated and projected unemployment rate (%) and average real wages (annual change,%), selected Asian countries (2007–2010) 4.2a. Annual change (%) in poverty head count ratio ($1.25 and $2 PPP a day),
projections based on baseline and revised GDP per capita projections, selected Asian countries (2007–2010)
4.2b. Poverty head count ratio ($1.25 PPP a day), actual and projections based on baseline and revised GDP per capita projections, selected Asian countries (2005, 2008–2010)
4.3 Projected annual change in health and education spending, 2008–2010 4.4. Cumulative and short-run crisis impacts on public health and public education
Originated from the United States (US), the subprime mortgage crisis began to affect the finance sector in February 2007 (http://en.wikipedia.org/wiki/Subprime_mortgage_crisis). The financial crisis in the US quickly spread to Europe in 2007/2008. It has blown into a full-scale global economic recession since late 2008, which is expected to last until 2010. When any crisis strikes, whether a natural disaster or an economic recession, two
immediate tasks are to evaluate the extent of damage or conduct an impact assessment, and to put forward measures to contain the crisis or mitigate its impacts.
Systematic assessment of the social impact of an economic crisis involves
understanding several rounds of impacts. First is the impact of an economic crisis on income. At the national level, income reduction could be due to lower demand for goods and services, rising unemployment, and reduced investment or remittances. At the household level, crisis is a negative shock to income, largely from the depreciation in the value of assets, job losses, lower remittances, and possibly inflation. Second, income reduction inevitably translates into consumption cuts, being private or public spending on education, health, even food and other items. Both income reduction and spending cuts are most likely to cause increases in both income poverty and non-income poverty. Third and as a consequence, particularly if hunger is a result, the social fabric would be
damaged, potentially leading to disorder, social unrest, environmental degradation, and so on.
This paper aims to assess the impacts of the current recession on poverty and social spending in developing Asia. In other words, the paper focuses on the second round of impacts. As the crisis is still ongoing, our analysis is inevitably ex ante in nature. The ex ante assessment is important for several reasons. First, the assessment can be timely and can produce findings and insights for swift policy actions before further damages are made by the crisis. Second, the assessment can help prioritize policy actions. As shown later in the paper, the estimated crisis impact is much larger on health than on education. Thus, protecting the health sector during the crisis should be a priority for governments and development partners in Asia. Finally, the assessment in this paper relies on a simple but rigorous analytical framework. Thus, our analytical results can be easily replicated or updated and can supplement those based on different research techniques.
As is well known, conducting an impact assessment is a rather difficult task. One approach is to make inferences from historical analysis of similar crises or from case studies. For example, to understand the impacts of the ongoing crisis in developing Asia, one can retrospectively examine the impacts of the 1997 East Asian financial crisis (Wan and Francisco 2009). The case study method can also be employed to investigate, say, how the ongoing crisis affects the garment industry in Cambodia. These, by and large, are ex post analyses. Ex ante assessment of the crisis impacts is even more challenging. A recent paper by Hasan et al. (2009) estimated the poverty impact of economic
growth of gross domestic product (GDP) per capita in 2008, 2009, and 2010 than the growth in 2007.
In this paper, a simple and yet rigorous approach will be proposed and applied to crisis impact assessment. It involves construction of counterfactuals: poverty and spending scenarios in 2009 and 2010 with and without the crisis. Such counterfactuals are
obtained by using credible growth projections with and without the crisis (see Section 3.1 for details). These, when combined with growth elasticities of poverty and social
spending (see Section 3.2 and Appendix A for details), naturally yield the poverty and social spending scenarios with and without the crisis.
It is useful to point out several caveats of this paper. First, our impact assessments rely on the growth projections of the Economic Intelligence Unit (EIU). Thus, any errors and biases in the projections will carry over to our analytical results. Second, as in Chen and Ravallion (2009), we only estimate the aggregate impacts of the crisis, not the impacts at the household level. Needless to say, the latter are valuable for the design and
implementation of relevant policies. Finally, despite their importance, the non-income dimensions of poverty, such as school participation, hunger and malnutrition, and gender issues, are not considered in this paper.
The paper is structured as follows. Section 2 presents a brief overview of the crisis-impact transmission mechanism, which provides the foundation for the analytical framework of the paper. The methodology of ex ante impact assessment and data issues are discussed in Section 3. It is worth emphasizing that the methodology makes full use of data that are already available. Section 4 presents findings regarding the crisis impacts on poverty and social spending and discusses policy implications. The final section summarizes the paper.
2. Transmission Mechanism of the Current Crisis
Economic crises differ in terms of origin, scope, and consequences. Without
understanding the transmission mechanism, it would be difficult to establish the link between the crisis and socioeconomic indicators such as poverty and spending on education or health. From this perspective, a discussion on the transmission mechanism is useful.
Figure. 2.1. Transmission mechanism of the current crisis
Source: Authors’ illustration.
It is clear that in the absence of government interventions, the extent of the crisis impacts on social spending and poverty is mainly and ultimately determined by the degree of global slowdown. As the most damaging crisis since the Great Depression, the current recession means that all industrialized economies are shrinking and are
[image:9.612.90.529.448.544.2]expected to experience negative growth in 2009. To illustrate the extent of damage due to the crisis, growth projections for the US, Japan, and the Euro zone are tabulated in Table 2.1. Obviously, recent projections are far lower than the baseline projections made at the onset of the present crisis.
Table 2.1 Projected real GDP growth (%), World and G3 countries (2008–2011)
2008 2009 2010 2011
Projection Actual Baseline Latest Baseline Latest Baseline Latest
World 3.5 3.1 3.4 -1.5 3.3 2.0 3.2 3.5
United States 2.4 1.1 2.7 -3.1 2.7 0.7 2.7 1.5
Japan 2.2 -0.7 1.8 -5.9 1.3 0.2 1.7 1.0
Euro zone 2.2 0.7 2.2 -3.4 2.1 -0.3 2.0 1.2
Note: All baseline projections were released in August 2007 and the latest and/or revised projections were released in April 2009.
Source: Economic Intelligence Unit Country Forecasts (August 2007 and April 2009). Available at www.eiu.com (accessed last 2 April 2009).
It is important to note that, as Figure 2.1 makes it clear, no matter how crises may differ from each other, in the end they all boil down to income contractions at the aggregate and household or individual levels. Therefore, it is possible to assess crisis impacts as long as the extent of income reductions caused by a crisis can be measured and the relationship between income and poverty and social spending can be obtained.
Foreign direct investment (FDI) Remittances Financial markets and others Economic growth in developing Asia Trade in goods & services HH spending on basic education & health HH income and employment Poverty incidence Supply of basic public services Global economic slowdown Government spending on
public services educ
3. Research Framework
As mentioned in the Introduction, assessing the poverty and social spending impacts of the current recession involves two steps: (i) obtaining the crisis impact on income, and (ii) estimating income effects on poverty and social spending.
3.1. The crisis impact on income
In reality, observations on crisis-led changes in income are not available ex ante. However, projections of income with and without the crisis can be obtained through a number of ways. For instance, income multipliers could be used to estimate the income changes in developing Asian countries due to income changes in crisis-affected
economies. Alternatively, output changes could be ascertained by using output
multipliers. However, these require detailed information on income and output changes due to crisis in the affected economies.
A more straightforward approach is to use GDP growth projections with and without the crisis in lieu of actual changes in GDP growth. The latest GDP growth projections for 2009 and 2010 could represent the income scenarios with the crisis. Meanwhile,
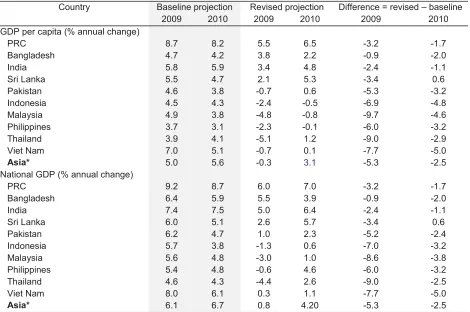
baseline GDP projections for 2009 and 2010 that were released just before the onset of the crisis can approximate the income scenario without the crisis. The differences between the baseline and the latest projections can be taken as the estimates of the income shock due to the crisis. Table 3.1 tabulates the baseline and revised and/or latest growth projections for selected Asian economies by the Economic Intelligence Unit (EIU). Income shocks due to the economic recession are shown in the last two columns.
EIU’s growth projections are used instead of those from the Asian Development Outlook
(ADO). This is largely because EIU’s projections permit social impact assessments for
both 2009 and 2010. Unlike the ADO, EIU provides baseline projections for both years. As expected by many and as shown in Table 3.1, the impact of the current recession on income is expected to last beyond 2009. Many Asian economies are likely to experience slower or even negative growth in 2010. As a consequence, disregarding the 2010 picture would mean gross underestimation of the social impact of the crisis. In contrast, the ADO is published annually. To be more specific, the baseline period of 2009 EIU projections is at the onset of the crisis (September and October 2007), while the
baseline period of the 2009 ADO projections is April 2008 (more than 6 months into the credit squeeze). Quite likely the 2009 ADO projections are contaminated with crisis impacts. (See Appendix C for a comparison of ADB’s and EIU’s 2009 baseline and latest
Table 3.1 Real GDP growth and income shock due to the current crisis
Country Baseline projection Revised projection Difference = revised – baseline
2009 2010 2009 2010 2009 2010
GDP per capita (% annual change)
PRC 8.7 8.2 5.5 6.5 -3.2 -1.7
Bangladesh 4.7 4.2 3.8 2.2 -0.9 -2.0
India 5.8 5.9 3.4 4.8 -2.4 -1.1
Sri Lanka 5.5 4.7 2.1 5.3 -3.4 0.6
Pakistan 4.6 3.8 -0.7 0.6 -5.3 -3.2
Indonesia 4.5 4.3 -2.4 -0.5 -6.9 -4.8
Malaysia 4.9 3.8 -4.8 -0.8 -9.7 -4.6
Philippines 3.7 3.1 -2.3 -0.1 -6.0 -3.2
Thailand 3.9 4.1 -5.1 1.2 -9.0 -2.9
Viet Nam 7.0 5.1 -0.7 0.1 -7.7 -5.0
Asia* 5.0 5.6 -0.3 3.1 -5.3 -2.5
National GDP (% annual change)
PRC 9.2 8.7 6.0 7.0 -3.2 -1.7
Bangladesh 6.4 5.9 5.5 3.9 -0.9 -2.0
India 7.4 7.5 5.0 6.4 -2.4 -1.1
Sri Lanka 6.0 5.1 2.6 5.7 -3.4 0.6
Pakistan 6.2 4.7 1.0 2.3 -5.2 -2.4
Indonesia 5.7 3.8 -1.3 0.6 -7.0 -3.2
Malaysia 5.6 4.8 -3.0 1.0 -8.6 -3.8
Philippines 5.4 4.8 -0.6 4.6 -6.0 -3.2
Thailand 4.6 4.3 -4.4 2.6 -9.0 -2.5
Viet Nam 8.0 6.1 0.3 1.1 -7.7 -5.0
Asia* 6.1 6.7 0.8 4.20 -5.3 -2.5
GDP = gross domestic product, PRC = People’s Republic of China.
Note: *Asia includes Asian countries (Bangladesh; PRC; Hong Kong, China; India; Indonesia; Malaysia; Pakistan; Philippines; Singapore; Republic of Korea; Sri Lanka; Taipei,China; Thailand; and Viet Nam) and Australasia (Australia and New Zealand); it excludes Japan. Projections for Asia without Australasia are not available. Numbers may not add up because of rounding. Projections for baseline 2009 were released in September 2007 except Bangladesh (October 2007) and Indonesia (November 2007). Projections for baseline 2010 were released in October 2008. The revised and/or latest projections were released in April 2009.
Source: Economic Intelligence Unit (EIU) Country Forecast. Available at www.eiu.com (accessed last 2 April 2009).
We note that unlike EIU’s 2009 baseline projections, EIU’s 2010 baseline projections
may be contaminated with crisis impacts as these were released only in October 2008. This may cause underestimation of the 2010 impact of the crisis. To our best knowledge,
3.2. Estimating crisis impacts on poverty and social spending
Having obtained the income scenarios with and without the crisis, attention is now turned to gauging how poverty head count and social spending may respond to changes in income. This is conveniently captured by the concept of elasticity of income with respect to poverty and social expenditures. To obtain the poverty elasticity of income, we use
GDP per capita data from the World Bank’s World Development Indicators (WDI) Online
and inequality and poverty head count ratio from the World Bank’s Povcalnet. For social
spending elasticity estimates, we use the GDP data, public and private spending on health, and public spending on education, all available from WDI Online. The data cover annual observations of 2001–2005 for health, and of 1998–2006 for education. For details on the elasticity estimation methodology, see Appendixes A and B.
Based on growth projections of Table 3.1 and the poverty elasticity estimates of Appendix A, we can easily generate and compare two sets of poverty estimates: one using baseline growth projections which yield poverty head count without the crisis, and the other using latest growth projections which yield poverty head count with the crisis. We take the difference between the two sets and interpret this as the poverty impact of the crisis. Similarly, we obtain the crisis impacts on social spending, using the social spending elasticity estimates of Appendix B.
4. Social Impact of the Crisis
Before presenting the crisis impacts on poverty and social spending, it is appropriate to discuss the crisis impacts on wages and employment, as estimated by the EIU.21 These estimates are complementary to our poverty impact estimates.
4.1. Wages and employment
One most visible impact of the current recession is increased unemployment. Such an impact is caused directly by reduced export from Asia, compounded by reduced growth. The well-known Phillips curve portrays an inverse relationship between economic growth and unemployment. Some empirical studies confirm this curve. For example, in the US, unemployment rate drops by 2% for every 1% increase in GDP growth (Mankiw 2003). Reinhart and Rogoff (2008) discovered that severe financial crises in the past had lasting effects on output and employment (Reinhart 2009). On average, these crises led to more than 9% decline in real GDP per capita over 2 years and 7 percentage points increase in unemployment over several years.
In the People’s Republic of China (PRC), fast growth and trade expansion have not only
supported increased employment but also promoted rapid transformation in employment structure, shifting labor to the manufacturing sector (Cai and Wang 2006). Contrary to the normal scenario, agricultural employment contracts during booms and expands
21
Because the growth–employment relationship is beyond the scope of the current paper, the
during recessions. For 1991–1995 and 2001–2005, employment elasticity in agriculture ranged from -0.43 to -0.29. During 1996–2000, on the other hand, the elasticity was 0.09. Employment in the non-agriculture sectors behaves in the usual way. Hence, growth in total employment is sustained even during the second half of the 1990s when GDP growth decelerated. As such, total employment elasticity remained positive for 1991–
1995 (0.08), 1996–2000 (0.14), and 2001–2005 (0.11).
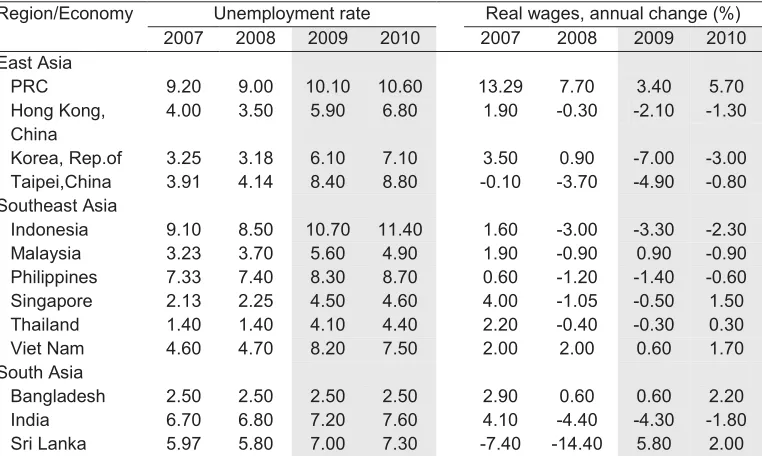
[image:13.612.92.473.351.579.2]Clearly, unemployment rates will increase in many Asian economies as external and internal demands continue to slow down (Table 4.1). Fast-growing East and Southeast Asian economies will suffer the most in terms of unemployment. In addition, real wages are expected to drop further in 2009, after posting negative growth already in 2008 in most Southeast Asian economies. Reductions in real wages from 2007 to 2008 were dramatic for Taipei,China, Sri Lanka, and Pakistan. Unlike in the 1997 crisis, remittances cannot be relied on to compensate for losses in wage and household income because the source countries are badly affected and most Asian currencies have not seen depreciations.
Table 4.1 Estimated and projected unemployment rate (%) and average real wages (annual
change, %), selected Asian countries (2007–2010)
Region/Economy Unemployment rate Real wages, annual change (%) 2007 2008 2009 2010 2007 2008 2009 2010 East Asia
PRC 9.20 9.00 10.10 10.60 13.29 7.70 3.40 5.70 Hong Kong,
China
4.00 3.50 5.90 6.80 1.90 -0.30 -2.10 -1.30
Korea, Rep.of 3.25 3.18 6.10 7.10 3.50 0.90 -7.00 -3.00 Taipei,China 3.91 4.14 8.40 8.80 -0.10 -3.70 -4.90 -0.80 Southeast Asia
Indonesia 9.10 8.50 10.70 11.40 1.60 -3.00 -3.30 -2.30 Malaysia 3.23 3.70 5.60 4.90 1.90 -0.90 0.90 -0.90 Philippines 7.33 7.40 8.30 8.70 0.60 -1.20 -1.40 -0.60 Singapore 2.13 2.25 4.50 4.60 4.00 -1.05 -0.50 1.50 Thailand 1.40 1.40 4.10 4.40 2.20 -0.40 -0.30 0.30 Viet Nam 4.60 4.70 8.20 7.50 2.00 2.00 0.60 1.70 South Asia
Bangladesh 2.50 2.50 2.50 2.50 2.90 0.60 0.60 2.20 India 6.70 6.80 7.20 7.60 4.10 -4.40 -4.30 -1.80 Sri Lanka 5.97 5.80 7.00 7.30 -7.40 -14.40 5.80 2.00
PRC = People’s Republic of China.
Note: 2007 and 2008 are estimates; 2009–2010 are projections.
Source: Economic Intelligence Unit (EIU) database. Available at www.eiu.com (accessed last 2 April 2009).
remained relatively stable due to increased remittance and depreciation of the peso (Wan and Francisco 2009).
4.2. Poverty impact
As our estimates of poverty elasticity of growth show, poverty reduction is significantly and positively related to income growth in developing Asian countries (Appendix Table A5). Thus, slower income growth implies slower poverty reduction while negative growth means increases in poverty incidence. This is also supported by past evidence. During the 1997 Asian crisis, poverty incidence in Indonesia increased by 8.9 percentage points (from 11% to 19.9% in 1998) and by 9 percentage points in the Philippines (Wan and Francisco 2009, Frankenberg et al. 1999, Datt and Hoogeveen 2003).
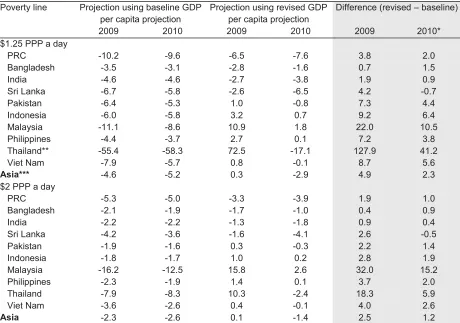
Tables 4.2a and 4.2b present the poverty impact of the current recession. As expected, the crisis will adversely affect poverty reduction in all Asian countries. What is of serious concern is that the recession may cause increases in both 2009 and 2010, in the
absolute number of poor individuals or households in Malaysia,Indonesia, Pakistan, the Philippines, and Thailand. In Indonesia, for instance, poverty incidence is estimated to increase in 2009 by 3.2% over the estimated 17.7% head count ratio of 2008 and further to increase by 0.7% in 2010 over the estimated 18.3% head count ratio of 2009. Hence, the head count ratio is expected to rise from an estimate of only 17.7% (under the $1.25 poverty line) in 2008 to 18.4% in 2010.22
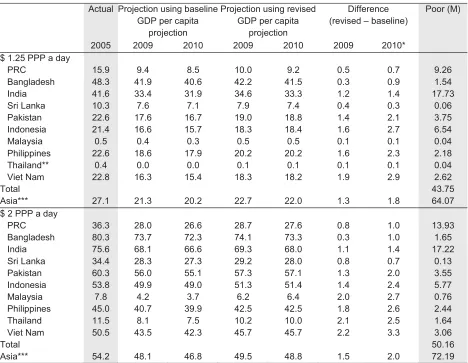
It is more revealing to contrast poverty reduction under the no-crisis scenario with that under-crisis scenario. Poverty incidence in Indonesia, for instance, could be reduced from 21.4% in 2005 to around 15.7% in 2010 in the absence of the recession (Table 4.2b). However, with the foreseen negative growth in 2009 and 2010, the poverty incidence in Indonesia is expected to drop to 18.4% only in 2010, assuming the crisis would not worsen income distribution. This means that Indonesia will forego 2.7% reduction in the head count ratio due to the current crisis. This forgone poverty reduction represents 6.54 million people who will remain or become poor due to the crisis. The foregone poverty reduction is even higher in Viet Nam (2.9%) and slightly lower but still above 2% for both Pakistan and the Philippines. In India, growth is predicted to remain positive in 2009 and 2010. The poverty impact of reduced growth is quite severe. The foregone poverty reduction is estimated to be 1.4%. In other words, almost 18 million Indians who might have stepped out of poverty are expected to remain poor due to the recession.
22
Table 4.2a Annual changes (%) in poverty head count ratio ($1.25 and $2 PPP a day, selected Asian countries)
Poverty line Projection using baseline GDP per capita projection
Projection using revised GDP per capita projection
Difference (revised – baseline)
2009 2010 2009 2010 2009 2010*
$1.25 PPP a day
PRC -10.2 -9.6 -6.5 -7.6 3.8 2.0
Bangladesh -3.5 -3.1 -2.8 -1.6 0.7 1.5
India -4.6 -4.6 -2.7 -3.8 1.9 0.9
Sri Lanka -6.7 -5.8 -2.6 -6.5 4.2 -0.7
Pakistan -6.4 -5.3 1.0 -0.8 7.3 4.4
Indonesia -6.0 -5.8 3.2 0.7 9.2 6.4
Malaysia -11.1 -8.6 10.9 1.8 22.0 10.5
Philippines -4.4 -3.7 2.7 0.1 7.2 3.8
Thailand** -55.4 -58.3 72.5 -17.1 127.9 41.2
Viet Nam -7.9 -5.7 0.8 -0.1 8.7 5.6
Asia*** -4.6 -5.2 0.3 -2.9 4.9 2.3
$2 PPP a day
PRC -5.3 -5.0 -3.3 -3.9 1.9 1.0
Bangladesh -2.1 -1.9 -1.7 -1.0 0.4 0.9
India -2.2 -2.2 -1.3 -1.8 0.9 0.4
Sri Lanka -4.2 -3.6 -1.6 -4.1 2.6 -0.5
Pakistan -1.9 -1.6 0.3 -0.3 2.2 1.4
Indonesia -1.8 -1.7 1.0 0.2 2.8 1.9
Malaysia -16.2 -12.5 15.8 2.6 32.0 15.2
Philippines -2.3 -1.9 1.4 0.1 3.7 2.0
Thailand -7.9 -8.3 10.3 -2.4 18.3 5.9
Viet Nam -3.6 -2.6 0.4 -0.1 4.0 2.6
Asia -2.3 -2.6 0.1 -1.4 2.5 1.2
GDP = gross domestic product, PPP = purchasing power parity, PRC = People’s Republic of China.
Note: Data from Table 3.1 and our poverty elasticity estimates (Annex A1) were used to generate projected changes in head count ratio. Numbers may not add up because of rounding. *2010 estimates may be underestimated since 2010 baseline growth projection may be contaminated with crisis impact (see Section 3.1 for more details). **Values for Thailand ($1.25 poverty line) may not be reliable since the head count ratio for Thailand is close to zero. ***Asia includes all 21 countries where poverty elasticity estimate is available (Annex A1).
Table 4.2b Poverty head count ratio ($1.25 and $2 PPP a day), actual and projections based on baseline and revised GDP per capita projections, selected Asian countries (2005, 2008–2010)
Actual Projection using baseline GDP per capita
projection
Projection using revised GDP per capita
projection
Difference (revised – baseline)
Poor (M)
2005 2009 2010 2009 2010 2009 2010*
$ 1.25 PPP a day
PRC 15.9 9.4 8.5 10.0 9.2 0.5 0.7 9.26
Bangladesh 48.3 41.9 40.6 42.2 41.5 0.3 0.9 1.54
India 41.6 33.4 31.9 34.6 33.3 1.2 1.4 17.73
Sri Lanka 10.3 7.6 7.1 7.9 7.4 0.4 0.3 0.06
Pakistan 22.6 17.6 16.7 19.0 18.8 1.4 2.1 3.75
Indonesia 21.4 16.6 15.7 18.3 18.4 1.6 2.7 6.54
Malaysia 0.5 0.4 0.3 0.5 0.5 0.1 0.1 0.04
Philippines 22.6 18.6 17.9 20.2 20.2 1.6 2.3 2.18
Thailand** 0.4 0.0 0.0 0.1 0.1 0.1 0.1 0.04
Viet Nam 22.8 16.3 15.4 18.3 18.2 1.9 2.9 2.62
Total 43.75
Asia*** 27.1 21.3 20.2 22.7 22.0 1.3 1.8 64.07
$ 2 PPP a day
PRC 36.3 28.0 26.6 28.7 27.6 0.8 1.0 13.93
Bangladesh 80.3 73.7 72.3 74.1 73.3 0.3 1.0 1.65
India 75.6 68.1 66.6 69.3 68.0 1.1 1.4 17.22
Sri Lanka 34.4 28.3 27.3 29.2 28.0 0.8 0.7 0.13
Pakistan 60.3 56.0 55.1 57.3 57.1 1.3 2.0 3.55
Indonesia 53.8 49.9 49.0 51.3 51.4 1.4 2.4 5.77
Malaysia 7.8 4.2 3.7 6.2 6.4 2.0 2.7 0.76
Philippines 45.0 40.7 39.9 42.5 42.5 1.8 2.6 2.44
Thailand 11.5 8.1 7.5 10.2 10.0 2.1 2.5 1.64
Viet Nam 50.5 43.5 42.3 45.7 45.7 2.2 3.3 3.06
Total 50.16
Asia*** 54.2 48.1 46.8 49.5 48.8 1.5 2.0 72.19
GDP = gross domestic product, PPP = purchasing power parity, PRC = People’s Republic of China.
Note: Estimates of poverty head count ratios were derived using estimated changes in poverty head count presented in Table 4.2a and 2005 actual head count ratio. The number of poor population affected by the crisis was estimated using the difference between baseline and revised projected 2010 head count ratios and 2010 population projection by UN Population Division in World Population Prospects: the 2008 Revision (available at: http://esa.un.org/unpp/, accessed last 8 April 2009) for the countries mentioned above. Numbers may not add up because of rounding. *2010 estimates may be underestimated since 2010 baseline growth projection may be contaminated with crisis impact (see Section 3.1 for more details). **Values for Thailand ($1.25 poverty line) may not be reliable since the head count for Thailand is close to zero. ***Asia includes all 21 countries where poverty elasticity estimate is available (Annex A1).
Source: Authors’ estimates.
those implicitly suggested by Chen and Ravallion (2009). They employed a similar ex ante assessment approach and produced estimates of 73 million and 91 million for the world (versus our estimates of 64 million and 72 million for Asia). It is noted that global poverty is concentrated in Asia and Africa but the crisis impact on Africa is relatively mild.
So far the estimation results presented in this section are obtained under the assumption of distribution-neutral growth. It is important to note that since the poverty elasticity of inequality is positive, if the current recession causes inequality to rise, the actual poverty picture may well be more severe than these results suggest. Based on our elasticity estimates, for every one percentage point rise in inequality (as measured by the Gini coefficient), the head count ratios in developing Asia under $1.25 and $2 PPP/day are expected to increase by 0.36 and 0.11 percentage points respectively (or in absolute numbers, 13 million and 3.4 million more poor). Alternatively, if inequality declines by 1% during 2009–2010, 13 million extremely poor and 3.4 million moderately poor in Asia will be lifted out of poverty.
4.3. Impacts on education and health spending
Appendix B presents and discusses short- and long- run estimates of spending elasticity of growth for health and education expenditures. As shown in Table B1 of Appendix B, a 1% increase or decrease in per capita GDP growth in year 1 translates into 0.5%–0.8% increase or decrease in per capita private health spending, 0.5%–0.7% increase or decrease in per capita public health spending, and 0.3%–0.5% increase or decrease in per capita public education spending in year 1. Clearly, the instant impact of the crisis on private health spending is larger than that on public health spending, and health
spending is more responsive to crisis than education spending in the very short run.
The reduction in social spending in year 1 will, in turn, affect social spending in
subsequent years as shown in Table B2 of Appendix B. Specifically, a 1% increase or decrease in per capita GDP growth in year 1 translates into a 0.19%–0.31% increase or decrease in per capita private health spending, 0.18%–0.25% increase or decrease in per capita public health spending, and 0.18%–0.27% increase or decrease in per capita public education spending in year 2. By the same token, the impacts for year 3 of the first year change will be a 0.07%–0.11% increase or decrease in per capita private health spending, 0.07%–0.09% increase or decrease in per capita public health spending, and 0.09%–0.14% increase or decrease in per capita public education
spending. The impacts of the change in per capita GDP growth in year 1 will continue in subsequent years, albeit at an increasingly limited pace than in previous years. In the long run, the 1% increase or decrease in per capita GDP growth in year 1 translates into a total of 0.8%–1.3% increase or decrease in per capita private health spending, 0.8%–
Table 4.3 presents projected annual growth in health and education spending in 2009 and 2010 with and without the recession. It shows that per capita private health spending is expected to drop from its 2008 level in Thailand (by -2.9%), Malaysia (-2.9%), Indonesia (-1.3%), the Philippines (-1.3%), and Pakistan (-0.4%). (See rows under the heading of "Difference (b) - (a)” in Table 4.3.) However, for many Asian countries, despite the recession, health and education expenditures are expected to continue to expand in 2009 and 2010, albeit at a limited pace (see rows under the heading of “% annual change, revised (b)” in Table 4.3). Clearly, the crisis is expected to exert negative impacts on social spending that are substantial in many developing Asian countries. In Malaysia, for instance, the reduction in per capita private health spending over 2008–2009 amounts to almost 6 percentage points. In addition, Malaysia is
expected to lose 2.8% increase in per capita private health spending from 2009 to 2010, if no appropriate protection program is implemented. In terms of per capita public health spending, the difference amounts to 6.6 percentage points over 2008–2009 and 3.1 percentage points over 2009–2010.23
From 2008 to 2009, the short-run crisis impact on per capita private health spending is most serious for Malaysia (-5.8 percentage points loss in spending growth), followed by Thailand (-5.1 percentage points), and Viet Nam (-5.7 percentage points). From 2009 to 2010, the loss is quite high in Viet Nam (-3.7 percentage points loss), Malaysia (-2.8 percentage points), and Indonesia (-2.6% percentage points). Turning to public health spending, the short-run crisis impact is most serious in Malaysia from 2008 to 2009 and from 2009 to 2010 (-6.6 and -3.1 percentage points losses, respectively). In terms of per capita public education expenditure, the negative short-run crisis impact is highest in Malaysia over 2008–2009 and 2009–2010 (-4.6 and -2.9 percentage points,
respectively).
Although health spending is more responsive to income changes, the short-run impact of the crisis in terms of absolute value is larger on education than on health spending. This is because the public education budget is usually much larger than health budget. As a consequence, the ratio of forgone increases in per capita public education spending to per capita public health due to the recession is around 1.2 in the case of the Philippines and 3 in the case of Pakistan.
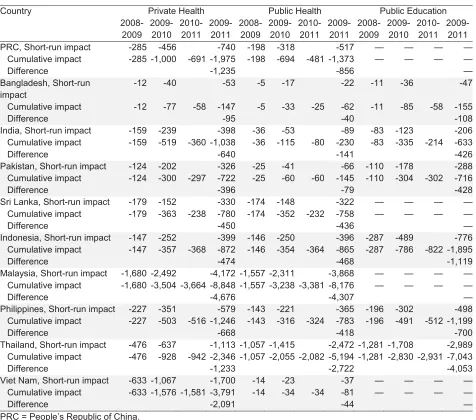
So far, attention has been mainly focused on the short-run impacts of the recession. While policy makers seem to be often interested more in the short-run impacts, it is important to point out that the crisis impacts in the long-run are larger than that in the short-run, as indicated by our elasticity estimates (see Appendix B for more details). Table 4.4 compares the short-run versus cumulative crisis impact on per capita social spending from 2009 to 2011. Whereas the short-run impact accounts for the GDP shocks that occurred in the same year only, the cumulative impact accounts for the lagged impact of the GDP shock that occurred in the previous year(s) in addition to the
23
Table 4.3 Projected annual change in per capita health and education spending, 2008–2010
Private Health Public Health Public Education 2005 2009 2010 2005 2009 2010 2005 2009 2010
PRC, actual $ PPP 11,774 7,455
% annual change, baseline (a) 5.43 5.11 5.88 5.54 — 3.44 3.24 % annual change, revised (b) 3.43 4.05 3.71 4.39 2.17 2.57
Difference (b) - (a) -2.00 -1.06 -2.16 -1.15 -1.27 -0.67
Difference, $ PPP -285 -456 -198 -318 — —
Bangladesh, actual $ PPP 2,126 870 2,916
% annual change, baseline (a) 2.77 2.48 2.88 2.57 1.87 1.67 % annual change, revised (b) 2.24 1.30 2.32 1.35 1.51 0.87
Difference (b) - (a) -0.53 -1.18 -0.55 -1.22 -0.36 -0.79
Difference, $ PPP -12 -40 -5 -17 -11 -36
India, actual $ PPP 9,031 2,118 7,247
% annual change, baseline (a) 3.75 3.82 3.60 3.66 2.54 2.58 % annual change, revised (b) 2.20 3.11 2.11 2.98 1.49 2.10
Difference (b) - (a) -1.55 -0.71 -1.49 -0.68 -1.05 -0.48
Difference, $ PPP -159 -239 -36 -53 -83 -123
Pakistan, actual $ PPP 3,779 803 4,915
% annual change, baseline (a) 2.66 2.19 2.54 2.10 1.85 1.53 % annual change, revised (b) -0.40 0.35 -0.39 0.33 -0.28 0.24
Difference (b) - (a) -3.06 -1.85 -2.93 -1.77 -2.13 -1.29
Difference, $ PPP -124 -202 -25 -41 -110 -178
Sri Lanka, actual $ PPP 7,836 6,717 —
% annual change, baseline (a) 3.30 2.82 3.70 3.16 — —
% annual change, revised (b) 1.26 3.18 1.41 3.57 — —
Difference (b) - (a) -2.04 0.36 -2.29 0.40 — —
Difference, $ PPP -179 -152 -174 -148 — —
Indonesia, actual $ PPP 3,595 3,141 9,179
% annual change, baseline (a) 2.47 2.36 2.79 2.66 1.92 1.83 % annual change, revised (b) -1.32 -0.27 -1.49 -0.31 -1.02 -0.21
Difference (b) - (a) -3.79 -2.64 -4.27 -2.97 -2.94 -2.05
Difference, $ PPP -147 -252 -146 -250 -287 -489
Malaysia, actual $ PPP 27,094 21,974 —
% annual change, baseline (a) 2.94 2.28 3.33 2.58 2.34 1.81 % annual change, revised (b) -2.88 -0.48 -3.27 -0.54 -2.29 -0.38
Difference (b) - (a) -5.82 -2.76 -6.60 -3.13 -4.63 -2.19
Difference, $ PPP -1,680 -2,492 -1,557 -2,311 — —
Philippines, actual $ PPP 6,000 3,462 7,508
% annual change, baseline (a) 2.18 1.83 2.37 1.99 1.54 1.29 % annual change, revised (b) -1.36 -0.06 -1.47 -0.06 -0.95 -0.04
Difference (b) - (a) -3.54 -1.89 -3.85 -2.05 -2.49 -1.33
Difference, $ PPP -227 -351 -143 -221 -196 -302
Thailand, actual $ PPP 8,907 15,810 29,902
% annual change, baseline (a) 2.19 2.30 2.70 2.84 1.77 1.86 % annual change, revised (b) -2.86 0.67 -3.53 0.83 -2.32 0.55
Difference (b) - (a) -5.05 -1.63 -6.23 -2.01 -4.09 -1.32
Difference, $ PPP -476 -637 -1,057 -1,415 -1,281 -1,708
Viet Nam, actual $ PPP 9,557 3,304 —
% annual change, baseline (a) 5.22 3.80 0.38 0.28 7.48 5.45 % annual change, revised (b) -0.52 0.07 -0.04 0.01 -0.75 0.11
Difference (b) - (a) -5.74 -3.73 -0.42 -0.27 -8.23 -5.35
PPP = purchasing power parity , PRC = People’s Republic of China.
Note: “–“ 2005 data unavailable in WDI Online. *2010 impacts are likely to be underestimated since 2010 baseline growth projection may be contaminated with crisis impact (see Section 3.1 for more details).
[image:21.612.90.566.186.606.2]Source: Authors’ estimates.
Table 4.4 Projected annual change and cumulative annual change in per capita health and
education spending, 2008–2011*
Country Private Health Public Health Public Education
2008-2009 2009-2010 2010-2011 2009-2011 2008-2009 2009-2010 2010-2011 2009-2011 2008-2009 2009-2010 2010-2011 2009-2011
PRC, Short-run impact -285 -456 -740 -198 -318 -517 — — — —
Cumulative impact -285 -1,000 -691 -1,975 -198 -694 -481 -1,373 — — — —
Difference -1,235 -856 —
Bangladesh, Short-run impact
-12 -40 -53 -5 -17 -22 -11 -36 -47
Cumulative impact -12 -77 -58 -147 -5 -33 -25 -62 -11 -85 -58 -155
Difference -95 -40 -108
India, Short-run impact -159 -239 -398 -36 -53 -89 -83 -123 -206 Cumulative impact -159 -519 -360 -1,038 -36 -115 -80 -230 -83 -335 -214 -633
Difference -640 -141 -426
Pakistan, Short-run impact -124 -202 -326 -25 -41 -66 -110 -178 -288 Cumulative impact -124 -300 -297 -722 -25 -60 -60 -145 -110 -304 -302 -716
Difference -396 -79 -428
Sri Lanka, Short-run impact -179 -152 -330 -174 -148 -322 — — — —
Cumulative impact -179 -363 -238 -780 -174 -352 -232 -758 — — — —
Difference -450 -436 —
Indonesia, Short-run impact -147 -252 -399 -146 -250 -396 -287 -489 -776 Cumulative impact -147 -357 -368 -872 -146 -354 -364 -865 -287 -786 -822 -1,895
Difference -474 -468 -1,119
Malaysia, Short-run impact -1,680 -2,492 -4,172 -1,557 -2,311 -3,868 — — — —
Cumulative impact -1,680 -3,504 -3,664 -8,848 -1,557 -3,238 -3,381 -8,176 — — — —
Difference -4,676 -4,307 —
Philippines, Short-run impact -227 -351 -579 -143 -221 -365 -196 -302 -498 Cumulative impact -227 -503 -516 -1,246 -143 -316 -324 -783 -196 -491 -512 -1,199
Difference -668 -418 -700
Thailand, Short-run impact -476 -637 -1,113 -1,057 -1,415 -2,472 -1,281 -1,708 -2,989 Cumulative impact -476 -928 -942 -2,346 -1,057 -2,055 -2,082 -5,194 -1,281 -2,830 -2,931 -7,043
Difference -1,233 -2,722 -4,053
Viet Nam, Short-run impact -633 -1,067 -1,700 -14 -23 -37 — — — —
Cumulative impact -633 -1,576 -1,581 -3,791 -14 -34 -34 -81 — — — —
Difference -2,091 -44 —
PRC = People’s Republic of China.
Notes: Short-run impact equals short-run elasticity times the change in GDP. Cumulative impact equals the sum of the short-run impact in year t and the spillover effects of the changes in spending in year t-1. See Appendix B for more details about estimation procedure; and Appendix Table B1 for elasticity estimates. “– “ data in actual 2005 levels not available in WDI Online.
5. Summary and Suggestions for Further Research
This paper presents a simple and practical yet novel methodology for ex ante
assessment of the crisis impact. It is built on reliable income growth projections with and without the crisis and various estimates of elasticity of income. This methodology allows timely assessment of economic and social impacts of the ongoing crisis, which is crucial in formulating evidenced-based policies to mitigate the impact of the crisis.
As expected, the current crisis is found to negatively impact employment, poverty, and social spending. Based on the analytical results of this paper, the following messages stand out as important and interesting:
x First, the current crisis will adversely affect poverty reduction. In developing Asian countries alone, a total of 64 million people who could have stepped out of poverty will remain below the $1.25 PPP /day poverty line due to the crisis. An additional 8 million will remain below the $2 PPP /day poverty line.
x Second, spending on health in Asia is much more responsive to crisis than that on education, both in the short-run and long-run. Thus, policy interventions and donor assistances for crisis management should prioritize heath, relative to education.
x Third, the impacts of crises differ considerably from country to country and from sector to sector. Therefore, one size does not fit all and interventions by national
governments and international agencies must be country and sector specific.
x Fourth, most developing countries in Asia are expected to continue their increases in overall social spending in 2009, although such increases, driven by positive but
reduced GDP growth, would have been larger if the crisis did not occur. In other words, the crucially needed optimism or confidence is justified and should be conveyed to the general public and business community.
x Finally, the long-run impacts of the current crisis are not negligible and deserve serious policy considerations and further research efforts.
References:
Asian Development Bank (ADB). 2008. Asian Development Outlook 2009: Rebalancing Asia’s
Growth. Manila, Philippines: ADB.
Cai F., and D. Wang. 2006. Employment growth, labour scarcity and the nature of China’s trade
expansion. In R. Garnaut, and S.Ligang (eds.), The Turning Point in China’s Economic
Development. Asia Pacific Press and ANU E Press.
Chen, S., and M. Ravallion. 2009. The impact of the global financial crisis on the world’s poorest. Available at www.voxeu.org/index.php?q=node/3520.
Datt, G., and H. Hoogeveen. 2003. El Niño or El Peso? Crisis, poverty and income distribution in the Philippines. World Development (Economic Crises, Natural Disasters, and Poverty),
31(7):1103–1124.
Frankenberg, E., D. Thomas, and K. Beegle. 1999a. The real costs of Indonesia's economic crisis: preliminary findings from the Indonesia Family Life Surveys. RAND Labor and Population
Program Working Paper Series 99-04
Hasan, R., MR Magsombol, and JS Cain. 2009. Poverty impact of the economic slowdown in developing Asia: Some scenarios. ADB Economics Working Paper Series No. 153.
Mankiw, NG. 2003. Fundamentals of Microeconomics. 3rd ed. USA: South-Western College Publishing.
Qin, D., MA Cagas, P. Quising, and XH He. 2006 How much does investment drive economic growth in China?. Journal of Policy Modeling, 28(7): 751–774.
Reinhart, CM. 2009. The economic and fiscal consequences of financial crises. Vox. Available at www.voxeu.org/index.php?q=node/2877
Reinhart, CM, and KS Rogoff. 2008. Is the 2007 US Sub-Prime financial crisis so different? An international historical comparison. The American Economic Review. 98(2): 339–344.
United Nations Conference on Trade and Development (UNCTAD). 2008. World Investment Report, 2008.
Wan, GH, and R. Francisco. 2009. Short-run and Long-run Impacts of the Global Economic Crisis: the Case of Asia. Unpublished draft.
Appendix A. Interrelationship between poverty, economic growth, and income inequality
While poverty and economic growth are negatively correlated, the relationship between income inequality and poverty is positive. Whether economic growth can lead to poverty reduction or not depends on the relative magnitudes of the growth and inequality effects on poverty (Ravallion and Chen 1997, Kakwani and Pernia 2000). These magnitudes are partially determined by the growth and inequality elasticities of poverty.
Previous estimates
Various methodologies are available for obtaining the growth or inequality elasticity. Kakwani (1993) proposed the following formula for estimating the poverty elasticity of growth
K
HG, based on the Foster, Greer, and Thorbecke (1984) poverty measure:where H is head count ratio, G is income, PG is poverty gap, SP is squared poverty gap, and D is the index of inequality aversion.24
An alternative approach is given by Ravallion (1997), who developed a distribution-corrected poverty elasticity of growth, which can be estimated by running the following OLS regression:
h E(1I)gP
(A2)
where
h
'
H
/
H
is the rate of change in poverty incidence, I indicates income inequality, andg 'G/G is the rate of change in average household income. The distribution-corrected poverty elasticity of growth is
KHG = E(1I) (A3)
Equation (A3) implies that countries with higher initial inequality would have slower rate of poverty reduction for every 1% increase in average household income. Ravallion fitted (A2) to household survey data (two spells) from 23 developing countries, and found that the
E
estimate is 4.43 (t-ratio = 4.7, R2 = 0.36).In a highly controversial paper, Dollar and Kraay (2002) examined the poverty–growth relationship using 1950–1999 data from 137 countries. Relying on the standard generalized method of moments (GMM) procedure, they estimated the following system of equations:
24
Kakwani proposed an inequality–growth trade-off index (IGTI), defined as IGTI = |KHG/KHI| where the denominator is inequality elasticity of poverty. It measures how much growth in mean income (or expenditure) is required to offset a 1% increase in inequality, holding poverty constant.
wH
wG G
H =
K
HG =(HPG) PG
if
(D= 1)
(A1)
2(PGSP)
Git P
E
0
E
1GitE
2XitP
iQ
it (A4)G
itPG
iP,tk(c,t)E
1(
G
itG
i,tk(c,t))
E
2(
X
itG
i,tk(c,t))
(Q
itQ
i,tk(c,t))
(A5)where GPis the income of the poorest income quintile and
X
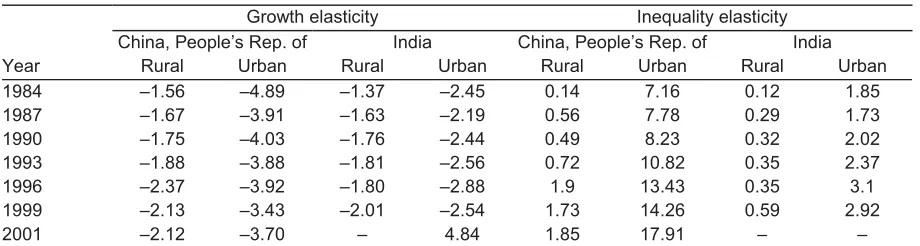
are a set of control variables. Based on the fitted model, (wGP /GP) / (wG/G)= 1.07, meaning that for every 1% increase in the national average income, the poor gains 1.07%. They claimed that this finding holds across regions, time periods, income levels, and growth rates.Using the methodology proposed by Kakwani (1993), Son and Kakwani (2004) estimated poverty elasticity of growth for selected Asian countries under three growth scenarios (Table A1). Son (2007) expanded the earlier work to include 1981 – 2001 data from 17 Asian countries. India’s
[image:25.612.89.543.310.470.2]and the People’s Republic of China's poverty elasticity of growth and of inequality from Son (2007) are reproduced in Table A2 below.
Table A1. Growth elasticity of poverty
Scenario (1) Pro-poor growth (2) Neutral growth (3) Pro-rich growth Country ($ 1 PPP/day) ($ 2 PPP/day) ($ 1 PPP/day) ($ 2 PPP/day) ($ 1 PPP/day) ($ 2 PPP/day)
PRC -3 -1.1 -2.2 -1 -1.5 -0.9
Indonesia -3.3 -1.3 -2.4 -1.1 -1.5 -0.9
Korea -9.8 -6.1 -5.4 -3.8 -1.3 -1.7
Malaysia -3.5 -2 -1.9 -1.3 -0.5 -0.6
Philippines -2.9 -1.4 -1.8 -1.1 -0.9 -0.7
Thailand -3.3 -1.7 -1.9 -1.2 -0.7 -0.7
Bangladesh -3 -0.8 -2.3 -0.8 -1.8 -0.8
India -2.2 -0.6 -1.8 -0.6 -1.4 -0.6
Nepal -2.5 -0.8 -1.9 -0.7 -1.4 -0.7
Pakistan -2 -0.6 -1.6 -0.6 -1.2 -0.6
Sri Lanka -5.7 -2.5 -3.8 -2 -2.1 -1.5
PPP = purchasing power parity, PRC = People’s Republic of China.
Source: Son and Kakwani 2004.
Table A2. Poverty elasticity* for India and the People’s Republic of China (1984–2001)
Growth elasticity Inequality elasticity
China, People’s Rep. of India China, People’s Rep. of India
Year Rural Urban Rural Urban Rural Urban Rural Urban
1984 –1.56 –4.89 –1.37 –2.45 0.14 7.16 0.12 1.85
1987 –1.67 –3.91 –1.63 –2.19 0.56 7.78 0.29 1.73
1990 –1.75 –4.03 –1.76 –2.44 0.49 8.23 0.32 2.02
1993 –1.88 –3.88 –1.81 –2.56 0.72 10.82 0.35 2.37
1996 –2.37 –3.92 –1.80 –2.88 1.9 13.43 0.35 3.1
1999 –2.13 –3.43 –2.01 –2.54 1.73 14.26 0.59 2.92
2001 –2.12 –3.70 – 4.84 1.85 17.91 – –
Notes: *Elasticity estimates for distribution neutral growth. Estimates for other countries are not presented in Son's paper.
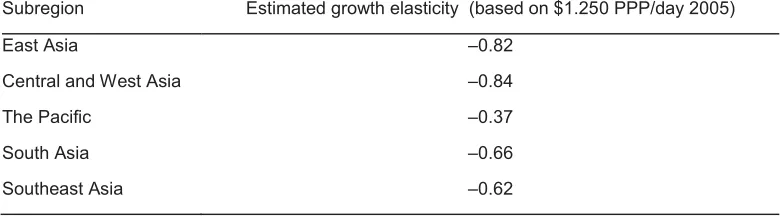
[image:25.612.89.549.537.660.2]To estimate poverty elasticity of growth in the five subregions in Asia, Hasan et al. (2009) fitted poverty, inequality, and GDP per capita data (1990–2005) of 24 Asian countries, from World Bank Povcalnet and World Bank World Development Indicators database, to
ln
P
itD
E
ln
G
itP
it. (A6) [image:26.612.89.481.202.311.2]Table A3 shows the estimates by Hasan et al. (2009).
Table A3. Estimates of growth elasticity of poverty (1990–2005), Asian subregions
Subregion Estimated growth elasticity (based on $1.250 PPP/day 2005)
East Asia –0.82
Central and West Asia –0.84
The Pacific –0.37
South Asia –0.66
Southeast Asia –0.62
Source: Hasan et al. 2009.
Revisiting the poverty–growth relationship
Using recent observations on head count ratio ($1.25 PPP/day 2005) and Gini for reference years 1980, 1984, 1987, 1990, 1993, 1999, 2002, and 2005 (available at World Bank Povcalnet) and GDP per capita from World Bank World Development Indicators database, growth and inequality elasticities of poverty for 21 Asian countries can be estimated.25 To allow for nonlinearity, the following Box-Cox model is adopted:
H
it(T)=E
iE
1G
it(O)1E
2I
it(O)1P
it (A7)where Ht
(T) H
t
T
1
T , Gt1
O G
t1 O
1
O , and It1
O I
t1 O
1
O
From equation (A7), the poverty elasticity of growth (
K
HG) and poverty elasticity of inequality (K
HI ) can be derived as:K
HGi= [ ˆT Eˆ iEˆ1
Git1
ˆ O 1 ˆ O ˆ
E2Iit1
ˆ O 1 ˆ O § © ¨ ¨ · ¹ ¸ ¸1]
(1Tˆ) ˆ
T E
1Git1
ˆ
O (A8)
25 Two countries in East Asia, seven in Southeast Asia, five in South Asia, and seven in Central
K
HIi= [ ˆT Eˆ iEˆ1
Git1
ˆ O 1 ˆ O ˆ
E2Iit1
ˆ O 1 ˆ O § © ¨ ¨ · ¹ ¸ ¸1]
(1Tˆ) ˆ
T E
2Iit1
ˆ
O (A9)
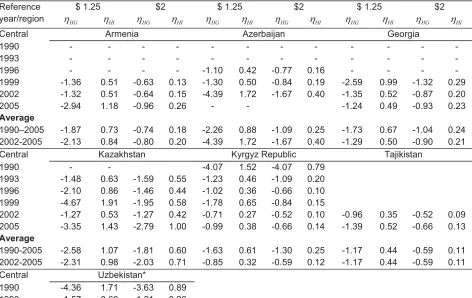
[image:27.612.91.563.355.653.2]Likelihood ratio tests indicated that the relationship between poverty and other variables is nonlinear.26 Using the parameter estimates of the Box-Cox model, we estimate the poverty elasticity of growth and poverty elasticity of inequality for each reference year and country, where data are available (Table A4). From these estimates, and using weights based on poverty head count, we generate average poverty elasticity of growth and of inequality for Asia. As presented in Table A4, the poverty elasticity of growth is estimated to be -0.92 at the $1.25 PPP/day poverty line and -0.47 at the $2 PPP/day line. The estimated poverty elasticity of inequality is 0.35 for the $1.25 line and 0.11 for the $2 line. These mean that for every 1% growth in income, $1.25 and $2 PPP/day poverty head count ratios are expected to drop by 0.92% and 0.47%, respectively, holding income distribution constant. Meanwhile, holding average income constant (i.e., no growth in total income), a 1% increase in income inequality as measured by the Gini would lead to 0.35% and 0.11% rises in the $1.25 and $2 line head count ratios, respectively.
Table A4. Poverty elasticity of growth and inequality ($1.25 and $2 PPP a day), selected Asian
countries (1984–2005)
Reference year/region
$ 1.25 $2 $ 1.25 $2 $ 1.25 $2
KHG KHI KHG KHI KHG KHI KHG KHI KHG KHI KHG KHI
Central Armenia Azerbaijan Georgia
1990 - - - -
1993 - - - -
1996 - - - - -1.10 0.42 -0.77 0.16 - - - -
1999 -1.36 0.51 -0.63 0.13 -1.30 0.50 -0.84 0.19 -2.59 0.99 -1.32 0.29 2002 -1.32 0.51 -0.64 0.15 -4.39 1.72 -1.67 0.40 -1.35 0.52 -0.87 0.20 2005 -2.94 1.18 -0.96 0.26 - - -1.24 0.49 -0.93 0.23 Average
1990–2005 -1.87 0.73 -0.74 0.18 -2.26 0.88 -1.09 0.25 -1.73 0.67 -1.04 0.24 2002-2005 -2.13 0.84 -0.80 0.20 -4.39 1.72 -1.67 0.40 -1.29 0.50 -0.90 0.21
Central Kazakhstan Kyrgyz Republic Tajikistan
1990 - - -4.07 1.52 -4.07 0.79
1993 -1.48 0.63 -1.59 0.55 -1.23 0.46 -1.09 0.20 1996 -2.10 0.86 -1.46 0.44 -1.02 0.36 -0.66 0.10 1999 -4.67 1.91 -1.95 0.58 -1.78 0.65 -0.84 0.15 2002 -1.27 0.53 -1.27 0.42 -0.71 0.27 -0.52 0.10 -0.96 0.35 -0.52 0.09 2005 -3.35 1.43 -2.79 1.00 -0.99 0.38 -0.66 0.14 -1.39 0.52 -0.66 0.13 Average
1990-2005 -2.58 1.07 -1.81 0.60 -1.63 0.61 -1.30 0.25 -1.17 0.44 -0.59 0.11 2002-2005 -2.31 0.98 -2.03 0.71 -0.85 0.32 -0.59 0.12 -1.17 0.44 -0.59 0.11 Central Uzbekistan*
1990 -4.36 1.71 -3.63 0.89 1993 -1.57 0.60 -1.21 0.26
26 We reject the null hypotheses that there is a linear relationship between poverty and income
Reference year/region
$ 1.25 $2 $ 1.25 $2 $ 1.25 $2
KHG KHI KHG KHI KHG KHI KHG KHI KHG KHI KHG KHI
1996 -2.86 1.07 -1.67 0.32 1999 -0.82 0.30 -0.55 0.10 2002 -0.66 0.25 -0.43 0.08 2005 -0.63 0.24 -0.45 0.10 Average
1990-2005 -1.82 0.70 -1.32 0.29 2002-2005 -0.65 0.24 -0.44 0.09
South Bangladesh India Nepal
1984 -1.00 0.36 -0.49 0.08 -0.88 0.32 -0.41 0.07 -0.73 0.26 -0.44 0.07 1987 -0.94 0.34 -0.49 0.08 -0.87 0.32 -0.41 0.07 -0.67 0.24 -0.43 0.07 1990 -0.90 0.32 -0.48 0.08 -0.86 0.32 -0.40 0.07 -0.67 0.24 -0.43 0.07 1993 -0.85 0.31 -0.48 0.08 -0.86 0.32 -0.40 0.08 1996 -0.85 0.31 -0.49 0.08 -0.85 0.32 -0.39 0.08 1999 -0.75 0.27 -0.46 0.07 -0.83 0.32 -0.39 0.08 -0.79 0.28 -0.45 0.07 2002 -0.73 0.27 -0.46 0.08 -0.80 0.31 -0.38 0.08 -0.84 0.30 -0.46 0.07 2005 -0.76 0.28 -0.45 0.08 -0.77 0.30 -0.37 0.08 -0.87 0.31 -0.47 0.07 Average
1990-2005 -0.85 0.30 -0.47 0.08 -0.84 0.31 -0.39 0.08 -0.76 0.27 -0.45 0.07 2002-2005 -0.74 0.27 -0.45 0.08 -0.78 0.30 -0.38 0.08 -0.86 0.30 -0.46 0.07
South Asia Pakistan Sri Lanka
1984 -0.63 0.23 -0.35 0.07 -1.30 0.49 -0.63 0.13 1987 -0.61 0.23 -0.34 0.07 -1.34 0.51 -0.62 0.14 1990 -0.66 0.25 -0.35 0.07 1993 -1.53 0.58 -0.45 0.10 -1.48 0.57 -0.67 0.15 1996 -0.73 0.28 -0.35 0.08 -1.21 0.47 -0.64 0.15 1999 -1.18 0.46 -0.43 0.10 -1.13 0.44 -0.67 0.16 2002 -0.98 0.38 -0.39 0.08 -1.23 0.48 -0.72 0.18 2005 -1.47 0.57 -0.46 0.11 -1.53 0.60 -0.82 0.20 Average
1990-2005 -0.97 0.37 -0.39 0.08 -1.32 0.51 -0.68 0.16 2002-2005 -1.22 0.47 -0.42 0.10 -1.38 0.54 -0.77 0.19 East and
Southeast Asia
Cambodia China Indonesia
1984 - - - - -0.81 0.29 -0.43 0.07 -0.75 0.28 -0.34 0.07 1987 - - - - -0.91 0.33 -0.44 0.08 -0.65 0.25 -0.32 0.07 1990 - - - - -0.74 0.28 -0.41 0.08 -0.76 0.29 -0.33 0.08 1993 - - - - -0.75 0.28 -0.41 0.08 -0.69 0.27 -0.31 0.08 1996 -1.01 0.36 -0.53 0.08 -0.94 0.36 -0.46 0.10 -0.78 0.31 -0.32 0.08 1999 -0.93 0.33 -0.52 0.08 -0.84 0.33 -0.46 0.11 -0.75 0.29 -0.31 0.08 2002 -0.73 0.26 -0.47 0.08 -0.94 0.37 -0.52 0.13 -1.16 0.46 -0.37 0.10 2005 -0.83 0.30 -0.50 0.09 -1.41 0.57 -0.69 0.19 -1.51 0.61 -0.45 0.12 Average
1990–2005 -0.87 0.31 -0.50 0.08 -0.92 0.35 -0.48 0.10 -0.88 0.35 -0.34 0.08 2002–2005 -0.78 0.28 -0.49 0.08 -1.18 0.47 -0.61 0.16 -1.34 0.53 -0.41 0.11 East and
Southeast Asia
Lao PDR Malaysia Philippines
Reference year/region
$ 1.25 $2 $ 1.25 $2 $ 1.25 $2
KHG KHI KHG KHI KHG KHI KHG KHI KHG KHI KHG KHI
1993 - - - - -3.47 1.44 -2.38 0.76 -1.02 0.39 -0.54 0.11 1996 -0.92 0.34 -0.43 0.08 -2.77 1.17 -3.21 1.09 -1.30 0.50 -0.64 0.14 1999 -0.85 0.32 -0.41 0.08 -1.86 0.78 -2.53 0.85 -1.29 0.49 -0.64 0.14 2002 -0.84 0.32 -0.40 0.08 -2.27 0.97 -3.30 1.17 -1.25 0.48 -0.64 0.14
2005 - - - - -2.27 0.98 - - -1.13 0.44 -0.61 0.14
Average
1990-2005 -0.87 0.32 -0.42 0.08 -2.99 1.24 -2.59 0.82 -1.08 0.41 -0.57 0.12 2002-2005 -0.84 0.32 -0.40 0.08 -2.27 0.97 -3.30 1.17 -1.19 0.46 -0.62 0.14 East and
Southeast
Mongolia Thailand Vietnam
1984 - - - - -1.00 0.38 -0.67 0.14 - - - -
1987 - - - - -1.13 0.44 -0.72 0.16 - - - -
1990 - - - - -1.54 0.61 -0.90 0.23 - - - -
1993 - - - - -2.00 0.80 -1.05 0.28 - - - -
1996 - - - - -4.54 1.85 -1.50 0.44 -0.70 0.26 -0.40 0.07 1999 -0.90 0.34 -0.48 0.11 -6.29 2.56 -1.32 0.38 2002 -1.71 0.66 -0.77 0.18 -12.26 5.01 -1.74 0.51 -0.87 0.33 -0.45 0.09 2005 -1.06 0.41 -0.59 0.14 -16.16 6.71 -2.31 0.73 -1.38 0.53 -0.58 0.12 Average
[image:29.612.89.563.403.496.2]1990–2005 -1.22 0.47 -0.61 0.14 -5.62 2.29 -1.28 0.36 -0.98 0.37 -0.48 0.09 2002–2005 -1.38 0.54 -0.68 0.16 -14.21 5.86 -2.03 0.62 -1.12 0.43 -0.51 0.11 Source: Authors’ estimates.
Table A5. Box-Cox model estimates
Poverty line
($ PPP per day)
Parameter estimates Elasticity estimates
ˆ
T Oˆ Eˆ
1 Eˆ2 KHG KHI
1.25 0.46 -0.08 -8.76 2.45 -0.92 0.36
(0.07) (0.12) (185.89) (4.05)
2 1.23 -0.36 -1169.86 58.78 -0.47 0.11
(0.14) (0.13) (159.15) (0.96)
Notes: (i) Values in parentheses are standard errors for T and O and F2-ratios for Es; (ii) n=119; (iii) Estimates
of country intercept (Eˆ
i) not reported. For $1.25 PPP/day model, intercept for the PRC, India, Indonesia,
References:
Dollar, D., and A. Kraay. 2002. Growth is good for the poor. Journal of Economic Growth, 7(3): 195–225. Foster, J., J. Greer, and E. Thorbecke. 1984. A class of decomposable poverty measures. Econometrica
52(3):761–66.
Hasan, R., MR Magsombol, and JS Cain. 2009. Poverty impact of the economic slowdown in developing Asia: Some scenarios. ADB Economics Working Paper Series No. 153.
Kakwani, N. 1993. Poverty and economic growth with application to Cote d'Ivoire. Review of Income & Wealth 39(2): 121–39.
Ravallion, M. 1997. Can high-inequality developing countries escape absolute poverty? Economics Letters
56(1): 51–57.
Appendix B. Short- and long-run relationship between growth and spending
To obtain the social spending elasticity of growth, the relationships between GDP and various expenditures on health and education can be estimated. Data for developing Asian countries are available on per capita health expenditure and per capita education expenditure, from Word Development Indicators (WDI) Online. They are used to estimate the following model:
ln(Sit)
D
E
0ln(St1)E
1iln(Git)P
, (B1)where
S
is per capita spending andG
is GDP per capita.From equation (B1), the short-run spending elasticity of growth is simply E1i and the long-run spending elasticity of growth is wSLRi
wGi
Gi
SLRi
=
K
SLRGi = E1i (1E0). (B2)
That is, a percentage change in GDP per capita in year t in country iwould result in E1i percentage change in per capita spending in year t. However, it would also affect spending in subsequent periods. Holding everything else constant, every one percentage GDP per capita shock in year t would result in
E
1iE
0 percentage change of per capita spending in year t+1, andE
1iE
02percentage change in t+2. To generalize, for every one percentage shock in year t, per capita spending in year t+n would change by
E
1iE
0n
. The sum of the changes for years t to t + f is
E
1i / (1E
0) or equation (B2).Table B1 tabulates model estimation results for per capita health and education spending. Table B2 presents our estimated short- and long-run elasticities. The short-run elasticities of growth for public and for private spending on health ranges from 0.50–0.84 and 0.49-0.67, respectively, while the short-run elasticity of growth for public education is only 0.34–0.53. In Indonesia, for instance, a 1% increase or decrease in GDP in year t translates to a 0.62% increase or decrease in private health spending, a 0.55% increase or decrease in public health spending, and a 0.43% increase or decrease in public education in year t. Table B2 also shows how a one percentage increase or decrease in GDP (at t = year 1) affect social spending at t = year 2, year 3, and f. Clearly, a 1% increase or decrease in GDP (at t = year 1) translates to higher changes in public health and public education spending in the long-run.
Estimates of long-run elasticity for per capita public health spending are 59% higher than
estimates of short-run elasticity. For example, while a 1% increase decrease in GDP translates to only 0.64% increase or decrease in per capita public health spending within the same year, its total impact on per capita public health spending is around 1.01% increase or decrease in social spending, accumulated over several periods after the initial change.
could explain this is the greater flexibility of the public health sector to absorb and use more
resources, and at a faster pace,27 as indicated by the lower spending on health than on education.
A decomposition of the long-run impact of an increase or decrease in GDP in year t on public health and education suggests that while more than half of the long-term impact on public health spending is experienced by Asian economies in around 3 years after the shock, half of the long-term impact on public education is felt within 7 years after the increase or decrease in GDP.
On the positive side, these elasticity estimates imply that when Asian economies experience positive growth, the private spending on health grows faster than public spending, which in turn also grows faster than public spending on education. Over the long run, total change in public spending on health is higher than both private spending on health and public spending on education. However, on the flipside, when Asian economies experience negative growths, total long-run impact on public health spending due to GDP slowdown is greatest.
27
Table B1. Estimation results for per capita health and education spending
Dependent variable Ln(Per capita spending at time t)
Private health Public health Public education Independent variables Coef Coef Coef
Ln(Per capita spendingat time t-1) 0.37 ** 0.37 *** 0.51 ***
Ln(Per capita GDP, region and country) West and Central Asia
Armenia 0.67 *** 0.64 *** 0.43 ***
Azerbaijan 0.62 ** 0.63 *** 0.43 ***
Kazakhstan 0.69 *** 0.58 *** 0.43 ***
Kyrgyz Republic 0.70 ** 0.63 *** 0.43 ***
Pakistan 0.55 *** 0.58 *** 0.40 ***
Tajikistan 0.63 ** 0.64 *** 0.41 ***
Uzbekistan 0.70 ** 0.61 ***
East Asia
China, People’s Republic of 0.68 *** 0.62 *** 0.40 ***
Hong Kong, China 0.45 ***
Korea, Republic of 0.70 *** 0.62 *** 0.45 ***
Macao, China 0.43 ***
Mongolia 0.74 *** 0.54 *** 0.47 ***
Pacific
Fiji Islands 0.71 *** 0.55 *** 0.47 ***
Kiribati 0.84 *** 0.52 *** 0.53 ***
Lao PDR 0.62 ** 0.62 *** 0.41 ***
Micronesia, Federated States of 0.81 *** 0.54 *** 0.47 *** Papua New Guinea 0.73 *** 0.49 ***
Samoa 0.74 *** 0.53 *** 0.44 ***
Timor-Leste 0.83 *** 0.57 ***
Tonga 0.74 *** 0.55 *** 0.46 ***
Vanuatu 0.71 *** 0.57 *** 0.48 ***
South Asia
Bangladesh 0.61 *** 0.59 *** 0.40 **
Bhutan 0.71 *** 0.55 *** 0.46 ***
India 0.62 ** 0.65 *** 0.44 ***
Maldives 0.78 *** 0.58 *** 0.48 ***
Nepal 0.67 ** 0.65 *** 0.42 ***
Sri Lanka 0.67 *** 0.60 ***
Southeast Asia
Brunei Darussalam 0.66 *** 0.51 *** 0.47 ***
Cambodia 0.69 ** 0.67 *** 0.37 **
Indonesia 0.62 *** 0.55 *** 0.43 ***
Malaysia 0.68 *** 0.60 *** 0.48 ***
Myanmar 0.50 *** 0.58 *** 0.34 ***
Philippines 0.64 ** 0.59 *** 0.42 ***
Singapore 0.64 *** 0.61 ***
Thailand 0.69 *** 0.56 *** 0.45 ***
Viet Nam 0.66 ** 0.65 ***
Constant 0.05 0.75 1.07
R2 0.99 0.99 0.99
N (countries) 137 (36) 137 (36) 141 (29)