Simultaneous Optimal Placement of DGs and Fixed
Capacitor Banks in Radial Distribution Systems using
BSA Optimization
Meera Shareef Syed
PG Scholar, Department of E.E.E Sir C R Reddy College of EngineeringSatish Kumar Injeti
Associate Professor, Department of E.E.E Sir C R Reddy College of Engineering
ABSTRACT
Nowadays the research on the integration of DG‟s and Capacitor banks in radial distribution system is going on, to meet the increased electricity demand and to improve the technical aspects like power loss reduction, voltage profile improvement etc., where the major concerns are finding the optimal sizing of DG‟s and Capacitor banks and their locations. This paper presents application of new optimization algorithm; Backtracking Search Algorithm (BSA) to solve the optimal placement of both DG and fixed capacitor banks in order to reduce the power loss and improve voltage profile of distribution system. A detailed performance analysis is carried out on 33-bus and 69-bus radial distribution system to demonstrate the effectiveness of the proposed algorithms and the results are compared with the GA/PSO, ICA/GA and Analytical approach which are available in the literature.
Keywords
Distribution Generation (DG), Fixed Capacitor bank, Backtracking search Algorithm (BSA).
1.
INTRODUCTION
Nowadays a wide range of research is going on the distribution system as it is the final link between the bulk power system and the consumers. Distribution system generally operates at low voltage and high currents, results in more amounts of power loss and poor voltage profile when compared to Transmission system. From the studies it is approximated that the share of Distribution losses in total power generated is 13% [1]. The electricity demand is increasing day-to-day leads to the further increment in power losses and voltage drops. Such amount of high power losses limits the line capacity (thermal limits) and poor voltage profile causes the voltage instability of the system. Therefore the concern is not only about the improvements of technical aspects but also to meet the future electricity demand for the existing distribution system by maintaining the line capacity and the voltage stability.
Installation of DG‟s in the radial distribution network at the load centers can improve the voltage profile and reduce the real power losses to the significant effect as it controls the active and reactive power flows in the distribution primary lines. As the DGs can inject both real and reactive power it can reduce transmission and distribution capacity release which can be utilized for increased future demand of electricity. In decentralized electricity market installation of DGs encourages the Distribution network operators, as it reduces the amount of energy taken from the transmission side. With growing concerns among the environmental impacts majorly contributed by the centrally dispatched
generations, renewable energy DG sources can provide most viable alternative to the utilities. A “2/3 rule” analytical method is suggested for the installation of DG by [8]. Satish Kumar Injeti et al. suggested simulated annealing (SA) method [9] for the sizing of multiple DGs and their allocation is done by using loss sensitivity factors. An ABC method is proposed for the optimal DG unit‟s location, size and power factor by [10], for the reduction of active power loss. PSO is applied for optimal placement of multiple DGs in distribution system with varying power load models by [11]. Optimal placement of DG is done by considers uncertainties using fuzzy numbers and is solved by a hybrid NSGA-II in [12]. A detailed analysis of DG placement is given by [13], which describes the different algorithms and methods of their approaches for the loss reduction and voltage profile improvement.
Due to the limited DG‟s sources and high implementation cost, we can‟t have a wide usage of DG sources. Therefore it is necessary to use another parallel element with DG which having low implementation cost, to improve the technical aspects like power loss reduction, voltage profile and power factor improvement. Since capacitor supports reactive power and improves the above mentioned technical aspects, combined optimal placement of DG and capacitor for improving the same amount of technical aspects requires less amount of real power injection by the DG against optimal placement of DG only which reduces the implementation cost of DG. Hence the simultaneous placement capacitor and DG gives the optimal operational economics of power system. Sayyid Mohssen Sajjadi et al. [14] proposed Memetic alogorithm (MA) for optimal sizing of DG‟s and capacitors and their corresponding location are given by voltage stability index. Mohammad H. Moradi, et al. [15-16] proposed GA/PSO and ICA/GA for the optimal sizing of DG‟s & capacitor banks and their locations. He considered a multi objective function for this optimization problem and explores economical advantages for corresponding technical improvements. S. Gopiya Naik et al. [17] proposed an analytical approach for optimal sizing of a DG and a capacitor and their corresponding location are given by loss sensitivity factor for loss minimization.
compared with existing algorithms. The Standard Backward/Forward Sweep power flow method suggested in [19-20] is used for the load flow analysis.
The rest of this paper is organized as follows. Section 2 gives the objective function formulation, Section 3 gives the overview of proposed algorithm, Section 4 presents the result analysis and Section 5 outlines the conclusions
ask that authors follow some simple guidelines. In essence, we ask you to make your paper look exactly like this document. The easiest way to do this is simply to download the template, and replace the content with your own material.
2.
OBJECTIVE FUNCTION
FORMULATION
2.1 Objective Function
Installation of DG‟s injects real and reactive power & Capacitors injects reactive power causes altering of both real and reactive power flows in radial distribution system which results in the reduction of power losses and voltage profile improvement. The objective function is considered as power loss minimization which requires finding of optimal sizes and locations of both DG‟s and fixed capacitor banks subjected to some operational constraints. Mathematically the objective function is formulated as
Minimize 𝑃𝑇,𝑙𝑜𝑠𝑠 = 𝑛−1𝑖=1 𝐽𝑖 2∗ 𝑟𝑒 𝑍𝑖 (1)
Where PT,loss is the total active power loss, n is the number of
buses, Zi is the impedance of the ith branch and Ji is the branch
current of the ith branch.
Branch currents are obtained from the results after performing Standard backward/forward sweep power flow [21] using eq. (2).
𝐽 = 𝐵𝐼𝐵𝐶 ∗ 𝐼 (2) Where J represents the branch current matrix, BIBC represents the bus injected branch current matrix and I represent the nodal current matrix.
𝐼𝑖= 𝑃𝑖−𝑃𝐷𝐺𝑖 +𝑗 ∗(𝑄𝑉𝑖−(𝑄𝑐𝑖+𝑄𝐷𝐺𝑖))
𝑖
∗
(3) Where Pi, Qi are the active and reactive power load at the ith
bus, PDGi, QDGi are the real and reactive power of DG‟s
injected at the ith bus, Qci is the reactive injected by the
capacitor at the ith bus and Vi is the voltage at ith node.
2.2
Constraints
The objective function is subjected to following constraints: The voltage magnitude must kept within the specified
limits at each bus:
𝑉𝑚𝑖𝑛 ≤ 𝑉 ≤ 𝑉max (4)
Where Vmin, Vmax are the lower and upper limits of bus
voltage, respectively.
From practical limitation, maximum compensation by using DG‟s is limited to the total active power demand.
𝑃𝐷𝐺𝑖 𝑁𝐷𝐺
𝑖=1 ≤ 𝑁𝑗 =1𝑙 𝑃𝐷 𝑗 (5)
Where NDG is the number of DG‟s, Nl is the number of load
buses and PD(j) is the reactive power demand of load at bus j.
From practical limitation, maximum compensation by using capacitor bank is limited to the total reactive power demand.
𝑄𝑐 𝑖 𝑁𝑐
𝑖=1 + 𝑁𝑖=1𝐷𝐺𝑄𝐷𝐺𝑖≤ 𝑁𝑗 =1𝑙 𝑄𝐷 𝑗 (6)
Where Nl is the number of load buses and QD(j) is the reactive
power demand of load at bus j.
Capacitors are available in discrete sizes so shunt capacitors to be dealt with multiple integers of the smallest capacitor size available and it may be mathematically expressed as
𝑄𝑐 𝑖 = 𝐿𝑄𝑠 (7)
Where, Qs is the smallest capacitor size available and L is an
integer multiple.
All material on each page should fit within a rectangle of 18 x 23.5 cm (7" x 9.25"), centered on the page, beginning 2.54 cm (1") from the top of the page and ending with 2.54 cm (1") from the bottom. The right and left margins should be 1.9 cm (.75”). The text should be in two 8.45 cm (3.33") columns with a .83 cm (.33") gutter.
3.
BACKTRACKING SEARCH
ALGORITHM (BSA)
PleaseBSA is a population-based iterative EA designed to be a global minimiser. SA can be explained by dividing its functions into five processes as is done in other EAs: initialization, selection-I, mutation, crossover and selection-II. Algorithm General Structure of BSA:
1) Initialization Repeat
2) Selection-I
Generation of trail population (3) Mutation
(4) Crossover End
5) Selection-II
Until stopping conditions are met. 1) Initialization
BSA initializes the population P with Eq. (8): Pij ~ U (lowj, upj) (8)
for i = 1,2,3,. . .,N and j = 1,2,3,. . .,D, where N and D are the population size and the problem dimension, respectively, U is the uniform distribution and each Pi is a target individual in
the population P. 2) Selection-I
BSA‟s Selection-I stage determines the historical population oldP to be used for calculating the search direction. The initial historical population is determined using Eq. (9):
oldPij ~ U (lowj, upj)
(9)
BSA has the option of redefining oldP at the beginning of each iteration through the „if-then‟ rule in Eq. (10):
remembers this historical population until it is changed. Thus, BSA has a memory.
After oldP is determined, Eq. (11) is used to randomly change the order of the individuals in oldP:
oldP: = permuting (oldP). (11)
The permuting function used in Eq. (11) is a random shuffling function.
3) Mutation
BSA‟s mutation process generates the initial form of the trial population Mutant using Eq. (12).
Mutant = P + F. (oldP - P) (12)
In Eq. (12), F controls the amplitude of the search-direction matrix (oldP - P). Because the historical population is used in the calculation of the search-direction matrix, BSA generates a trial population, taking partial advantage of its experiences from previous generations. This paper uses the value F = 3*rndn, where, rndn ~ N (0, 1) (N is the standard normal distribution).
4) Crossover
BSA‟s crossover process generates the final form of the trial population T. The initial value of the trial population is Mutant, as set in the mutation process. Trial individuals with better fitness values for the optimization problem are used to evolve the target population individuals. BSA‟s crossover process has two steps. The first step calculates a binary integer-valued matrix (map) of size N*D that indicates the individuals of T to be manipulated by using the relevant individuals of P. If mapn,m = 1, where n є {1, 2, 3, . . . ,N} and
m € {1, 2, 3, . . . ,D}, T is updated with Tn,m := Pn,m.
5) Selection-II
In BSA‟s Selection-II stage, the T is that have better fitness values than the corresponding P is are used to update the P is based on a greedy selection. If the best individual of P (Pbest)
has a better fitness value than the global minimum value obtained so far by BSA, the global minimizer is updated to be Pbest, and the global minimum value is updated to be the
fitness value of Pbest. The structure of BSA is quite simple;
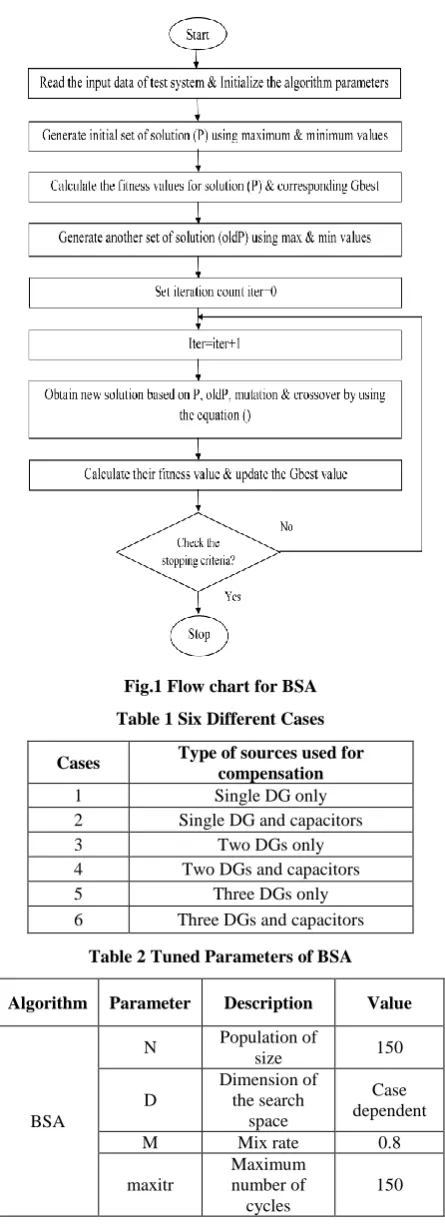
thus, it is easily adapted to different numerical optimization problems and the Figure 1 represents the flowchart for BSA.
4.
RESULT ANALYSIS
[image:3.595.318.541.70.683.2]The performance and effectiveness of the proposed algorithm for power loss minimization has been tested on 33-bus and 69-bus radial distribution system for six cases. The six different cases are shown in the Table 1. A number of trails on the performance of the applied algorithms have been carried out on the test systems to determine the most suitable parameters
Fig.1 Flow chart for BSA
Table 1 Six Different Cases
Cases Type of sources used for
compensation
1 Single DG only
2 Single DG and capacitors
3 Two DGs only
4 Two DGs and capacitors
5 Three DGs only
6 Three DGs and capacitors
Table 2 Tuned Parameters of BSA
Algorithm Parameter Description Value
BSA
N Population of
size 150
D
Dimension of the search
space
Case dependent
M Mix rate 0.8
maxitr
Maximum number of cycles
150
4.1
33-Bus Test System Numerical Results
The 33-bus test case consists of a main feeder and 3 sub-feeders (laterals) radial distribution system as shown in Figure 2. The data of the system is obtained from [16]. The total load of the system is 3715 kW and 2300 kVAR. The rated voltage of the system is 12.66kV. After an initial load flow run using Backward/Forward Sweep method for an uncompensated system, the active power loss is 210.9823KW and maximum & minimum voltages are 1.0 p.u and 0.9038 p.u respectively.
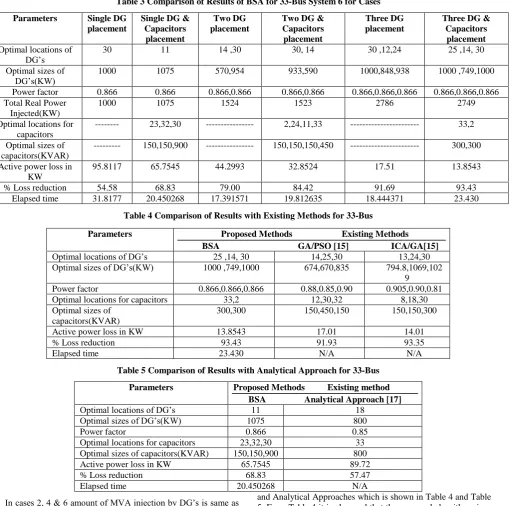
[image:4.595.49.563.180.686.2]To observe the effectiveness of the proposed algorithm, its results are compared with the other techniques like GA/PSO, ICA/GA and Analytical Approach. Table 3 shows, the optimal locations and sizes of DG‟s & capacitors, DG‟s operating power factors, total real power injected, total active power loss and percentage of loss reduction for BSA algorithms for six different cases respectively. From Table 3 it is also observed that the reduction of power loss in case2, case4 & case6 is more when compared to case1, case3 & case5.
Table 3 Comparison of Results of BSA for 33-Bus System 6 for Cases
Parameters Single DG
placement
Single DG & Capacitors
placement
Two DG placement
Two DG & Capacitors placement
Three DG placement
Three DG & Capacitors
placement
Optimal locations of DG‟s
30 11 14 ,30 30, 14 30 ,12,24 25 ,14, 30
Optimal sizes of DG‟s(KW)
1000 1075 570,954 933,590 1000,848,938 1000 ,749,1000
Power factor 0.866 0.866 0.866,0.866 0.866,0.866 0.866,0.866,0.866 0.866,0.866,0.866 Total Real Power
Injected(KW)
1000 1075 1524 1523 2786 2749
Optimal locations for capacitors
--- 23,32,30 --- 2,24,11,33 --- 33,2 Optimal sizes of
capacitors(KVAR)
--- 150,150,900 --- 150,150,150,450 --- 300,300 Active power loss in
KW
95.8117 65.7545 44.2993 32.8524 17.51 13.8543
% Loss reduction 54.58 68.83 79.00 84.42 91.69 93.43
Elapsed time 31.8177 20.450268 17.391571 19.812635 18.444371 23.430
Table 4 Comparison of Results with Existing Methods for 33-Bus
Parameters Proposed Methods Existing Methods
BSA GA/PSO [15] ICA/GA[15]
Optimal locations of DG‟s 25 ,14, 30 14,25,30 13,24,30
Optimal sizes of DG‟s(KW) 1000 ,749,1000 674,670,835 794.8,1069,102 9
Power factor 0.866,0.866,0.866 0.88,0.85,0.90 0.905,0.90,0.81
Optimal locations for capacitors 33,2 12,30,32 8,18,30
Optimal sizes of capacitors(KVAR)
300,300 150,450,150 150,150,300
Active power loss in KW 13.8543 17.01 14.01
% Loss reduction 93.43 91.93 93.35
Elapsed time 23.430 N/A N/A
Table 5 Comparison of Results with Analytical Approach for 33-Bus
Parameters Proposed Methods Existing method
BSA Analytical Approach [17]
Optimal locations of DG‟s 11 18
Optimal sizes of DG‟s(KW) 1075 800
Power factor 0.866 0.85
Optimal locations for capacitors 23,32,30 33
Optimal sizes of capacitors(KVAR) 150,150,900 800
Active power loss in KW 65.7545 89.72
% Loss reduction 68.83 57.47
Elapsed time 20.450268 N/A
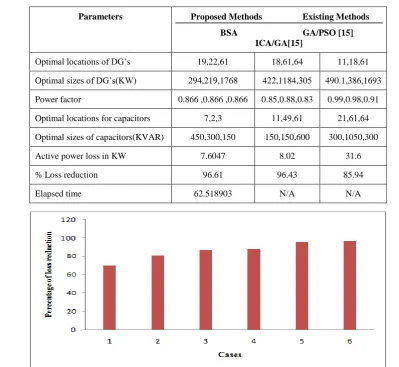
In cases 2, 4 & 6 amount of MVA injection by DG‟s is same as in cases 1, 3 & 5 respectively, but difference in loss reduction of for BSA 14.25, 5.42 & 1.74 between the cases is observed. So the simultaneous placement of DG‟s and capacitors has more power loss reduction than the only DG placement. Figure 3 shows the comparison of power loss reduction of BSA for six cases. To check the efficiency of the proposed algorithms the results are compared with existing algorithms GA/PSO, ICA/GA
[image:4.595.36.565.191.386.2]Fig.2 Single line diagram of 33-bus radial distribution system
Fig.3 Comparison of loss reduction of BSA for six cases (33-bus)
4.2
69-Bus Test System Numerical Results
The 69-bus test case consists of a main feeder and 7 sub-feeders (laterals) radial distribution system as shown in Fig 4. The data of the system is obtained from [22]. The total load of the system is 3801 kW and 2694 kVAR. The rated voltage of the system is 12.66kV. After an initial load flow run using Backward/Forward Sweep method for an uncompensated system, the active power loss is 224.8949KW and maximum & minimum voltages are 1.0 p.u and 0.9092 p.u respectively. To observe the effectiveness of
the proposed algorithms, their results are compared with the other techniques like GA/PSO and ICA/GA. Table VI shows, the optimal locations and sizes of DG‟s & capacitors, DG‟s operating power factors, total real power injected, total active power loss and percentage of loss reduction for BSA algorithm for six different cases respectively. From Table VI it is also observed that the reduction of power loss in case2, case4 & case6 is more when compared to case1, case3 & case5. In cases 2, 4 & 6 amount of MVA injection by DG‟s is same as in cases 1, 3 & 5 respectively, but difference in loss reduction of for BSA 10.758, 1.581 & 0.932 between the cases is observed. So the simultaneous placement of DG‟s and capacitors has more power loss reduction than the only DG placement. Fig 5 shows the comparison of power loss reduction of BSA for six cases. To check the efficiency of the proposed algorithms the results are compared with existing algorithms GA/PSO and ICA/GA which is shown in Table VII. From Table VII it is observed that the proposed algorithm gives the better result when compared with the GA/PSO and ICA/GA algorithms.
4.3
Convergence and Voltage Profile
Analysis
The convergence and voltage profile graphs for all the six cases are shown in Figure 6 and Figure 7 for the two test systems. From the convergence graphs it is observed that, for the case 6 of 33-bus system BSA reached to best solution at 95th generation and in case 6 of 69-bus system it reached the better solution at 39th generation.
Table 6 Comparison of Results of BSA for 69-Bus System 6 for Cases
Parameters
Single DG placement
Single DG & Capacitors
placement
Two DG placement
Two DG & Capacitors placement
Three DG placement
Three DG & Capacitors
placement
Optimal locations of DG‟s
61 61 61,23 62,9 61,20,62 19,22,61
Optimal sizes of DG‟s(KW)
1000 1000 1357,164 1350,170 767,514,100 294,219,1768
Power factor 0.866 0.866 0.866,0.866 0.866,0.866 0.866,0.866,0.8
66
0.866 ,0.866 ,0.866 Total Real Power
Injected(KW)
1000 1000 1521 1521 2281 2281
Optimal locations for capacitors
---
62 ,22 , 61 --- 16,2,57 ---
7,2,3
Optimal size of capacitor(KVAR)
---
450 ,300 ,150 --- 450, 150 , 300 ---
450,300,150
Active power loss in KW 66.9526 42.7798 30.2357 26.69 9.7196 7.6047
% Loss reduction 70.229 80.987 86.55 88.131 95.678 96.61
[image:6.595.89.489.379.746.2]Elapsed time 61.434655 90.053564 68.035410 69.090415 67.115659 62.518903
Table 7 Comparison of Results with Existing Methods for 69-Bus
Parameters Proposed Methods Existing Methods
BSA GA/PSO [15] ICA/GA[15]
Optimal locations of DG‟s 19,22,61 18,61,64 11,18,61
Optimal sizes of DG‟s(KW) 294,219,1768 422,1184,305 490.1,386,1693 Power factor 0.866 ,0.866 ,0.866 0.85,0.88,0.83 0.99,0.98,0.91 Optimal locations for capacitors 7,2,3 11,49,61 21,61,64 Optimal sizes of capacitors(KVAR) 450,300,150 150,150,600 300,1050,300
Active power loss in KW 7.6047 8.02 31.6
% Loss reduction 96.61 96.43 85.94
Elapsed time 62.518903 N/A N/A
Fig.6 Convergence and voltage profile of six cases of BSA for 33-bus
5.
CONCLUSION
In this paper, a new algorithm has been proposed for the simultaneously optimal placement of DGs and capacitors in a distribution system. This algorithm is applied on six different cases; the result shows that, cases with simultaneous placement of DG and capacitor have much improvement of voltage profile and power loss reduction when compared with cases of only DG placement. From the results, it is observed that the percentage of power loss reduction is improving as the number of DG‟s is increasing from 1 to 3, but the rate of improvement of percentage power loss reduction is decreasing from 1DG to 3DG‟s. Among all the six cases percentage of loss reduction is more in case 6. The results of BSA algorithm with comparison of existing algorithms show that the performance of BSA is better than GA/PSO, ICA/GA and Analytical Approach.
6.
REFERENCES
[1] Ng HN, Salama MA, Chikhani AY. Classification of capacitor allocation techniques. IEEE Trans Power Deliv 2000; 15(1):387–92.
[2] J.V.Schmill,” optimum size and location of shunt capacitors on distribution feeders”,IEEE Trans. On Power Apparatus and System.vol. 84, pp. 825-832, sep. 1965.
[3] Prakash K, Sydulu M. Particle swarm optimization based capacitor placement on radial distribution systems. IEEE power engineering society general meeting; 2007, pp. 1– 5.
[4] Raju MR, Murthy KVSR, Avindra KR. Direct search algorithm for capacitive compensation in radial distribution systems. Int J Elect Power Energy Syst., 2012; 42(1), pp.24–30.
[5] Sneha S, Provas Kumar R. Optimal capacitor placement in radial distribution systems using teaching learning based optimization. Int. J Elect Power Energy Syst., 2013, 54, pp. 387–398.
[6] Iman Ziari, Gerard Ledwich, Arindam Ghosh. A new technique for optimal allocation and sizing of capacitors and setting of LTC. Electrical Power and Energy Systems 46 (2013) 250–257.
[7] Sirjani R, Azah M, Shareef H. Heuristic optimization techniques to determine optimal capacitor placement and sizing in radial distribution networks: a comprehensive review. PRZEGLA˛ D ELEKTROTECHNICZNY (Elect. Rev.), 2012, 88(7a), pp.1–7.
[8] H. L. Willis, “Analytical methods and rules of thumb for modeling DG-distribution interaction,” in Proc. IEEE Power Eng. Soc. Summer Meeting, Jul. 2000, pp. 1643– 1644.
[9] Satish Kumar Injeti, N. Prema Kumar. A novel approach to identify optimal access point and capacity of multiple DGs in a small, medium and large scale radial
distribution system. Electrical Power and Energy Systems 45 (2013) 142–151
[10] F. S. Abu-Mouti and M. E. El-Hawary, “Optimal distributed generation allocation and sizing in distribution systems via artificial bee colony algorithm,” IEEE Trans. Power Del., vol. 26, no. 4, pp. 2090–2101, Oct. 2011.
[11] A. M. El-Zonkoly, “Optimal placement of multi-distributed generation units including different load models using particle swarm optimization,” IET Gener., Transm., Distrib., vol. 5, no. 7, pp. 760–771, Jul. 2011. [12] P. Harrison, A. Piccolo, P. Siano, and A. R. Wallace,
“Hybrid GA and OPF evaluation of network capacity for distributed generation con-nections,” Elect. Power Syst. Res., vol. 78, no. 3, pp. 392–398, Mar. 2008.
[13]Pavlos S. Georgilakis, Nikos D. Hatziargyriou. Optimal Distributed Generation Placement in Power Distribution Networks: Models, Methods, and Future Research. Ieee Transactions On Power Systems, Vol. 28, No. 3, August 2013
[14]Sayyid Mohssen Sajjadi, Mahmoud-Reza Haghifam, Javad Salehi. Simultaneous placement of distributed generation and capacitors in distribution networks considering voltage stability index. Electrical Power and Energy Systems 46 (2013) 366–375.
[15]Mohammad H. Moradi, Arash Zeinalzadeh, Younes Mohammadi, Mohammad Abedini. An efficient hybrid method for solving the optimal sitting and sizing problem of DG and shunt capacitor banks simultaneously based on imperialist competitive algorithm and genetic algorithm. Electrical Power and Energy Systems 54 (2014) 101–111.
[16]M. H. Moradi, M. Abedini, A combination of genetic algorithm and particle swarm optimization for optimal DG location and sizing in distribution systems, Electrical Power and Energy Systems 34 (1) (2012) pp. 66-74 [17]S. Gopiya Naik, D.K.Khatod, M.P.Sharma. Optimal
allocation of combined DG and capacitor for real power loss minimization in distribution networks. Electrical Power and Energy Systems 53 (2013) 967–973.
[18]Pinar civicioglu, Backtracking Search Optimization Algorithm for numerical optimization problems, Applied Mathematics and Computation, Vol. 219, 2013, pp. 8121 – 8144.
[19]Paulo M.D, Oliveira D J. The standard backward/forward sweep power flow.
[20]Haque MH. Efficient load flow method for distribution systems with radial or mesh configuration. IEE Proc Gen Trans Distrib 1996; 143(1):33–8.