Feature Extraction cum Frequency Analysis
System for Facial Surface Electromyography
Signals Based Human Speech Recognition
Ajay P. Vyas1, Dr. Rajesh Bhadada2
1, 2
Department of Electronics & Communication Engineering, Faculty of Engineering &ArchitectureJ. N. Vyas University, Jodhpur Rajasthan
Abstract: Surface Electromyography (SEMG) signal processing is being applied for diagnosis of neuromuscular disorders, sports medicine and as control signal in physiological rehabilitation. It can also be applied for detection and generation of spoken contents in human speech. Collection of important facial EMG signals as per human's own natural voice pattern and generation of its database is a pending task before researchers. Such a database can empower and enable them to invent natural voice like speech for every individual as like his/her own voice. This paper proposes a novel invention that is able to extract features by capture, record and filter human speech related facial muscle signals. A two channel SEMG system has been developed by us for data collection from articulator muscles of the face by capturing signals using two pairs of electrodes attached to important facial muscle sto record EMG patterns corresponding to spoken alphabets. These signals, after due pre amplification, filtering and denoising have been processed for extracting the features using Lab VIEW. As pilot study on English alphabets representing glottal, nasal, fricative, approximant, plosive and vowel type sounds. The facial EMG signals generated have been demonstrated using this system. This paper highlights their two features, i.e. peak frequency and dominant frequencies under each type of sound for respective alphabet have been extracted.
Keywords: SEMG, EMG, human speech, data acquisition, Bio signal processing, frequency spectrum, speech rehabilitation.
I. INTRODUCTION
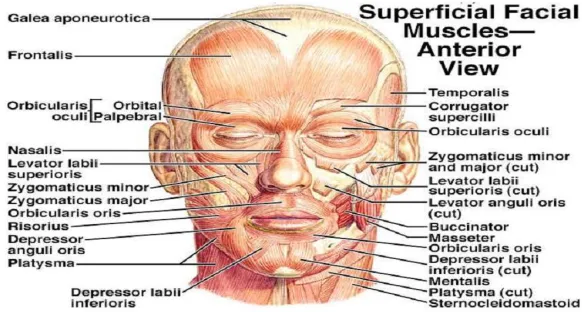
Electronic generation of human speech sounding like individual’s own natural voice is one of the major challenges before researchers. No systematic data or scientific studies related to human speech producing muscular activity verses natural spoken languages are available. Muscular activities are resultant of application of electrical potential under command and control of human brain via nervous system, technically called action potential. Humans generate speech by selective control of muscles on their faces in conjunction with the larynx, glottis, vocal cord, tongue, pharynx, etc. The major muscles that get activated to generate speech on the face of a person are zygomaticus major and minor, levator anguli oris, Masseter, and orbicularis oris (Fig. 1)
Non invasive recording of electrical current produced by ionic flow across muscle fiber membranes and transmitted through intervening tissuesat specific location on skin due to muscular activity is called surface Electromyography (SEMG).
The basic entity of a muscle is motor unit that generates a motor unit action potential (MUAP) when activated. In a muscular movement, several motor units are activated to generate motor unit action potential trains (MUAPT) that are superimposed to form the electro my ographic (EMG) signal [1].
Fig. 1 Muscles of the Face
Signal amplification and filtering plays a critical role in EMG based practical applications. Main challenge for such systems is to extract maximum true information and features out of the physiological EMG signals despite presence of artifacts and noise removal by filter circuits. The major functions of amplification and filtering process are to maximize signal to noise ratio and the minimize artifacts, noise and distortions present within the signal bandwidth of interest (typically 0-500 Hz). This paper presents a complete setup to pick up speech related SEMG signals. It makes use of differential amplification technique and an active band pass filter with Sallen Key architecture. [2]. Analog EMG signal scan be captured using small pre gelled Ag/AgCl electrodes and National Instrument’s USB-6009 hardware. Using specialized VIs (of LabVIEW), captured signals are further processed and analyzed. Subsequent sections of this paper elaborate the design, important parameters and a pilot test carried by speaking English letters. The analysis of the results of pilot test demonstrates and validates that the amplification, filtering circuit in conjunction with VIs of Lab VIEW could match with the human speech spoken during experiment test cases.
II. EMG SIGNAL AND THE NOISES
The amplitude of the EMG signal shows stochastic (random) nature and Gaussian distribution function can appropriately represent it. The signal amplitude has a range from 0 to 6 mV (peak-to-peak) or 0 to 1.5 mV (r.m.s.), while overall energy of the signal lies in the frequency band of 0 to 500 Hz, the dominant energy concentrates around 50-150 Hz range [3]. Outside this band, the electrical noise level dominates the signal and that indicate any EMG signal acquisition process gets easily influenced by noise. Such noise could be attributed to electronic and other parts used for signal detection and recording, the ambient noise from the electromagnetic and power line radiation in the environment, the motion artifacts with electrical signals (mainly within 0-20 Hz range) from the electrode-skin interface and from movement of the cable connecting the electrode to the amplifier. Inherent instability of the EMG signal with unstable components in 0-20 Hz range is attributed to the quasi-random nature of the firing rate of the muscular motor units [3]. Core characteristics of SEMG signals (amplitude, time and frequency) are influenced by the anatomical and physiological characteristics of muscles, the control mechanism of the nervous system, and the instrumentation involved. Multiple factors can have significant effect during capture of EMG signal, and therefore can adversely affect determination of feature extraction such as the timing and intensity of muscle contraction, the distance from the electrode to the target muscle, the amount of adipose tissue between the skin and the muscle, the properties of the electrode and the amplifier, and the contact between the skin and the electrode [4]. The articulatory muscles of face are engaged in the process of speech production. However, it is still a challenge for researchers to model and control facial movement. The research in this paper is an attempt to validate such a hypothesis i.e. relationship in facial muscles EMG signals with that of spoken speech (letters).
III. ELECTRODES AND PREAMPLIFIER
[image:3.612.161.452.86.242.2]close to the signal source. The output of preamplifier is fed to a band pass filter before amplifying it further. Finaloutput signal (post amplification and filtering) is fed to an analog-digital converter (ADC).
Fig. 2:
Amplification and filtering process for SEMG
A. Electrodes
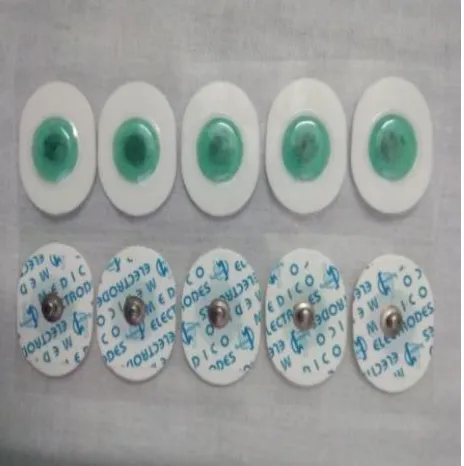
[image:4.612.192.424.288.521.2]The quality and the design of the electrodes directly and immediately affect the quality of capture of the EMG signals. Ability of an electrode in terms of its skin electrical contact and its proper placement is of utmost importance. Surface electrodes being non invasive have been preferred for this pilot study. They are economic, size effective and commonly available, and enable easy change of subject (human) for testing. Fig. 3shows the electrodes that can be used for capture of the signals from the facial muscles. Under the pilot study MLGST-07 (manufactured by Medico Electrodes International Ltd) pre gelled Ag/AgCl electrodes with a conducting diameter of 16 mm and adhesive diameter of 27 mm by 35 mm have been used.
Fig. 3: Typical Surface EMG Electrodes
B. Preamplifier
Fig. 4 depicts a schematic circuit of the preamplifier we have used. It uses Texas Instruments’ instrumentation amplifier INA128 and an operational amplifier OPA2604 as reference-driven pre amplifier and a shielding-driven circuit. INA128 is a low power, general purpose instrumentation amplifier offering excellent accuracy with very low offset voltage, drift and high common-mode rejection [5]. The gain, G,of this amplifier is governed by
= 1 +50 Ω (1)
where, RG is an external resistor.
EMG signal picked using electrodes is fed into the differential input pins of INA128. R1 and R2 comprise the gain resister RG. A
signal from the midpoint of R1 and R2is fed into OPA2604 to provide a guarding potential and a reference potential. Overall gain of
about 343 has been applied to weak EMG signals by employing a preamplifier circuit. We could maintain the stability and could avoid saturating the subsequent amplifier with this gain.
To ADC
SEMG Electrodes
Preamplifier Stage
High Pass Filter
Low Pass Filter
Fig.4: Reference and shielding-driven pre amplifier
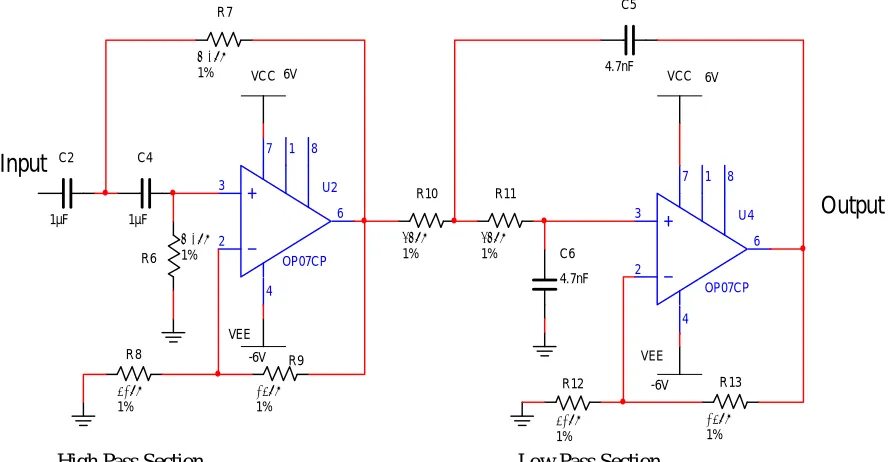
IV. BAND PASS FILTER
After preamplification, a band pass filter circuit is applied to restrict the useful signal within 10 to 500 Hz range.Like others, we used second order Sallen Key highpass filterwith cut off frequency of 10 Hz followed by asecond order Sallen Key low passfilter with cut off frequency 500 Hz [6, 7].
The corner frequency and the pass band gain of the second order Sallen Key high pass filter (Fig. 5) have been calculated using
= 1
2 √ (2)
= 1 + (3)
wherefc is the corner frequency andGpass is the passband gain.
Since the noises coupled into the circuitry from electromagnetic radiation are likely more towards higher frequency band, a second order Sallen Key low pass filter follows the high pass filter stage as shown in Fig. 5. Like others we used the corner frequency of the second order low pass filter as 500 Hz and the roll off rate -20dB/Decade [8].
High Pass Section Low Pass Section
Fig. 5: Schematic of secondorder SallenKey active filters
(Corner frequency of 20 Hz & 500 Hz and a roll off rate of -20dB/Decade)
R1 68Ω 1% R268Ω 1% C1 10pF R3 10kΩ U1A OPA2604AP 3 2 4 8 1 U1B OPA2604AP 5 6 4 8 7 R4 390kΩ R5 390kΩ U3 INA128P 6 4 7 3 2 5 1 8 VCC 6V VCC 6V VEE -6V VEE -6V U12 AmphenolMS3102R-14S-6S
IN1 -1 IN 1+ 2
IN 2-3 Re
f 4 S h i e l d 5
IN2 +6 SHIELD
BodyRef INAMP1+
INAMP1- Preamplifier CH 1
To HP Filter
U2 OP07CP 3 2 4 7 6 8 1 U4 OP07CP 3 2 4 7 6 8 1 C2 1µF C4 1µF C5 4.7nF C6 4.7nF R6 8.2kΩ 1% R7 8.2kΩ 1% R9 15kΩ 1% R10 68kΩ 1% R11 68kΩ 1% R13 15kΩ 1% R12 51kΩ 1% R8 51kΩ 1%
VCC 6V VCC 6V
VEE
-6V VEE
-6V
Input
[image:5.612.84.528.450.681.2]V. EXPERIMENT
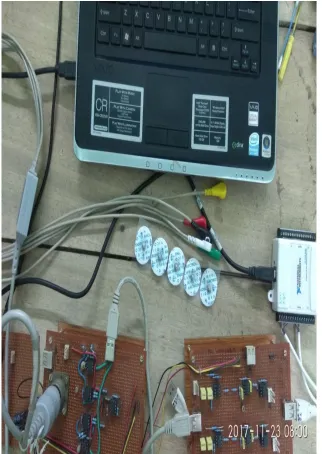
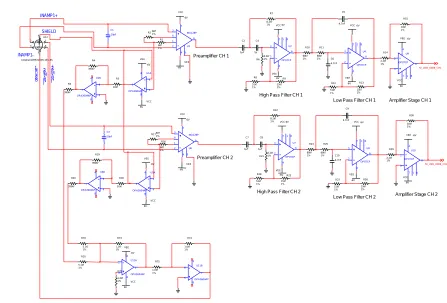
[image:6.612.147.469.169.623.2]Overall experimental circuit configured is illustrated in Fig. 6 and Fig. 7 shows schematic of the 2 channel SEMG data acquisition. After the electrodes and the pre-amplifier, the filtered signal is amplified and conditioned using USB-6009 DAQ card from National Instrument. The amplified and filtered EMG signal is sampled and recorded using Lab VIEW Biomedical Toolkit. Such a pair of amplified and filtered EMG signals from two muscles forming two channels is fed into differential analog inputs of DAQ card that is connected to computer through USB port. The Biomedical toolkit is used for logging the EMG data. The spectra of the EMG signals are analyzed using LabVIEW.
Fig. 6: Setup for Acquiring Speech Related EMG Signals
The recording of EMG signals is done at the rate five times the highest frequency i.e. at a sampling rate of 2500 Hz. 2500 Hz sampling rate tends to suppress effect of the frequencies above 1000 Hz as well offer reasonable size of the data generated.
Fig. 7: 2-Channel Circuit for Surface EMG Data Acquisition
Under parameters listed in Table I, the test is performed by collecting SEMG signal samples from a pair of facial muscles viz. zygomaticus major and levator anguli oris corresponding to one utterance each from six main categories of English alphabets i.e. vowel (letter A), plosive (letter P), fricative (letter F), nasal (letter M), approximant (letter W), and glottal (letter H). For each alphabet (A/P/F/M/W/H), the test is repeated twenty times and twenty sets of data are collected. 8000 samples of each test alphabet are recorded at 2500 Hz frequency [9], [12]. The experimental data are stored in data files using Biomedical Toolkit and then transferred intoLabVIEW software where denoising and time-frequency analysis is done. Channel 1 has been used for recording zygomaticus major while channel 2 picks up signals of levator anguli oris muscles on the left side of human face. The recording period is set to be 3.2 seconds but the actual speech is produced (recorded) for less than a second somewhere in mid during 3.2 seconds, as the rest (pre and post actual speech) being silence period.
Table I: Experimental Parameters
Electrode Placement
Inter electrode spacing
Corner Frequencies Approximate Circuit Gain
CH-1 CH-2 High Pass Low Pass Pre
amplifier Amplifier
Zygomaticus Major
Levator
Anguli Oris 2 cm 10 Hz 500 Hz 353 13
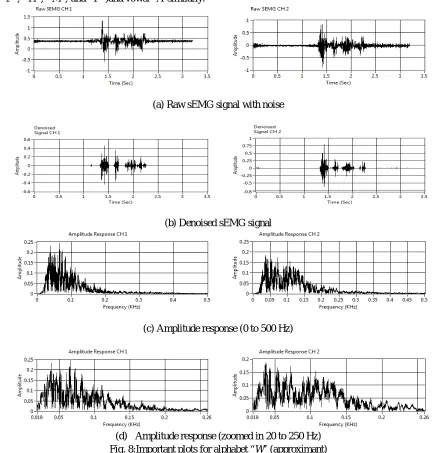
VI. DATA ANALYSIS
LabVIEWVIs are used to analyze experimental data, noise removal and to display EMG signal waveforms [10], [11]. The clean signal so obtained is normalized and the amplitude response is performed by FFT. The spectra of both channels for all the test alphabets are plotted. The raw and denoised SEMG signal plots for both the channels for one of the test alphabets, W, as obtained are shown under Fig. 8. The plot 8(a) depicts raw EMG, 8(b) show denoised signal, 8(c) draw amplitude response while 8(d) exhibits dominant
R1 68? 1% R268? 1% C1 10pF R3 10k? U1A OPA2604AP 3 2 4 8 1 U1B OPA2604AP 5 6 4 8 7 R4 390k? R5 390k? U3 INA128P 6 4 7 3 2 5 1 8 VCC 6V VCC 6V VEE -6V VEE -6V U2 OP07CP 3 2 4 7 6 8 1 U4 OP07CP 3 2 4 7 6 8 1 C2 1µF C4 1µ C5 4.7nF C6 4.7nF R6 8.2k? 1% R7 8.2k? 1% R9 15k? 1% R10 68k? 1% R11 68k? 1% R13 15k? 1% R12 51k? 1% R8 51k? 1%
VCC 6V VCC 6V
VEE -6V VEE -6V U9 OP07CP 3 2 4 7 6 8 1 R14 2.2k? 1% R15 10k? 1% VCC 6V VEE -6V NI_USB_6009_CH1 R16 68? 1% R1768?1%
C3 10pF R18 10k? U5A OPA2604AP 3 2 4 8 1 U5B OPA2604AP 5 6 4 8 7 R19 390k? R20 390k? U6 INA128P 6 4 7 3 2 5 1 8 VCC 6V VCC 6V
VCC 6V VCC 6V
VCC 6V VEE -6V VEE -6V VEE -6V VEE -6V VEE -6V U7 OP07CP 3 2 4 7 6 8 1 U8 OP07CP 3 2 4 7 6 8 1 C7 1µF C8 1µF C9 4.7nF C10 4.7nF R21 8.2k? 1% R22 8.2k? 1% R23 15k? 1% R24 68k? 1% R25 68k? 1% R26 15k? 1% R27 51k? 1% R28 51k? 1% U10 OP07CP 3 2 4 7 6 8 1 R29 2.2k? 1% R30 10k? 1% NI_USB_6009_CH2 U11A OPA2604AP 3 2 4 8 1 U11B OPA2604AP 5 6 4 8 7 R35 5.1k? 1% R70 5.1k? 1% R73 1.2k? 1% R74 1.0k? 1% R75 1.0k? 1% R76 1.2k? 1% VCC 6V VEE -6V U12 AmphenolMS3102R-14S-6S IN1-1 IN1+ 2 IN2-3 R e f 4 S h i e l d 5 IN2+6 SHIELD B o d y R e f INAMP1+ INAMP1-I N A M P 2 + I N AM P 2
-Preamplifier CH 1
Preamplifier CH 2
High Pass Filter CH 1
High Pass Filter CH 2
Low Pass Filter CH 1
Low Pass Filter CH 2
Amplifier Stage CH 1
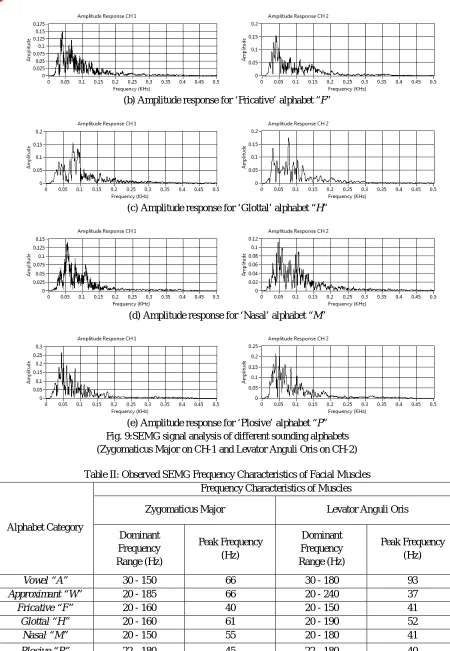
[image:7.612.73.536.564.670.2]frequency range. The pause period (silence) can also be observed in fig. 8 (b). Fig. 9 shows the amplitude responses of different consonants(“F”, “H”, “M”, and “P”)and vowel “A”similarly.
(a) Raw sEMG signal with noise
(b) Denoised sEMG signal
(c) Amplitude response (0 to 500 Hz)
[image:8.612.88.523.98.551.2](d) Amplitude response (zoomed in 20 to 250 Hz) Fig. 8:Important plots for alphabet “W” (approximant)
(Zygomaticus Major on CH-1 and Levator Anguli Oris on CH-2)
(b) Amplitude response for ‘Fricative’ alphabet “F”
(c) Amplitude response for ‘Glottal’ alphabet “H”
(d) Amplitude response for ‘Nasal’ alphabet “M”
[image:9.612.79.529.65.716.2] [image:9.612.72.541.541.727.2](e) Amplitude response for ‘Plosive’ alphabet “P” Fig. 9:SEMG signal analysis of different sounding alphabets (Zygomaticus Major on CH-1 and Levator Anguli Oris on CH-2)
Table II: Observed SEMG Frequency Characteristics of Facial Muscles
Alphabet Category
Frequency Characteristics of Muscles
Zygomaticus Major Levator Anguli Oris
Dominant Frequency Range (Hz)
Peak Frequency (Hz)
Dominant Frequency Range (Hz)
Peak Frequency (Hz)
Vowel “A” 30 - 150 66 30 - 180 93
Approximant “W” 20 - 185 66 20 - 240 37
Fricative “F” 20 - 160 40 20 - 150 41
Glottal “H” 20 - 160 61 20 - 190 52
Nasal “M” 20 - 150 55 20 - 180 41
VII. CONCLUSIONS
This paper discusses the design issues and complexities for acquisition of surface EMG signal generated for speech, their amplification and filtering. The system is tested for SEMG data from two channels, via data collection in a PC using NI USB-6009 DAQ card. The noise could be successfully suppressed from the acquired SEMG signals using this setup. The amplitude response so obtained indicates the 10 to 500 Hz frequency band for all categories of alphabets. Various analytical plots show the dominant frequencies lie mostly in 20 to 200 Hz. The peak frequencies range between 40 to 70 Hz for zygomaticus muscles whereas on levator anguli oris muscles it is up to 240 Hz. The plosive (P) and fricative (F) have lowest peak frequency as compared to glottal (H) and nasal (M) whereas the peak frequency for vowel (A) and approximant (W) is highest. The results also demonstrate the usefulness of a battery operated system in eliminating the power line noises.
REFRENCES
[1] C. J. De Luca, Electromyography. Encyclopedia of Medical Devices and Instrumentation, pp. 98-109, 2006
[2] J. Wang, L. Tang, and J. E. Bronlund, “Surface EMG Signal Amplification and Filtering”, International Journal of Computer Applications, vol. 82, no. 1, pp.
15-22, 2013
[3] C. J. De Luca, “Surface electromyography: Detection and Recording”, DelSys Incorporated, 2002
[4] S. Day, “Important Factors in Surface EMG Measurement”, Calgary: Bortech Biomedical Ltd, 2002
[5] INA128 Datasheet, 2005”, Texas Instruments Incorporated
[6] Cosmanescu, B. Miller, T. Magno, A. Ahmed, and I. Kremenic, Design and Implementation of a Wireless (Bluetooth®) Four Channel Bio-Instrumentation
Amplifier and Digital Data Acquisition Device with User-Selectable Gain, Frequency, and Driven Reference. pp. 2053-2056
[7] C. J. De Luca, L. D. Gilmore, M. Kuznetsov, and S. H. Roy, “Filtering the surface EMG signal: Movement artifact and baseline noise contamination”, Journal of
Biomechanics, vol. 43, no. 8, pp. 1573-1579, 2010
[8] Analysis of the Sallen-Key Architecture”, Texas Instruments Incorporated, 1999
[9] M. A. Oskoei, and H. Huosheng, “Support Vector Machine-Based Classification Scheme for Myoelectric Control Applied to Upper Limb”, Biomedical
Engineering, IEEE Transactions on, vol. 55, no. 8, pp. 1956-1965, 2008
[10] A. Phinyomark, A. Nuidod, P. Phukpattaranont, and C. Limsakul, “Feature extraction and reduction of wavelet transform coefficients for EMG pattern
classification”, ElektronikairElektrotechnika, vol. 122, no. 6, pp. 27-32, 2012
[11] C. Jun-Uk, M. Inhyuk, and M. Mu-Seong, “A Real-Time EMG Pattern Recognition System Based on Linear-Nonlinear Feature Projection for a Multifunction
Myoelectric Hand.”, Biomedical Engineering, IEEE Transactions on, vol. 53, no. 11, pp. 2232-2239, 200
[12] R. H. Hosking, Critical Techniques for High-Speed A/D Converters in Real-Time Systems, 2012
[13] S. Yacoub, K. Raoof, and H. Eleuch, “Filtering of Cardiac and Power Line in Surface Respiratory EMG Signal”, Applied Mathematics & Information Sciences,
An International Journal on, vol. 4, no. 3, pp. 365-382, 2010
[14] A. B. Sankar, D. Kumar, and K. Seethalakshmi, “Performance study of various adaptive filters algorithms for noise cancellation in respiratory signals,” Signal
Processing: An International Journal (SPIJ), vol. 4, no. 5, pp. 267, 2010
[15] C. J. De Luca, M. L. Kuznetsov, D. Gilmore, and S. H. Roy, “Inter-electrode spacing of surface EMG sensors: Reduction of crosstalk contamination during