Detection of Built-up Areas from High Resolution
Satellite Images
Mohammad Taha
1, Geeta Hanji
2, M. V. Latte
31,2Department of ECE, PDACE, Gulbarga, Karnataka, 3Principal, JSSATE, Bangalore, Karnataka
Abstract- With the advancement in remote sensing technology, high resolution remote sensing have become a key source of information in many application platforms such as urban development, agriculture monitoring, military, intelligence, disaster relief is a high resolution remote sensing applications. Since there is a tremendous advancement in remote sensing technology, Among many of its applications, built-up area detection and land development management is an important application domain of high resolution satellite imagery, because it provides quantitative analysis in the distribution of population of a particular area of interest. This paper proposes an approach to simultaneously detect the manmade areas from the satellite images. Our approach consist of two major steps: preprocessing using a nonlinear filtering to enhance the images and its components and active contour without edge model to simultaneously extract the boundaries of built-up areas. Nonlinear Filtering helps to remove noisy image components to the large extent and Active Contour model has an advantage to detect an object in noisy 2D images. This model works on the principle of evolving a curve from a given image, in order to detect the objects from the images.
Keywords
—
Built-up area detection, preprocessing, Median filtering, Segmentation, Active contour without edge.I. INTRODUCTION
A dynamic and challenging problem in urbanization is built-up area detection on the land. Cities are fast developing with the world’s population and have experienced continuous growth. With the advancement in remote sensing technologies, high-resolution remote sensing images have become critical sources of information fields such as city planning, geography, surveillance etc. Built-up area represents an environment on the land which is composed of both manmade and natural objects. Major approaches for built-up area detection are based on texture analysis, because the texture of the scene is distinct from that of the natural scene. Thus, it is tedious task for a human expert to extract the information from the satellite images. Automated urban-area and building-detection methods using VHR satellite and aerial images by scale invariant feature transform (SIFT) along graph theory to detect buildings and built-up areas form satellite images is proposed in [5]. One of the most important characteristics associated with the panchromatic satellite
SUSAN detector, Harris detector, wavelet based detector and blob detector are some famous corner detection techniques. SUSAN can work well when the noise is present because this corner detector does not require derivative. In [10], authors compared the performance of those two detectors in terms of complexity, stability, and execution time. The simulation results showed that Harris detector is better performing than SUSAN detector. Recently, an improved Harris method with using the multi-scale topological features was presented in [19]. This technique uses topological features to reduce the range of Harris corner detector. Remote sensing is a process of acquiring the information about the area or object at the earth surface without being in direct contact with the area of interest or object. Principle step in differentiating manmade areas and natural scenes is the texture of scene, because the texture of the manmade scene is different from natural scene. For this reason, many manmade or built-up areas techniques are based on the basis of texture analysis. An unsupervised approach is proposed based on the frequently recurring pattern of manmade object (e.g. building) is presented in [1]. Using Ikonos and Quickbird images as a data set in [1], accuracy up to 86% is obtained. A technique based on morphological segmentation proposed in [6], uses Gabor filter to extract the local feature points. Afterwards spatial voting used in [6] to vote the candidate built-up areas. With the advancement in remote sensing technology, the resolution of satellite image gets increased. Quite simply, high resolution means more information can be extracted from it. From the high resolution satellite images, our aim is to simultaneously detect the entire built-up areas from them. Our approach is divided into two major steps: firstly preprocessing, wherein, the image conversion and noise removal are performed for better results. In the second step, detection of built-up and non-built-up areas is performed. For built-up area boundary detection, we have used the active contour model without edge. This model has a most achievable background in the image processing application. Active contour model, also called as Snake, is a framework for delineating an object outline from possibly noisy 2D images [2]. In [3], based on techniques of curve evolution, Mumford–Shah functional for segmentation and level sets, the model for active contours to detect objects in a given image is presented. Afterwards, the color classification based on built-up and non-built-up areas are performed.
II. DESCRIPTION OF THE WORK
With the advancement of remote sensing technology, high resolution satellite images become more important in providing the valuable source of information in many application platforms. From the set of high resolution satellite images, our aim is to simultaneously detect the built-up areas from them. Our work is divided into two major steps:
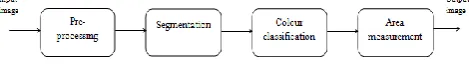
[image:3.595.312.547.298.333.2]i) Preprocessing and ii) detection of built-up areas with boundaries.
Fig. 1 Flow diagram of proposed approach
A) Preprocessing
Generally, images are often corrupted by random variations in intensity, illumination, or have poor contrast. In order to improve the quality and enhance the image features, preprocessing is performed. Image Preprocessing aims at performing geometric and radiometric correction in order to enhance the characteristic of the images. In our method we have used median filtering to improve the quality of the noisy image. Filtering is a process which transforms pixel intensity values to reveal the certain image characteristics. In median filtering, each pixel value is replaced with the median of gray values in the region of pixels. Median filtering method is very effective in removing salt and pepper and impulsive noise while preserving the details of images.
B) Boundary extraction of built-up areas
Active contour model, also called as Snake is a framework for delineating an object outline from possibly noisy 2D images. In order to detect objects in the images, basic idea of active contour models or snakes is used to evolve a curve. The curve moves towards the interior side of object to be detected and has to stop on the boundary of the object.
According to [2], a general edge detector can be defined by a positive decreasing function ‘ ’depending on the gradient of the image as
where, is positive decreasing function
For instance,
(2)
Where , a smoother version of is the convolution of the image with the Gaussian
function . The function
is positive in homogeneous regions, and zero at the edges. In order to obtain a mathematically easier minimization problem, Active contour [2] introduced a piecewise constant approximation to the well-known functional formulation of image segmentation by Mumford and Shah [3].In the active contour models or snakes, the idea is to evolve a curve subject to constraints from a given image in order to detect the objects in that image. The fitting term is given by,
(3)
Where, C is any other curve variable inside(c) denotes region outside(c) denotes region c1 and c2 constants are the averages of inside C and outside of C respectively, depends on C. An energy associate with lines, which represent the
object boundaries or the moving contour. Then an evolution equation for the moving contour is derived to find the object boundaries by minimizing the total energy. The level set framework is used for the moving contour to handle the topological changes. Fitting term minimization is dependent upon parameter F1(C) and F2(C). To do this, fitting term minimizer is given by,
(4)
The conditions for the above equation are
; If curve C is outside the object
; If curve C is inside the object
Finally, the fitting energy is minimized if;
(5)
Which means curve is on the boundary of the object.
The Mumford-shah functional can be define as
(6)
With the parameters , . The parameters λ and µ are the positive parameters.
Fig.3 Curve C = {(x; y): Ø(x; y) =} propagating in normal direction
Therefore, we consider the minimization problem:
.
In this model, for the minimum partitioning problem;
The conditions are;
Further, solution for the level set formulation can be given by this model as,
(7)
An important step for the Chan-Vese algorithm, which we can refer as the “fitting energy” functional. The goal of this segmentation algorithm will be to minimize this fitting energy
for a given image, and the minimizing level set function Ø will define the segmentation. For minimizing energy, model presented in [2], keeps Ø fixed.
Thus, c1 and c2 are given as follows.
(8)
If,
And
(9)
If,
The c1 and c2 are given by
=average ( ) in {Ø≥0}
=average ( ) in {Ø<0} (10)
Further, the initial level set is evolve by using partial differentiation, given by
(11)
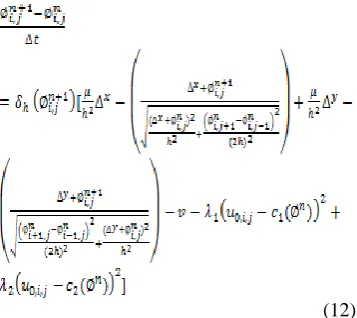
In order to solve this PDE numerically, we must discretize it. Let denote the value of the level set function Ø at pixel
(i, j) at iteration n. For finding, i.e. reinitializing factor, the equation is referred by [2], this factor is used to reinitialize the parameters to define boundary on object (or built-up areas). Thus initialization factor mathematically expressed as follows. When working with level sets and Dirac delta
Average ( ) inside C
functions, a standard procedure is to reinitialize to the signed distance function to its zero-level curve. This prevents the level set function to become too flat, or it can be seen as a rescaling and regularization.
(12)
Further, the Heaviside function (H) is a non-continues function, it is an integral of Dirac delta function i.e. H′ = δ
Expanding Heaviside function as,
[image:6.595.41.220.202.361.2](13)
Fig. 4 The Heaviside step function, using the half-maximum
Convention
The following are the various steps used in our work:
Step 1: Insert input image in proper format.
Step 2: Apply median filter to input image.
Step 3: Initialize Ø0 by Ø0, n=0 in (2)
Step 4:Compute the values of c1 and c2 from equation (8) and (9) respectively.
Step 5: Evolve level set function for active contour
Step 6: Apply sign distance function (SDF) to the curve.
Step 7: Check whether solution is stationary. If not, n=n+1 and repeat step 4
Step 8: Perform color classification on image
Step 9: Measure area of respective image, which is the required built-up area.
III. EXPERIMENTAL RESULTS
High resolution satellite images covering different scenes of different cities are used as test images. The images are taken from different satellite of different spatial resolutions along with aerial images covering different scenes of earth. Also images from the highly density areas (like Mumbai, Ukraine) taken to observe the robustness of the proposed method. All the images are available on the following sources.
a. www.satelliteimagingcorp.com
b. visibleearth.nasa.gov
c. www.digitalglobe.com
d. maps.google.com
have calculated FPRs and TPRs for each images, and mean of each dataset is presented in table to clearly quantify the accuracy on the basis of data sets. On the basis of our calculated results, proposed approach provides average TPR of 96% and average FPR of 2.6% , which is considerd as a very good detection result.
Table -I: Description of data set
Satellite name No. of images
Aerial images 24
Geo Eye 10
IKONOS 10
Quick bird 7
Pleiades 3
World view-II 2
Total images 56
Further to clearly different beteween the built-up and non-built-up areas, color classification on high resolution satellite images is also performed.
IV. CONCLUSIONS
In this paper, we implemented a method to detect the built-up areas form the high resolution satellite images. Preprocessing is performed in the first step. Mumford-shah segmentation technique based active contour model is used for delineating
the boundaries man made areas. The model is able to detect an object whose boundary is no necessarily defined. The active contour model also deals with mean curvature flow, while evolving the boundary stopping term parameter does not depends upon the gradient of image, it will stop at desired boundary. We have also implemented the color classification technique in our work. On the basis of the results obtain, we can say the accuracy of the built-up areas detected the high resolution satellite images is 96% on an average.
Table II: Average values of computational time, FPR and TPR results obtain from total 56 images
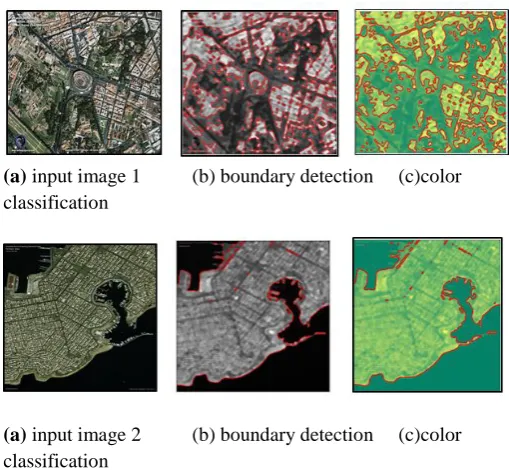
A) Built-up area detection result
(a) input image 1 (b) boundary detection (c)color classification
(a) input image 2 (b) boundary detection (c)color classification
Dataset Avg. time in sec
Avg. FPR in %
Avg.TPR in %
Aerial 5.5245 2.8415 96.665
Geo Eye 4.0191 2.2967 96.483
IKONOS 4.8936 2.7675 96.735
Quick bird 4.5378 2.4495 96.612
Pleiades 5.7833 2.5691 96.277
World view-II
[image:7.595.302.557.438.673.2](a) input image 3 (b) boundary detection (c)color classification
(a) input image 4 (b) boundary detection (c)color classification
Fig.5 Built-up area detection results
ACKNOWLEDGMENT
We would like to express our greatest gratitude to HOD (E&CE Dep.) and Principal, PDACE, Gulbarga for providing opportunity to do research work. And we also thanks to the people who have helped & supported us throughout this research.
REFERENCES
[1] Chao Tao, Yihua Tan, Zheng-rong Zou, and Jinwen Tia, “Unsupervised Detection of Built-Up Areas From Multiple High-Resolution Remote Sensing Images” , Geoscience and Remote Sensing Letters, IEEE vol. 10, no. 6, pp. 1300-1304, November 2013.
[2] Tony F. Chan, Member, IEEE, and Luminita A. Vese “Active Contours Without Edges” IEEE transactions on image processing, vol. 10, no. 2, february 2001
[3] D. Mumford and J. Shah, “Optimal approximation by piecewise smooth functions and associated variational
problems,” Commun. Pure Appl. Math, vol. 42, pp. 577–685, 1989.
[4] C.Ünsalan and K. L. Boyer, “Classifying land development in highresolution panchromatic satellite images using straight-line statistics,” IEEE Trans. Geosci. Remote Sens., vol. 42, no. 4, pp. 907–919, Apr. 2004.
[5] B. Sirmacek and C. Unsalan, “Built-up-area and building detection using SIFT keypoints and graph theory,” IEEE Trans. Geosci. Remote Sens., vol. 47, no. 4, pp. 1156–1167, Apr. 2009.
[6] B. Sirmacek and C. Unsalan, “Built-up area detection using local feature points and spatial voting,” IEEE Geosci. Remote Sens. Lett., vol. 7, no. 1, pp. 146–150, Jan. 2010.
[7] C. G. Harris and M. Stephens, “A combined corner and edge detector,” in Proc. 4th Alley Vis. Conf., 1988, pp. 147–151.
[8] Optimal Approximations by Piecewise Smooth Functions and Associated Variational Problems’ by DAVID MUMFORD Harvard University ANDJAYANT SHAH Northeastern University
[9] Zhenxing Luo “Survey of Corner Detection Techniques in Image Processing” International Journal of Recent Technology and Engineering, Volume-2, Issue-2, May 2013
[10]S. M. Smith and J. M. Brady, “Susan - a new approach to low level image processing,” International Journal of Computer Vision, vol. 23, no. 1, pp. 45–78, 1997.
[11] Z. Li-hui, C. Jie, Z. Juan, and D. Li-hua, "The Comparison of Two Typical Corner Detection Algorithms," in Proc. of the Second International Symposium on Intelligent Information Technology Application, 2008, pp. 211-215.
IEEE Transactions on Image Processing, vol.21, no.9, pp.4167-4179, Sept. 2012.
[13]Leena Matikainen, Juha Hyyppä, and Marcus E. Engdahl “Mapping Built-up Areas from Multitemporal Interferometric SAR Images – A Segment-based Approach” Photogrammetric Engineering & Remote SensingVol. 72, No. 6, June 2006, pp. 701–714.
[14] Hanqiu Xu “Extraction of Urban Built-up Land Features from Landsat Imagery Using a Thematicoriented Index Combination Technique” Photogrammetric Engineering & Remote Sensing Vol. 73, No. 12, December 2007, pp. 1381–1391.
[15] Yun Zhang “detection of urban housing development using multisensor satellite data and maps” German Aerospace Center, Institute of Planetary Exploration Rudower Chaussee 5, 12489 Berlin, Germany
[16] Ni-Bin Chang et al. “Change detection of land use and land cover in an urban region with SPOT-5 images and partial Lanczos extreme learning machine”
Journal of Applied Remote Sensing, Vol. 4, 043551 November-2010
[17] G. Xinting, Z. Wenbo, F. Sattar, R. Venkateswarlu, and E. Sung, "Scale-space Based Corner Detection of Gray Level Images Using Plessey Operator," in Proc. of the Fifth International Conference on Information, Communications and Signal Processing, 2005, pp. 683-687.
[18] G. Xinting, F. Sattar, and R. Venkateswarlu, "Multiscale Corner Detection of Gray Level Images Based on Log-Gabor Wavelet Transform," IEEE Transactions on Circuits and Systems for Video Technology, vol. 17, pp. 868-875, 2007.
[19] Z. Ding and A. Ma, "Harris corner detection based on the multi-scale topological feature," in Proc. of the 2011 International Conference on Computer Science and Network Technology, pp.1394-1397, Dec. 2011.
[20]G. Aubert and L. Vese, “A variational method in image recovery,” SIAM J. Numer. Anal., vol. 34, no. 5, pp. 1948–1979,