M E T H O D
Open Access
dStruct: identifying differentially reactive
regions from RNA structurome profiling data
Krishna Choudhary
1, Yu-Hsuan Lai
2, Elizabeth J. Tran
2,3and Sharon Aviran
1*Abstract
RNA biology is revolutionized by recent developments of diverse high-throughput technologies for transcriptome-wide profiling of molecular RNA structures. RNA structurome profiling data can be used to identify differentially structured regions between groups of samples. Existing methods are limited in scope to specific technologies and/or do not account for biological variation. Here, we present dStruct which is the first broadly applicable method for differential analysis accounting for biological variation in structurome profiling data. dStruct is compatible with diverse profiling technologies, is validated with experimental data and simulations, and outperforms existing methods.
Keywords: RNA structure, Structure probing, Differential analysis, Transcriptome-wide profiling, SHAPE, DMS, PARS
Background
RNA molecules adopt diverse and intricate structures, which confer on them the capacity to perform key roles in myriads of cellular processes [1,2]. Structures, and hence functions, of RNAs are modulated by a number of factors, such as solution environment (in vivo or in vitro), pres-ence of RNA-binding proteins or ligands, mutation in the RNA sequence, and temperature [3]. The amalgamation of classic chemical probing methods, which probe RNA structure at nucleotide resolution, with next-generation sequencing has ushered in a new era of RNA structur-omics [2, 3]. In fact, recent developments have led to a diversity of structure probing or structure profiling (SP) technologies [4,5]. These technologies have made it possi-ble to perform comparative analysis of structures of select RNAs or whole RNA structuromes simultaneously [6–21]. SP technologies result in nucleotide-level scores, called as reactivities, that summarize one or more aspects of local structure (e.g., steric constraint due to base pair-ing interaction). To this end, they utilize probpair-ing reagents that react with RNA nucleotides in a structure-sensitive manner. The degree of reaction at a nucleotide is a func-tion of local stereochemistry. A number of reagents (e.g., SHAPE, DMS, nucleases) exist, which react with sensitiv-ity to different aspects of local stereochemistry [22–24].
*Correspondence:[email protected]
1Department of Biomedical Engineering and Genome Center, University of California, Davis, One Shields Avenue, Davis 95616, CA, USA
Full list of author information is available at the end of the article
Moreover, depending on the reagent, the reaction results either in chemical modification of the sugar/base moiety or a cleavage of the RNA strand. Its degree is captured in a cDNA library through primer extension by reverse transcriptase, which either stops at modified nucleotides or proceeds but introduces a mutation [3]. In addition, to assess the background noise, most SP technologies use samples that are not treated with reagent [19,25–28]. Fur-thermore, there are diverse library preparation methods. For example, some methods enrich for modified tran-script copies [7, 29]. Indeed, SP technologies differ in their choices of probing reagents and key library prepara-tion steps. Yet, each technology has its advantages, which might make it the preferred choice for certain studies. Irrespective of the SP technology and end goals of a study, cDNA libraries are sequenced and data is processed to obtain reactivities. Often, this involves combining infor-mation from the treated and untreated control samples [19, 30–32]. The sequence of nucleotide reactivities for a transcript is called itsreactivity profile. It is notewor-thy that reactivity profiles are estimated using approaches customized to the SP technology used for a study [6]. Hence, different approaches yield reactivities with differ-ent statistical properties [33,34]. Nonetheless, amid the diversity of protocols and reactivity estimation methods, identifying differentially reactive regions (DRRs) is a com-mon step in the majority of SP studies [6]. In this article, we focus on identifying DRRs from SP data.
Several methods have been developed for differential analysis of SP data [8, 9, 20, 21, 35]. They utilize two common principles. First, they premise that differential structure manifests at a regional level and not at individ-ual isolated nucleotides. Second, they recognize that SP data manifests substantial noise at the nucleotide level. Despite these shared principles, these methods differ in how they account for noise in the data. deltaSHAPE [8] and StrucDiff [9] address nucleotide-level noise by smoothing reactivity or count profiles. Subsequently, they find DRRs from smoothed profiles. Note that we call the method developed by Wan et al. StrucDiff after the name of the score it employs. In contrast, the method included in the PARCEL pipeline assesses the significance of changes in counts at the nucleotide level first. It con-siders nucleotides as “genes” in an RNA-seq model. To this end, it uses edgeR [36] to account for nucleotide-level noise and computepvalues for changes in counts. Next, it chains together nucleotides with significant changes as DRRs by performing a second statistical test [21] (hence-forth, we refer to this method as PARCEL). Similarly, Mizrahi et al. account for nucleotide-level noise with a two-step “regression and spatial analysis” approach [20] (for convenience, we acronymize this method as RASA). Specifically, to evaluate the changes in reactivities at the nucleotide level, they use generalized mixed model exten-sion of logistic regresexten-sion with counts and coverages as inputs. Next, they identify the regions with clusters of dif-ferentially reactive nucleotides using a permutation test. Another method, classSNitch, utilizes a machine learning classifier that learns from training data how to distinguish between nucleotide-level noise and DRRs [35].
Despite notable developments in existing methods, sev-eral key challenges remain unaddressed. First, it is known that different regions in RNAs manifest different levels of variation among biological replicates (henceforth, called biological variation) [30,37–40]. Hence, inherently vari-able regions should be distinguished from DRRs. Indeed, DRRs are expected to differ consistently between the two groups of samples distinguished by a structure-altering factor. Furthermore, between-group variation in DRRs should significantly exceed the variation between sam-ples of the same group. However, deltaSHAPE, StrucDiff ,and classSNitch do not account for biological varia-tion. While PARCEL and RASA account for biological variation, they are limited in scope to specific technolo-gies. One issue that underlies this limitation is that they do not utilize untreated samples. Yet, untreated sam-ples are an integral component of most SP technolo-gies [6,7,19,25–28]. Importantly, combining information from both treated and untreated samples has been shown to provide accurate assessment of reactivities [30–32]. Furthermore, broadly applicable approaches for estimat-ing reactivities combine information from the two kinds
Yet, it has been demonstrated that specialized methods accounting for signal patterns in ChIP-seq and bisulfite sequencing data can improve power to detect differential regions [50,51].
To address the aforementioned limitations of existing methods, we present dStruct, which identifies DRRs from SP data within a single RNA or a transcriptome. Cen-tral to dStruct is a dissimilarity measure, calleddscore. dStruct starts by assessing within-group and between-group variations in reactivities, in terms of nucleotided scores (Figs.1and2a, b). Due to the effect of structure-altering factors in DRRs, the between-group variation is expected to be higher than the within-group varia-tion (Fig. 1b). Hence, next, dStruct screens for regions with evidence of increaseddscores between groups. This step is skipped if a predefined set of candidate regions is available. Finally, dStruct compares the within-group nucleotidedscores with the between-group scores using Wilcoxon signed-rank test and controls the FDR using
A1
*
A2
*
B1 *
B2 *
1 5 10
−5 0 5
−5 0 5
−5 0 5
−5 0 5
Nucleotide
Reactivity
a
(A1, A2)*
(A1, B1) *
1 5 10
0.0 0.5 1.0
0.0 0.5 1.0
Nucleotide
d
score
b
0.0 0.5 1.0
0 5 10 15 20
σ / |μ|
d
score
c
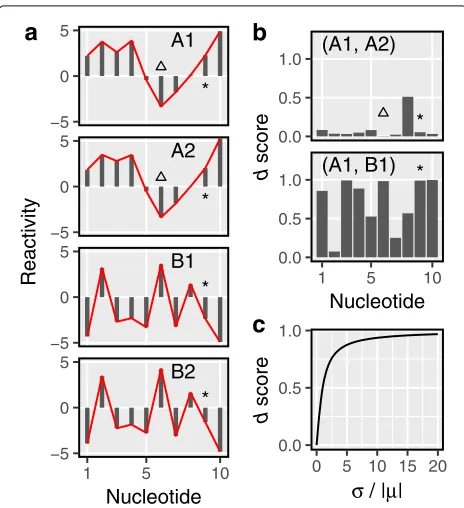
Fig. 1Thedscore quantifies the dissimilarity between reactivities.a Four hypothetical reactivity profiles, labeled A1 and A2 (group A) and B1 and B2 (group B). Red lines highlight the reactivity patterns. Triangles mark a nucleotide that maintains identical reactivities within groups. Asterisks mark a nucleotide that flips its reactivity between groups.bComparison of samples from the same group (e.g., A1, A2) results indscores lower than those from between-group
comparisons (e.g., A1, B1). A triangle highlights the lowdscore of a nucleotide with high within-group agreement. An asterisk highlights a nucleotide that displays high within-group agreement and therefore results in a low within-groupdscore. It also displays poor between-group agreement, which results in a high between-groupd
score.cThedscore monotonically increases with the absolute value of coefficient of variation
the Benjamini-Hochberg procedure [52, 53]. dStruct is the first differential analysis method that both directly accounts for biological variation and is applicable to diverse SP protocols. We validated dStruct with data from different SP technologies, namely, SHAPE-Seq, Structure-Seq, and PARS, as well as with simulations. Test datasets vary in size from single RNAs to transcriptomes and fea-ture samples from bacteria, virus, fungi, and humans. In addition, the structure-altering factors include protein binding, ligand binding, and single-nucleotide variants. Besides utilizing real data, we developed a novel approach to simulate biological replicates of SP data. In particular, existing approaches do not provide a way to generate cor-related biological replicates [54, 55]. We addressed this gap to allow for proper assessment of dStruct’s perfor-mance. dStruct enables guided as well as de novo dis-covery. In all tests, we demonstrate that for a properly controlled FDR, dStruct has a higher power than exist-ing methods. Besides validations, we discuss in detail the limitations of dStruct as well as of existing approaches.
Results
Dissimilarity measure
We define a dissimilarity measure for reactivities, which we call adscore. Given a transcript of lengthnand a set of mreactivity profiles for the transcript, letrijrepresents the
reactivity of nucleotideiin profilej. Ifσiandμirepresent
the sample standard deviation and mean of reactivities for nucleotidei, respectively, then thedscore of nucleotidei is defined as:
di =
2 π arctan
σi
|μi|
. (1)
Form=2, the above expression simplifies to:
di =
2 πarctan
√
2ri1−ri2 ri1+ri2
. (2)
Taking the ratio ofσi andμi accounts for the fact that
higher reactivities tend to manifest higher fluctuations [56]. However, the ratio by itself is very sensitive to small changes in μi, especially when μi is small. For
exam-ple, PARS reactivities can be both positive and negative (Fig. 1a). This can result in μi being close to 0, while σi remains high (e.g., nucleotide highlighted with aster-isks in Fig. 1a). Importantly, σi/|μi| increases very fast
and approaches infinity asμi decreases and approaches zero (Additional file1: Figure S1). However, the dStruct pipeline involves taking means of di as we describe
below. Since the mean is not robust to outliers, extremely high values ofσi/|μi| could pose problems in the dStruct
pipeline. Hence, we reduce the sensitivity of σi/|μi| to
changes inμiby transforming it with the arctan function.
Whileσi/|μi|is unbounded, its arctan-transformed value is
[image:3.595.58.290.331.585.2]A1
A2
B1
B2
1 100 200 300
0.0 1.5 3.0
0.0 1.5 3.0
0.0 1.5 3.0
0.0 1.5 3.0
Nucleotide
Reactivity
a
Estimate
d
withinand
d
betweenwithin
between
1 100 200 300
0 1
0 1
Nucleotide
d
score
b
c
Construct candidate regions (User inputs a search length)
−0.2 0.0 0.2 0.4
1 100 200 300
Nucleotide
Smoothed
Δ
d
Test candidate regions individually
A1
A2
B1
B2
95 100 105 0.0
1.8
0.0 1.8
0.0 1.8
0.0 1.8
Nucleotide
Reactivity
d
within
between
95 100 105
0.0 0.5 1.0
0.0 0.5 1.0
Nucleotide
d
score
dwithin<dbetween?
e
Start
95
128
... ...
... End
108
136
... ...
... p
5e−04
0.04
... ...
... q
0.004
0.08
... ...
... Test results
f
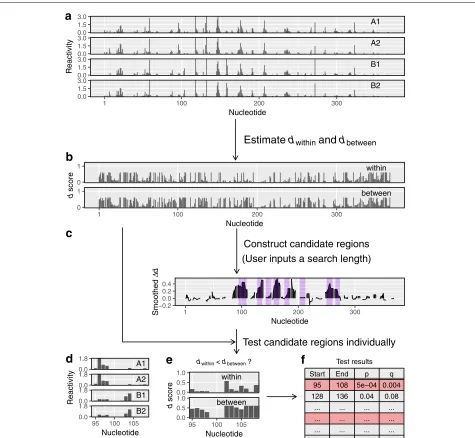
Fig. 2dStruct identifies differentially reactive regions.aUsers input samples of reactivity profiles, some from group A and some from group B.bIn the first step, dStruct quantifies the within-group and between-group variations in terms ofdscores.cIn the second step, dStruct identifies regions where the between-group variation appears to be greater than the within-group variation. These are highlighted by purple background. This step is skipped if users provide a list of candidate regions.dReactivity profiles for one of the candidate regions.eIn the third step, dStruct compares the
dwithinanddbetweenprofiles using a Wilcoxon signed-rank test.fThe results are output as a list of region identifiers, such as the start and end
locations of the candidates tested, and thepvalues andqvalues for each region
we scale it by2/π(Fig.1b).diis 0 when the same reactivity
is observed for nucleotideiin all samples (e.g., nucleotide highlighted with triangles in Fig.1a, b). It monotonically increases asrijbecomes more dispersed (Fig. 1c; see the
“Methods” section for details).
Differentially reactive regions
Equipped withdscore as a dissimilarity measure, we have developed a method to identify DRRs. Our method has three steps (Fig.2). First, we assess the within-group and
[image:4.595.62.537.85.523.2]between groups in that region is compared to the variation within groups. If the between-group variation is found to be significantly higher, the region is reported as a DRR. In what follows, we briefly describe each step.
Step 1
GivenmAandmBsamples from groups A and B,
respec-tively, letm = max(mA,mB) (Fig.2a). We construct all
possible subsets of themA+mBsamples, such that each
subset hasmsamples. Of these subsets, at maximum, two will be homogeneous, i.e., they will comprise of samples from A only or B only. IfmA = mB, there will be only
one homogeneous subset with samples from group A if mA > mB or with samples from group B ifmA < mB.
All other subsets will be heterogeneous. For each subset, we assess the d score for each nucleotide as previously described “Dissimilarity measure”. We use the nucleotide-wise average ofdscores across homogeneous subsets as the measure of within-group variation, denoted asdwithin (Fig.2b). Similarly, the average ofdscores across hetero-geneous subsets is used as the measure of between-group variation, denoted asdbetween.
Step 2
The second step is performed only for de novo discov-ery, as it constructs candidates for DRRs. In the absence of prior knowledge of where DRRs start and end, we rely on the evidence in the data to construct the so-called data-driven regions [49]. In our case, the evidence is in the difference between dbetween and dwithin. Hence, we defined = dbetween−dwithin. Ifd is positive for all nucleotides in a contiguous region of length greater than or equal to a user-specified length, the region is a poten-tial DRR candidate (Fig. 2b, c). However, DRRs could have altered reactivity patterns without necessarily hav-ing altered reactivities at all nucleotides. Indeed, in DRRs, some nucleotides may haved ≤ 0. Hence, we smooth thedprofile prior to screening for candidates (see the “Methods” section). Then, we search for regions that have a positive value of smootheddfor all nucleotides (high-lighted in purple in Fig. 2c). These regions are deemed potential candidates for DRRs. Note that the smoothed d profile is used only to construct candidate regions. Inputs to the final step are unsmoothed profiles obtained in Step 1.
Step 3
The significance of the differential reactivity pattern in a candidate region (see Fig.2d for an example) is deter-mined by comparingdwithin anddbetween for the region (Fig.2e). Specifically, we perform Wilcoxon signed-rank test to test the null hypothesis against the one-sided alter-native hypothesis that the population mean ofdbetween− dwithinis positive [52]. For the set of screened regions from
all transcripts, the FDR is controlled using the Benjamini-Hochberg procedure to obtainqvalues (i.e., FDR-adjusted pvalues) [53]. Finally, users obtain a list of regions with their corresponding p values and q values (Fig. 2f ). At this point, it is noteworthy that the final step of the sta-tistical testing is performed only for regions that meet a criterion for minimum quality, i.e., if their averagedwithin is less than a threshold (see Additional file1: Figure S2). Henceforth, we call this criterion the minimum quality threshold. Keeping the averagedwithinbelow this threshold ensures that samples in the same group have similar pro-files in the region of interest, see the “Methods” section for additional details.
Validation with small datasets
We tested dStruct on three small datasets for which prior knowledge of DRRs is available from independent sources. In addition, we compared its performance to that of RASA, PARCEL, and deltaSHAPE. Overall, we found that dStruct discovers DRRs de novo while having a minimal false-positive rate. Note that we defer comparison with StrucDiff until the section on large datasets, as the small datasets considered below do not have predefined candi-dates for DRRs. We require SHAPE data with both prede-fined candidates and replicate samples to compare dStruct and classSNitch. This is because classSNitch is currently trained for guided discovery in SHAPE data only and dStruct requires replicates. Since data satisfying require-ments of classSNitch and dStruct simultaneously is not available, we have excluded classSNitch from performance comparisons.
dStruct accurately rejects transcripts with no DRRs
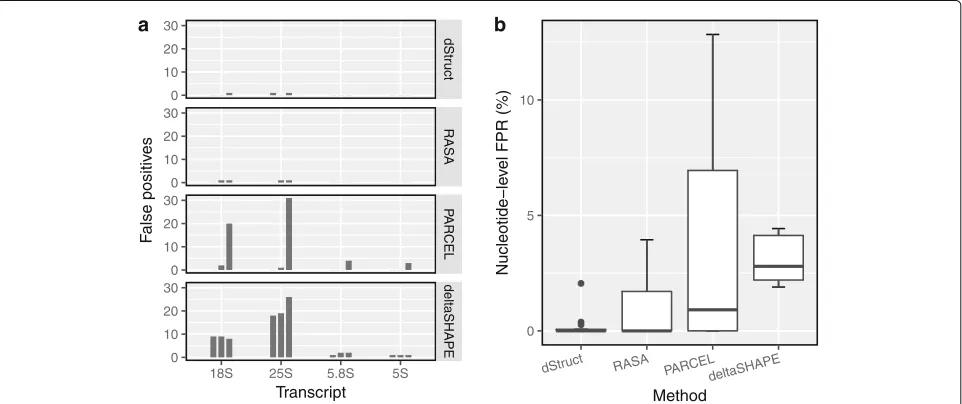
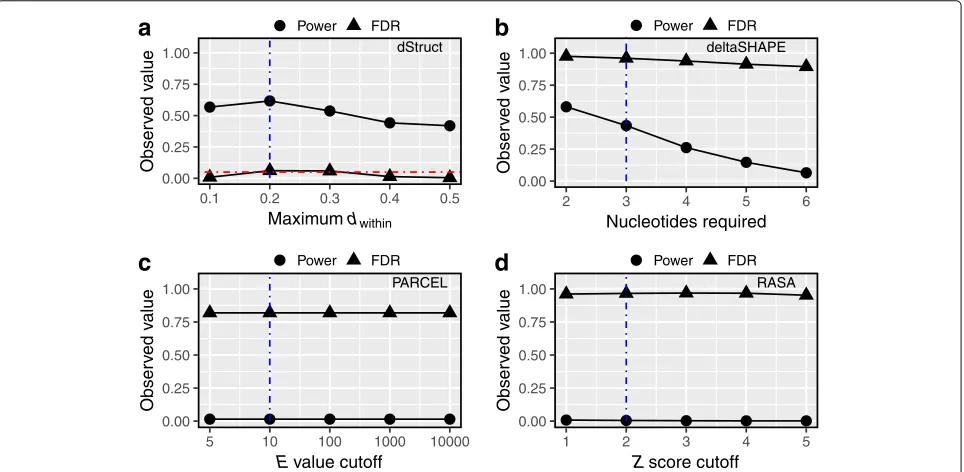
We tallied the number of DRRs reported by each method. Out of the 12 test cases, dStruct reported 3 DRRs when searching over 5 nt windows (Fig. 3a). Its performance was similar or better for longer windows (data not shown). For example, it reported no DRRs when searching over 50-nt windows (data not shown). RASA performed comparably to dStruct, reporting 4 DRRs. In contrast, PARCEL and deltaSHAPE reported 61 and 97 DRRs, respectively.
We calculated the false-positive rates at the nucleotide level as the fraction of nucleotides incorrectly reported as positives for a transcript. For dStruct, the rate was 0% in 9 cases and 0.2%, 0.3%, and 2% in the remaining cases whereas the other methods displayed higher rates (Fig.3b).
dStruct’s superior performance could be attributed to the fact that it overcomes limitations of the existing meth-ods. In particular, RASA and PARCEL do not account for information obtained from untreated control samples. Structure-Seq, however, does integrate it into the result-ing reactivities [25]. PARCEL also does not account for coverage variations within a transcript, which is known to be a significant issue [57]. Additionally, dStruct controls for false discoveries by adjusting the p values for mul-tiple tests whereas deltaSHAPE and RASA do not. For detailed overview of deltaSHAPE, RASA, PARCEL, and their limitations, see Additional file1: Sections S1-S3.
dStruct identifies DRRs from ligand-mediated structure alteration
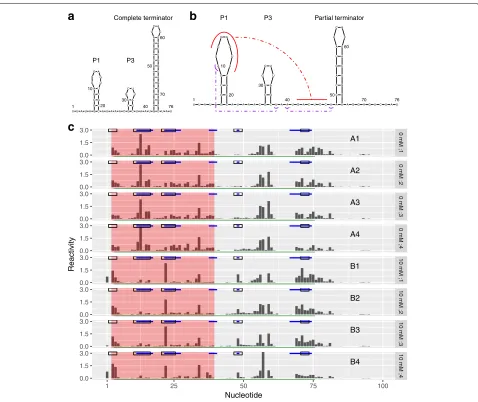
Next, we considered cotranscriptional SHAPE-Seq data for theBacillus cereus crcBfluoride riboswitch (100 nt in
length), probed in vitro in the absence and presence of fluoride ions [12]. It featured four samples for each group. The presence of fluoride prevents completion of a ter-minator hairpin by stabilizing a pseudoknot (Fig.4a, b). Such a mechanism allows fluoride-mediated transcription control. Between the conditions with and without fluo-ride, nucleotides 12–17, 38, 40, and 67–74 have altered base pairing states [10,58,59]. In addition, Watters et al. observed distinct reactivity changes at nucleotides 22–27 from visual examination of an independent dataset [10]. These nucleotides join the P1 and P3 helices but do not have altered base pairing states between condi-tions. However, these changes were observed consis-tently over a range of intermediate lengths that were probed cotranscriptionally. Hence, Watters et al. inferred that they were related to fluoride-mediated stabilization of the pseudoknot. Furthermore, we noted a consistent increase in the reactivity at nucleotide 48 in the pres-ence of fluoride, consistent with prior observations by Watters et al. [10]. Given the reproducibility of this change, we regarded nucleotide 48 as differentially reac-tive. Taken together, we considered nucleotides 12–17, 22–27, 38–40, 48, and 67–74 as our ground truth of DRRs (highlighted in blue on top of each sample in Fig. 4c). Note that in the absence of fluoride, nucleotides 42–47 pair with nucleotides 68–74 and are part of a hairpin. In the presence of fluoride, nucleotides 42–47 pair with nucleotides 12–17 to form a pseudoknot. However, lig-and binding is not expected to change the reactivities at nucleotides 42–47 because this region is paired in both the liganded and unliganded states. Hence, we excluded it from the ground truth.
dStr
uct
RASA
P
A
RCEL
deltaSHAPE
18S 25S 5.8S 5S 0
10 20 30
0 10 20 30
0 10 20 30
0 10 20 30
Transcript
F
alse positiv
es
a
0 5 10
dStruct RASA
PARCELdeltaSHAPE
Method
Nucleotide−le
v
el FPR (%)
b
[image:6.595.58.539.491.693.2]U U A U A G G C G A U G G A G U U C G C C A U A A A C G
C U G C U U A G C U A A U G
A C U C C U A C C A G U A U C A C U A C U G G U A G G A G U C U A U
1 10 20 30 40 50 60 70 76 P1 P3 Complete terminator
a
UUAU AG G C G A U G GA G U U C G C
C AUAAA CG C U G CU U A G
CU AAUG ACUCC UA C C A G U A U CA C U A C U G G
UAG GAGU CUAU
1 10 20 30 40 50 60 70 76
P1 P3 Partial terminator
b
A1 A2 A3 A4 B1 B2 B3 B40 mM ;1
0 mM ;2
0 mM ;3
0 mM ;4
10 mM ;1
10 mM ;2
10 mM ;3
10 mM ;4
1 25 50 75 100
0.0 1.5 3.0 0.0 1.5 3.0 0.0 1.5 3.0 0.0 1.5 3.0 0.0 1.5 3.0 0.0 1.5 3.0 0.0 1.5 3.0 0.0 1.5 3.0 Nucleotide Reactivity
c
Fig. 4dStruct identified DRRs from a ligand-mediated structure alteration. Fluoride ions bind thecrcBfluoride riboswitch and alter its structure.a Secondary structure in the absence of fluoride ions.bSecondary structure in the presence of 10 mM fluoride ions. The red curves highlight the pseudoknot between nucleotides 12–17 and 42–47. The purple curves highlight long-range interactions between the nucleotide pairs (10, 38) and (40, 48).cEight samples of reactivity profiles, four from group A (A1, A2, A3, and A4) with 0 mM fluoride ions and four from group B (B1, B2, B3, and B4) with 10 mM fluoride ions. Solid blue lines mark DRRs that are considered as the ground truth. Hollow black rectangles mark the DRRs called by deltaSHAPE. A red background marks the DRRs called by dStruct. A green line marks the DRR called by PARCEL. Note that RASA did not report any DRRs
We searched for DRRs using dStruct, deltaSHAPE, PARCEL, and RASA. For comparability, we specified the same window length of 5 nt to dStruct, deltaSHAPE, and RASA. We chose 5 nt because it is the default in deltaSHAPE. The default used by RASA is 50 nt, which is too long for a short transcript of length 100 nt. Note that PARCEL does not require a window length.
dStruct reported a DRR from 3–39, encompassing regions 12–17 and 22–27 and overlapping region 38–40 (region highlighted with red background in Fig.4c). How-ever, this DRR joined together three separate regions and extended to additional nucleotides towards the 5 end.
[image:7.595.61.539.84.486.2]changes at isolated nucleotides even if such changes were real signal. This is due to the fact that differential sig-nals at isolated nucleotides get diluted when scanning over windows. For example, nucleotide 48 is flanked by nucleotides that do not have differential signals. In the “Discussion” section, we propose ways to mitigate this limitation.
Similarly, deltaSHAPE correctly identified DRRs from 11–16 and 21–25, but it also correctly identified 47–49 and 71–73 (marked by black rectangles on top of each sample in Fig. 4c). However, it incorrectly reported region 2–4 and failed to identify region 38–40. PARCEL reported a single DRR that stretched from nucleotides 4–75 (marked by a green line at the bottom of each sam-ple). This DRR correctly encompassed all the real DRRs but also included regions that separate them. RASA did not report any DRRs when searching over 5 nt. It is noteworthy that RASA did not report any DRRs when searching over its default window length of 50 nt either.
Our results highlight that a key difference between the outputs of dStruct, deltaSHAPE, and PARCEL lies in the lengths of DRRs. dStruct identifies contiguous stretches of nucleotides that manifest reactivity changes. While dStruct might join together nearby DRRs, it does so only if they are separated by no more than twice the speci-fied search length. For example, the DRRs from 38–40 and 67–74 are separated by 27 nt with only one differentially reactive nucleotide. This prevents dStruct from extend-ing its reported DRR (3–39 nt) beyond nucleotide 39. In contrast, deltaSHAPE was developed to identify compact regions that might be DRRs. Hence, it yields several short regions as DRRs. Finally, PARCEL was developed to iden-tify the longest possible regions that have at least one nucleotide with significant changes. Thus, it includes long stretches of nucleotides without a differential signal in the reported DRRs. For example, it reported the entire span from the most 5real DRR to the most 3 real DRR and included everything in between.
dStruct identifies sites of RNA-protein interactions
We tested dStruct on another SHAPE-Seq dataset, which structurally characterizes the HIV Rev-response element (RRE)—a part of a viral RNA intron [11]. RRE binds multi-ple copies of Rev protein to form a commulti-plex that facilitates export of unspliced viral transcripts from the nucleus to the cytoplasm during late stage of HIV infection. Regions of Rev-RRE interactions have been identified using inde-pendent methods and provided us with a ground truth for comparisons (Additional file1: Figure S3) [11,60–62]. We obtained reactivity profiles for six samples — three replicates each in the presence and absence of Rev. How-ever, counts and coverage information were not available. When searching for regions of length 5 nt or more, dStruct identified 10 DRRs that overlapped 6 of the 7 regions
known to bind Rev. However, two of the reported DRRs were false positives. As RASA, PARCEL, and deltaSHAPE require coverage information, we could not apply them to this dataset. At this point, it is worth noting that RASA and PARCEL are based on counts and do not accept reactivities directly. Hence, they are not compatible with available datasets that contain only reactivities or with computational methods that output reactivities [30,31].
Validation with large datasets
We tested the methods on two large datasets, one with simulated DRRs and another with DRRs due to known single-nucleotide variants. In all tests, dStruct outper-formed the existing methods.
dStruct identifies simulated DRRs with properly controlled FDR
We used simulations to assess the methods’ capability in discovering DRRs de novo from transcriptome-wide SP data. To this end, we obtained three replicate sam-ples of theS. cerevisiaemRNA structurome using in vivo DMS probing (see the “Methods” section). Next, to mimic realistic trends in within-group variation, coverages, and transcript lengths, we introduced simulated DRRs into these samples. One of the samples was randomly labeled as group A, and the other two were labeled as group B. To start with, we randomly selected 1000 regions in the transcriptome for DRRs. The length of each region was chosen in the range of 50–75 nt, which is the usual range of lengths for search of structured regions [34]. Note that while we simulated the structural profiles for groups A and B over this range, we allowed the simulated DRRs to be shorter, as described next.
their structure ensembles, thereby reducing the between-group variation. For each structure, we generated a DMS reactivity profile by sampling reactivities using probability density functions for reactivities of paired and unpaired nucleotides [54]. The probability density functions were obtained by fitting a Gaussian mixture model to our data using patteRNA [33, 64]. The final reactivity profile for each region was obtained as the ensemble-weighted aver-age of profiles for individual structures (see the “Methods” section for details).
Overall, we simulated a range of within-group and between-group variations in reactivities, as reflected in the resulting within-group and between-group Pearson correlation coefficients (Additional file 1: Figure S4A). Since all simulated structures for a region represented folding of the same short sequence, there were stretches within them that did not have altered base pairing states between the groups. Indeed, the pairing states were altered for stretches shorter than the complete chosen regions (median length 11 nt; Additional file 1: Figure S4B). Therefore, we ran dStruct, RASA, and
deltaSHAPE with a search length of 11 nt. As noted earlier, PARCEL automatically determines the appropriate length for each DRR.
We evaluated the methods in terms of power and observed FDR. Power was calculated as the proportion of simulated DRRs that overlapped at least one reported DRR. The observed FDR was calculated as the propor-tion of reported DRRs that did not overlap any simulated DRRs. We observed the following performances.
We tested dStruct’s performance for several values of the minimum quality threshold (see the “Methods” section and Additional file 1: Figure S2). The thresh-old was specified in terms of maximum dissimilarity of reactivity profiles within the same group, i.e., maximum dwithin. We observed that dStruct had reasonably high power (∼60%) to discover DRRs for a range of the qual-ity threshold (Fig.5a). In addition, its FDR was properly controlled to the specified target level of 5%.
deltaSHAPE calls DRRs based on the number of nucleotides in a region that manifest significant changes in reactivities (see the “Methods” section and
dStruct
0.00 0.25 0.50 0.75 1.00
0.1 0.2 0.3 0.4 0.5
Maximumdwithin
Obser
v
ed v
alue
Power FDR
a
deltaSHAPE
0.00 0.25 0.50 0.75 1.00
2 3 4 5 6
Nucleotides required
Obser
v
ed v
alue
Power FDR
b
PARCEL
0.00 0.25 0.50 0.75 1.00
5 10 100 1000 10000
Evalue cutoff
Obser
v
ed v
alue
Power FDR
c
RASA
0.00 0.25 0.50 0.75 1.00
1 2 3 4 5
Zscore cutoff
Obser
v
ed v
alue
Power FDR
d
Fig. 5dStruct properly controlled the false discovery rates in simulated data. We searched for DRRs in simulated data using dStruct, deltaSHAPE, PARCEL, and RASA (a–d, respectively). The powers (circles) and FDRs (triangles) are plotted for each method. We tested each method for a range of stringency levels. Vertical dotted blue lines mark the default parameter settings. A horizontal dotted red line inamarks the specified target FDR. deltaSHAPE, PARCEL, and RASA do not control for FDR.X-axis labels indicate the parameter tuned for each method.adStruct calls a candidate region a DRR only if it satisfies a quality threshold as well as has significantpvalue andqvalue. The quality threshold is specified in terms of a maximum allowed within-group variation, measured as the averagedwithinin the region.bdeltaSHAPE chains together differentially reactive
[image:9.595.59.541.367.603.2]Additional file1: Section S1). Requiring fewer nucleotides amounts to a less stringent criterion. We tested deltaSHAPE’s performance for a range of stringency lev-els. We observed consistently high FDR in its detections (Fig.5b). For the least stringent criterion, deltaSHAPE’s power was comparable to that of dStruct, albeit at the cost of excessive FDR (Fig. 5a, b). Its high FDR could be attributed to its tendency to always report DRRs in transcripts that have high coverage (see Additional file1: Section S1 for a detailed overview of deltaSHAPE and its limitations). This is because deltaSHAPE calls DRRs from locally smoothed reactivity profiles. However, smoothing artificially spreads noise at a nucleotide into neighboring nucleotides. This might amplify the noise leading to false appearance of a strong differential signal. In addition, deltaSHAPE does not account for biological variation and does not control for false discoveries.
PARCEL calls DRRs based on the E value statistic, which quantifies the statistical significance of reactiv-ity changes in a region (see the “Methods” section and Additional file 1: Section S2 for details). A lower cutoff for E values represents a more stringent criterion. We tested PARCEL’s performance on a range of cutoff values (Fig.5c). We observed a consistently high FDR (∼82%) and low detection power (<1%). PARCEL’s poor perfor-mance could be attributed to the fact that it was designed to work in conjunction with a specific SP technology [21]. As such, it does not consider untreated samples or cov-erage variations across a transcript, which are important issues in transcriptome-wide data from most technolo-gies [6,30] (see Additional file1: Section S2 for a detailed overview of PARCEL and its limitations).
RASA calls DRRs in two steps. It uses a general-ized mixed model to quantify the significance of reac-tivity changes for each nucleotide. Then, it identifies regions enriched in differentially reactive nucleotides via permutation testing (see the “Methods” section and Additional file 1: Section S3). Since RASA quantifies enrichment in terms ofZscores, we assessed its perfor-mance for a range ofZscore cutoffs (Fig.5d). The lower the cutoff, the less stringent was the criterion for call-ing a DRR. We observed that RASA consistently yielded excessively high FDR and very low power. This could be explained by the fact that it does not utilize untreated sam-ples to compute reactivities. Hence, its application might not be suitable for SP technologies like Structure-Seq, which relies on untreated samples [25]. In addition, RASA does not perform multiple testing correction to control for false discoveries (see Additional file1: Section S3 for a detailed overview of RASA and its limitations).
Overall, we conclude from these comparisons that dStruct has higher power than existing methods and that its observed FDR is properly controlled to the speci-fied target of 5%. We provide additional performance
summaries for all methods in Additional file1: Figure S5. Interestingly, we found that the proportions of tran-script lengths reported by dStruct as DRRs correlated well with their simulated ground truths (Additional file1: Figure S6). This did not hold for the other methods.
Finally, we assessed the effect of varying the specified search length on dStruct’s performance (Additional file1: Figure S5F). We found that dStruct’s power remained approximately constant up to a search length of 25 nt, from which point it monotonically decreased. This is expected because a higher minimum length excludes more regions whose alterations span stretches shorter than the search length.
dStruct identifies DRRs caused by single-nucleotide variants
We compared the performances of dStruct and StrucDiff in a guided discovery context with PARS data for human RNAs by Wan et al. [9]. PARS utilizes a pair of nucle-ases as probing reagents, and the degrees of reactions from the nucleases are summarized as a PARS score for each nucleotide. The PARS dataset from Wan et al. fea-tures RNAs obtained from cell lines derived from a family trio of a father, a mother, and a child, with no replicates for any cell line. Wan et al. obtained a list of transcripts with single-nucleotide variants for this trio and identified DRRs of lengths 11 nt with the variants at their cen-ters. To this end, they developed the StrucDiff approach (Additional file1: Section S4). For each variant, they com-pared each pair of individuals separately using StrucDiff. They called a region a riboSNitch (i.e., a regulatory ele-ment whose structure is altered by a single-nucleotide variant) if any of the pairwise comparisons for the region yielded a significant result.
StrucDiff has five steps. Given a pair of profiles, first, the data is locally smoothed using a rolling mean over sliding windows of 5 nt to calculate smoothed PARS scores. Sec-ond, the absolute difference in the smoothed PARS scores (denoted asrifor nucleotidei) is calculated. Third, given
the variant’s location, the structural change score around the variant (henceforth, calledvSNV) is calculated as the averagerifor the nucleotides flanking it. In the fourth
step, StrucDiff assesses the statistical significance ofvSNV. To this end, it permutes the sequence ofri1000 times.
For each permutation, it assesses a structural change score under the null hypothesis (henceforth, called vnull). Ap value is assigned to the variant as the fraction ofvnull val-ues greater thanvSNV. In addition, StrucDiff controls the FDR using the Benjamini-Hochberg procedure. Finally, a variant region is classified as a riboSNitch if it has signifi-cantpvalues andqvalues,vSNV>1, high local coverage, and high signal strength in a window of 11 nt.
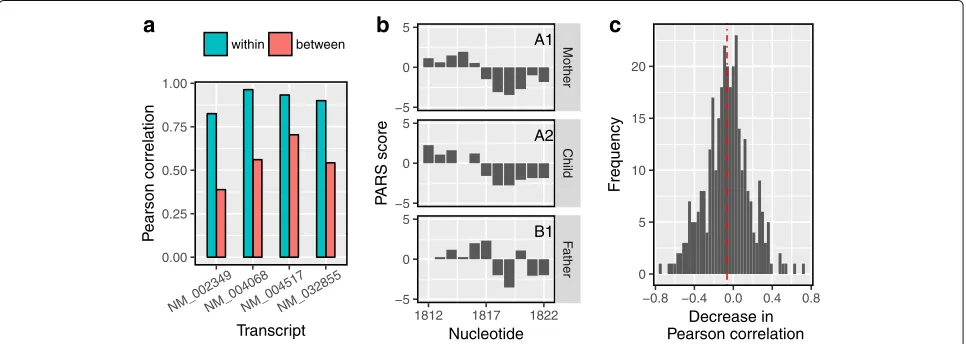
allelically identical, i.e., they were either both heterozy-gous or both homozyheterozy-gous with the same allele. However, none of the studied cell lines were probed in replicates. Hence, we used profiles from the two cell lines with iden-tical allele at a variant site as two replicate samples of the same PARS profile (labeled group A) for a region of 11 nt centered at the variant. This is reasonable under the assumption that the variant at the center of a region is the only distinguishable structure-altering factor. The remaining cell line with a different allele (labeled group B) could potentially have a significantly altered profile in this region. Hence, we used dStruct (guided discovery mode) to identify the regions with variants that were DRRs. Since there were no independent validations that could provide a ground truth for the variants under consid-eration (see the “Methods” section), we resorted to an indirect way of comparing the results from dStruct and StrucDiff using the Pearson correlation coefficient. The correlation between a pair of differentially reactive pro-files is expected to be lower than the correlation between the samples of the same group [35]. Hence, we calcu-lated the within-group and between-group Pearson cor-relation coefficients for each region. We found that the within-group correlations for DRRs identified by dStruct were high (Fig.6a). In addition, the between-group cor-relations were substantially lower in comparison with the within-group values. This trend in within-group and between-group correlations is expected because dStruct aims to find regions where the between-group variation exceeds that within groups. We further confirmed the similarity of reactivity patterns within groups and their
dissimilarity between groups by visual inspection (Fig.6b, Additional file 1: Figure S7). The inferences from the Pearson correlation coefficients and visual examination support our previous finding of a properly controlled FDR by dStruct. In agreement with dStruct, for two of the DRRs, StrucDiff consistently found significant changes in both the pairwise comparisons of profiles between groups. However, for each of the remaining two DRRs reported by dStruct, it inconsistently called a DRR in one pairwise comparison but not in the other. This is anomalous because both pairwise comparisons involved the same pair of variants.
To glean the FDR of StrucDiff, we took the difference of the between-group correlations and the within-group cor-relations for all regions. For DRRs, the difference should be significant and negative. However, we found that for many of the regions, the difference was positive, with a median −0.06 (Fig. 6c). This suggests that there could possibly be a significant proportion of false positives reported by StrucDiff. In other words, StrucDiff ’s FDR might be higher than the specified level of 0.1 as well as than that of dStruct. An alternative explanation for this observation could be that the variants at the cen-ter of the examined regions were not always the only relevant factors that influenced local structures. In fact, Wan et al. proposed that co-variation of variants in the close vicinity of a variant under consideration might influ-ence the local structure. However, they also found that riboSNitches (identified using StrucDiff ) have fewer vari-ants around them in comparison with varivari-ants that do not alter structure. Nonetheless, it is possible that our starting
0.00 0.25 0.50 0.75 1.00
NM_002349NM_004068NM_004517NM_032855
Transcript
P
earson correlation
within between
a
A1
A2
B1
Mother
Child
F
ather
1812 1817 1822 −5
0 5
−5 0 5
−5 0 5
Nucleotide
P
ARS score
b
0 5 10 15 20
−0.8 −0.4 0.0 0.4 0.8 Decrease in Pearson correlation
Frequency
c
[image:11.595.58.541.482.654.2]assumption that allelic similarity implies the absence of a DRR does not apply for at least some of the variants. This would explain the low proportion of riboSNitches found by our method. It could also explain the anomalous distri-bution of changes in the correlations for the riboSNitches reported by StrucDiff. Note that we could not compare the powers of dStruct and StrucDiff due to the lack of a ground truth for the data. Besides a comparison of FDRs, it is worthwhile to observe that the permutation test approach utilized by StrucDiff might not be suit-able for locally smoothed reactivity data (Additional file1: Section S4). This is because local smoothing introduces local correlations inri. However, these local correlations
are absent in the permuted data. As such, the sampling distribution ofvSNV under the null hypothesis turns out to be different from the distribution ofvnullvalues, which can lead to inflated error rates [65] (see Additional file1: Section S4 and Additional file1: Figure S8).
Discussion
Accounting for biological variation in reactivity patterns
Biological variation in measurements from samples of the same group has been observed across all areas of genomics [66]. In fact, RNA biologists that use SP pro-tocols have been aware of its presence [6, 30]. A recent study by Selega et al. shows that accounting for biological variation improves the estimates of reactivities [30]. Two methods, PARCEL and RASA, which explicitly account for biological variation in the context of differential anal-ysis, have also been published recently [20,21]. PARCEL uses edgeR to compare the counts between the groups of samples [36]. However, it does not consider cover-age variation within a transcript, which is known to be significant [57]. RASA accounts for coverage variation, but similarly to PARCEL, it does not use untreated con-trol samples in computing reactivities. Instead, it assesses the background noise from the untreated samples and then excludes from analysis nucleotides whose noise level exceeds a threshold. It favors this strategy because it was developed to be used with DMS-MaPseq, which does not consider untreated samples in reactivity estimation [67]. Yet, this limits the detection power in transcriptome-wide data from other technologies by filtering a major frac-tion of the nucleotides because these datasets are highly noisy [7]. Additionally, this places the burden on the user to optimize the threshold level for noise. Recently, broadly applicable computational methods for reactiv-ity estimation have been developed, namely, PROBer and BUM-HMM [30, 31]. These address several chal-lenges in estimating reactivities from transcriptome-wide data, e.g., multi-mapping reads, background noise, and coverage variation. Therefore, it is necessary for novel differential analysis methods to either address these chal-lenges directly or be compatible with methods such as
PROBer and BUM-HMM. However, RASA and PARCEL neither account for some of these major issues nor are they compatible with the analog reactivities output by said methods. The incompatibility arises because RASA and PARCEL were designed to take read counts as their (digital) input. Hence, the need for a robust differential analysis method remains unmet for the majority of SP technologies.
Besides accounting for biological variation, it is desir-able to identify regions that display differences in their reactivity patterns [33]. An altered pattern in a region could indicate a change in the composition of its structural ensemble [33,42,44,64]. Reactivity pattern is defined col-lectively by the reactivities of all the nucleotides in a region (Fig.1a). Hence, one must consider every nucleotide in a region for inferences on pattern changes. However, RASA, PARCEL, and deltaSHAPE first evaluate the changes at individual nucleotides and subsequently chain nucleotides with significant changes together as DRRs. Furthermore, the criteria for the number of nucleotides with significant changes are not always stringent (see Additional file 1: Section S1-S3). For example, PARCEL requires only one significantly altered nucleotide to call a DRR. In contrast to these three methods, StrucDiff considers all nucleotides in a region but only after smoothing the read counts (see Additional file 1: Section S4). This effectively obscures the reactivity patterns. classSNitch is the only method that explicitly accounts for patterns (see Additional file1: Section S5). However, it does not account for biological variation and is also currently limited to SHAPE data. dStruct presents a major advance over existing methods as it accounts for biological variation and reactivity pat-terns and is also compatible with diverse technologies. Notably, it smoothes thedscores in the second step but only to construct candidate regions. Once constructed, it reverts to the unsmoothedd scores to perform the sta-tistical inference (Fig.2). In guided discovery, it does not perform smoothing at all.
parallel, the slope of the segment between any pair of adja-cent sites would be the same for both profiles. Indeed, this idea forms the basis for the classical approach of profile analysis for test of parallelism [68]. However, this approach requires a large sample size to account for bio-logical variation and can potentially be applied only to predefined regions. In addition, it would require normal-ity of reactivities. If two profiles were to be found as parallel by this approach, they could be tested for coinci-dence in a second hypothesis test. Since the telling feature for DRRs is coincidence of profiles, dStruct assesses coin-cidence at the nucleotide level directly in terms ofdscore. Two profiles can be classified as coincident if the verti-cal distance (or difference in reactivity) between them is 0 at each nucleotide. However, such a definition would be applicable only for two profiles. Our dissimilarity mea-sure, d score, extends the concept of pairwise “vertical distance” to multiple profiles. We usedscore to assess dis-similarity within groups and between groups. Then, we test the null hypothesis that profiles for the two groups are coincident anddscores are not significantly different within and between groups.
Our dissimilarity measure is based on the mean and standard deviation of reactivities for each nucleotide. In differential analysis studies in other fields, it has been noted that when standard deviation from very few sam-ples is used to estimate t-type test statistics, the test statistics can be unreliable and lead to false positives and reduced power [69]. However, despite this issue, dStruct has reasonably high power and low observed FDR. dStruct’s high performance is possible because we do not utilize standard deviation to assess a test statistic directly. Instead, it contributes to the assessment of a secondary feature of the data. Additionally, from the point-of-view of Wilcoxon signed-rank test, the test statistic in our method is the sum of signed ranks. This test statistic pools information from all nucleotides in a candidate region, and hence, its susceptibility to noise in nucleotide-leveld scores is reduced. While untransformed ratio ofμi and σi is very sensitive to small changes in μi when μi is
close to zero, we have improved our dissimilarity measure with a monotonic transformation (see Additional file1: Figure S9). Yet, it is to be noted that our approach focuses on variation at the level of reactivities. Indeed, in our anal-ysis, we have not modeled the mean-variance relation-ship of reactivities. While dStruct provides a significant improvement over existing methods in its current form, accurate models of heteroscedasticity in mean-variance relationship might enhance the dStruct’s performance. For example, methods for differential gene expression analysis utilize such models [70]. Moreover, we do not model vari-ation directly at the level of counts. In the future, it might be possible to achieve better performance with rigorous models for variation directly at counts level [49].
Finally, our approach differs from other methods of dif-ferential analysis in one additional way. For each region of interest, other methods assess a single test statistic [48, 49,69]. To classify the region, they either rely on a cutoff or assess statistical significance in reference to a null distribution. Moreover, the null distribution is gener-ally obtained by permuting the sample assignment labels for data points and calculating test statistic for permuted data. In contrast to the approach of capturing the effect size and within-group variation in a single test statistic for each region, our approach of quantifying within-group and between-group variations in reactivity patterns pro-vides two vectors ofdscore profiles for each region. The vectors consist of values that reflect nucleotide-level dis-similarity of reactivity patterns. Given these vectors, our goal is to test if between-group variation is significantly higher than within-group variation, in which case it can be reasonably classified as a DRR. Hence, we forgo label permutations in favor of the Wilcoxon signed-rank test. Wilcoxon signed-rank test is an alternative to paired Stu-dent’s t test and does not assume normal distribution of d scores. It compares d scores for within-group and between-group variations. In other words, our method assesses the significance of differential reactivity in a region by comparing it to within-group variation in that region. In fact, experts can identify altered reactivity pat-terns by inspecting a region alone, without needing to resort to transcript-wide or transcriptome-wide data for reference. This suggests that there is adequate informa-tion within the candidate regions for classificainforma-tion pur-pose [35]. Our approach in dStruct takes advantage of this characteristic of the reactivity data. In addition, such an approach of significance testing confers robustness to the presence of outliers or poor quality data outside the regions of interest.
Limitations
might also lead to loss of power. This is because dStruct disregards all evidence of between-group variation in regions shorter than the specified search length. In our simulations, we found that for a wide range of input search lengths (5–25 nt), dStruct maintained approximately con-stant power and properly controlled the observed FDR (Additional file 1: Figure S5F). However, this might not always be the case.
Another limitation to note is that dStruct might not determine DRR boundaries accurately, as it opts for the longest contiguous regions possible. Thus, it might join DRRs that are separated by fewer nucleotides than the search length. Moreover, dStruct might miss regions where a majority of the nucleotides have zero reactivities. While zero PARS scores could be considered no infor-mation, zero SHAPE/DMS reactivities may report either high-quality information or no information (e.g., a man-ifestation of high background noise) [37]. In our experi-ence, for PARS as well as SHAPE/DMS data, a substantial fraction of the nucleotides have zeros across all replicates. Considering all of them as high-quality information and defining their d scores as 0 results in erroneous infer-ences (data not shown). Hence, we leave thedscore for such nucleotides as undefined. Yet, it is worth noting that the quality criteria that we use to filter candidate regions ensure that no more than a small fraction of the nucleotides have undefineddscores in candidate regions (see the “Methods” section). Regions containing zero or very low reactivities for most nucleotides are not found by dStruct, even if they are true DRRs. In addition, if one of the groups manifests only zero reactivities in a region, it does not contribute to the assessment of within-group variation in that region.
Another limitation of dStruct is that it leaves the burden of normalizing the reactivities to the user. Normalization is a common practice in the field and aims to bridge dif-ferences in reaction conditions [6]. Several approaches have been utilized, which heuristically identify outliers and subsequently use the remaining values to determine a normalization constant [56, 71]. Thus, they critically depend on outlier detection. However, outliers are typi-cally noisy and can easily distort the scaling [6]. Further-more, their prevalence and characteristics in the context of transcriptome-wide SP are still poorly understood. For these reasons, proper normalization is a critical step in differential analysis, and when done well, it could substan-tially enhance power. A hallmark of proper normalization is good agreement between the normalized replicates [72]. In that context, we designed dStruct to consider only those regions which satisfy a minimum requirement for replicate agreement (see the “Methods” section for min-imum quality threshold and Additional file1: Figure S2). Specifically, transcripts or regions thereof, which display poor replicate agreement, are filtered by dStruct. We
caution users to check for agreement between replicates from the same group in those regions that dStruct dis-carded. Furthermore, if it excluded a large fraction of the transcripts due to quality considerations, this could suggest that samples were not properly normalized.
Another limitation of dStruct and all other methods is that they might miss thedifferentially structuredregions if they do not manifest differential reactivities, as there might be regions in a transcript that pair with alternative partners between groups. For example, nucleotides 42–47 of the crcB fluoride riboswitch (Fig.4a, b) change part-ners between groups but remain paired in both groups. Such nucleotides might not exhibit significant reactivity changes. Notably, this limitation is due to the nature of SP data.
Besides these limitations, dStruct might miss DRRs that exhibit significant changes at only one to two nucleotides. For long search lengths, it might even overlook such DRRs as candidate regions. This is because differential signals concentrated at only a few nucleotides get diluted when searching over windows. The longer the search length, the more is the signal dilution. Notably, specifying a short search length might not remedy this issue, as it arises from the limited power of the Wilcoxon signed-rank test when applied to very small samples. For example, at a signifi-cance level of 0.05, this test cannot identify DRRs shorter than 5 nt in length. This places a hard limit on dStruct’s detection power. Nevertheless, regions shorter than 5 nt might be listed with insignificant p values if the speci-fied search length were≤5. Hence, if it is of interest to find isolated single-nucleotide changes, users can specify a short search length and visually examine all the candi-date regions. Detection power in such a case could also be improved by replacing Wilcoxon signed-rank test with paired t test, which might be more powerful for small samples [73].
power could be improved by leveraging the proximity of real DRR candidates and testing candidate regions collec-tively if they are located within a certain distance of each other. Another way to improve power in such situations is to integrate differential analysis of SP data with other kinds of relevant data. For example, consider a study on how a protein impacts RNA structure upon binding. Let there be two groups with wild-type samples and samples where the protein’s binding domain has been eliminated. Let us say that dStruct is given a search length of 5 nt and constructs a lot of candidate regions but calls no DRRs due to the subtleness of reactivity changes. It might be possible to integrate the information from a collateral study on sites of RNA-protein binding with regions con-structed by dStruct and perform enrichment tests. The null hypothesis underlying such a test could be that con-structed regions are not associated with the change in pro-tein’s function. Such tests have been used in other fields of genomics to yield useful biological insights, e.g., gene set enrichment analysis [74,75]. Future developments of such methods specialized to the SP data could benefit RNA structure studies. Furthermore, it might be possible to do SP in the presence of a range of concentrations of wild-type protein [11]. This would result in several groups of samples with different concentrations of the protein. Differential analysis of such data could be performed in the following manner. One could compare each group of samples to the group with the lowest concentration of the protein. Emergence of certain constructed regions as the difference in concentrations between groups increases might reveal the DRRs. If such regions consistently appear beyond a level of concentration differences, they could be considered as evidence in support of DRRs.
Additional recommendations
We strongly recommend using dStruct in conjunction with the data obtained from paired-end reads. While dStruct works with both single- and paired-end reads, reactivities are most reliable when the treated and untreated detection rates are estimated using local cov-erages instead of transcript-level covcov-erages [6, 37]. In addition, it is critical to secure at least two samples per group. In our experience, reactivity patterns could change merely due to biological variation. In the absence of repli-cates for a group, it does not contribute to the estimates of within-group variation. This might lead to false positives. Moreover, in some studies, one of the groups might be expected to manifest much higher variation than the other due to experimental limitations and/or known biologi-cal factors. For example, Watters et al. compared genome segment RNA3 of the Cucumber mosaic virus between infected cell lysates (group A) and in vitro refolded viral RNA extracted from virions (group B) [13]. They observed much higher variation in group A than in group B. In
such a case,dwithin, which summarizes the within-group variation in both groups, might be very high and thereby limit the detection power. However, as has been recently done in methylation studies [48], it may be possible to enhance dStruct’s power by assessingdwithinonly for the less variable group (see dStruct’s manual for details). DRRs found using this approach would represent regions where one group varies much more than the other. Importantly, if such an approach was utilized, the supporting details should be clearly reported. Finally, in guided discovery situations, it is possible that collateral studies do not pin-point the exact regions where DRRs might be found but only indicate their approximate locations. For example, in RNA-protein interaction studies, DRRs might be any-where within say 100 nt upstream/downstream of CLIP-seq signal peaks. In this case, performing guided discovery with say a 20 nt window centered at the peak may preclude the discovery of more distant DRRs. However, de novo discovery within the entire transcript may not be optimal either. Hence, if the precision of the CLIP-seq data was known, it may be better to perform de novo discovery with say a 200-nt window centered at the peaks.
Conclusions
We described dStruct, a novel approach to identify DRRs from SP data. dStruct is compatible with diverse SP pro-tocols and accounts for biological variation in SP data. First, it quantifies the within-group and between-group variation. Then, it constructs regions that are potential candidates for DRRs to facilitate de novo discovery or uti-lizes candidate regions identified by collateral studies to aid guided discovery. Finally, it assesses the statistical sig-nificance of differential reactivities in candidate regions and controls for false discoveries. To validate dStruct, we used diverse datasets, which span a range of SP tech-nologies, structure-altering factors, and organisms. We demonstrated that for a properly controlled FDR, dStruct has a higher power than existing approaches. While we validated dStruct with the SHAPE-Seq, Structure-Seq, and PARS protocols, it is applicable to many other SP technologies. With SP technologies reaching the phase of maturation, there is a need to develop robust methods to perform differential analysis of SP data. We discussed the unique aspects of SP data that distinguish it from other kinds of genomic data. These unique aspects present a need for differential analysis methods tailored to the needs of diverse SP technologies. dStruct is a first step in this direction.
Methods
Quantifying dissimilarity of reactivities
in a transcript or in regions thereof. We devised the d score by examining the deficiencies of existing approaches in serving this need. For example, classSNitch utilizes a feature of reactivity profiles called a pattern correla-tion coefficient. It is the Pearson correlacorrela-tion coefficient of sequences of signs of slopes of the segments joining reactivity scores for adjacent nucleotides in plots of reac-tivity profiles (slope of segments of red line in Fig. 1a). While correlation in sequences of slopes could assess if two profiles were parallel, a region with approximately parallel profiles might still be a DRR if the profiles were not coincident. classSNitch assesses the coincidence in profiles by taking the Euclidean distance between a pair of profiles. However, the Euclidean distance is valid for only two profiles and can be sensitive to outliers. At nucleotide resolution, the coincidence of two profiles could be cap-tured as the vertical distances between the profiles or the differences in reactivities. If the differences were zero or significantly low for a pair of profiles, they might be called coincident. This is the basis of structural change scores used in deltaSHAPE and StrucDiff. However, the utility of reactivity differences is limited to a comparison of two profiles. Besides the need for a measure that could simul-taneously summarize the agreement of reactivity patterns for more than two replicates, we identified a need to account for the fact that nucleotides with higher aver-age reactivity tend to have higher fluctuations [56]. This aspect of the data could be accounted for by considering the ratio of the reactivity difference and the mean reactiv-ity at a nucleotide, i.e., ifr1,iandr2,iare the reactivities in
two replicates at nucleotidei, we could consider:
r1,i−r2,i
1
2r1,i+r2,i
. (3)
The above expression yields a sequence of zeros for per-fectly coincident profiles. It yields a sequence of very high numbers (or infinity) for nearly anti-parallel profiles. For two profiles,dscore is defined as the arctan of the above expression, with additional scaling as described next. To account for multiple profiles simultaneously, we replaced the numerator in the above expression with the sample’s standard deviation (denotedσi), which gave us the abso-lute value of the coefficient of variation, or|CV|. However, |CV|is very sensitive to small changes in the mean reac-tivity (denoted μi), especially when μi is close to zero (see Additional file1: Figure S1). This could lead to exces-sively large|CV|. For example, PARS scores can take both positive and negative values, which can yield μi values
close to zero. Asμidecreases and approaches zero,σi/|μi|
increases very fast and approaches infinity. This is prob-lematic because excessively large values can dominate the averages that we use within the dissimilarity measures (i.e., nucleotide-wise averages across all the homogeneous subsets or all the heterogeneous subsets in step 1; average
at the regional level in step 2; see the “Differentially reac-tive regions” section). Hence, we applied a monotonic transformation to |CV| that prevents the occurrence of excessively large values (Fig. 1c and Additional file 1: Figure S1). While logarithmic transformation is a com-mon choice, it is not suitable for|CV|directly as it goes to −∞for|CV|close to 0. Indeed,|CV|being close to zero suggests that the reactivities being compared are identi-cal, which can happen in regions with good data quality. While log transforming (1+ |CV|)is a possible alterna-tive, log transformation does not restrict the range of the transformed values. In fact, their range remains the same as that of the untransformed|CV|, i.e., [ 0,∞). Hence, log does not guarantee bounded values in transcriptome-wide data, which displays numerous instances of extremely high |CV| for PARS data (data not shown). We use a transformation that yields values of identical order of magnitude as the log transformation forσi/|μi|up to∼103
and which does not increase to infinity for higher values of σi/|μi| (Additional file 1: Figure S1). A natural choice
to transform ratios is to use inverse trigonometric func-tions. For example, proportions are often transformed using the arcsin function [49]. However, arcsin’s domain is limited to [−1, 1]. Hence, we transformed|CV|, which can take any positive value, using an arctan function— a monotonic transformation that ranges from 0 to π/2 (Fig.1b, c and Additional file1: Figure S9). arctan(σi/|μi|)
is approximately equal toσi/|μi|forσi/|μi|<1. Additionally,
for higher values ofσi/|μi|, it is close to log10(1+σi/|μi|)
when σi/|μi| is less than or around order 103.
Impor-tantly, arctan(σi/|μi|) asymptotically reaches π/2asσi/|μi|
increases beyond order 103, whereas log10(1+σi/|μi|)
continues to increase withσi/|μi|. This is a useful property
because we do observe σi/|μi| 103 in
transcriptome-wide data (not shown). Furthermore, we compared perfor-mances of log and arctan transformations in the context of differential analysis with dStruct. In addition, we com-pared a threshold approach to boundσi/|μi|by restricting
large values to the threshold. We observed identical per-formances of all three approaches. This is because dStruct utilizes a non-parametric test. In such a test, only the rel-ative ranks ofdscores are of concern (Additional file1: Figure S9). Since log and arctan transformations are both monotonic transformations, using one instead of another alters the absolute magnitudes of dscores but not their relative ranks. Nonetheless, for our purpose, the major advantage of the arctan transformation is that it results in values that are bounded to a finite interval. This allows a convenient scaling such that the d scores are bound between 0 and 1, which is a desirable feature for interpre-tation [76] (Additional file1: Figure S10).
Since arctan(σi/|μi|)ranges from 0 toπ/2, we rescaled it