http://dx.doi.org/10.4236/ojbm.2014.23027
Investment Value Evaluation of Hi-Tech
Industry: Based on Multi-Factor Dynamic
Model
Chen Liu, Yang Liu
Tianjin University of Finance & Economics, Tianjin, China Email: [email protected]
Received 12 May 2014; revised 15 June 2014; accepted 6 July 2014
Copyright © 2014 by authors and Scientific Research Publishing Inc.
This work is licensed under the Creative Commons Attribution International License (CC BY).
http://creativecommons.org/licenses/by/4.0/
Abstract
By constructing a multi-factor dynamic model based on the theory of the lifecycle with China’s A-share data from 2007 to 2013, we analysis the factors affect the investment value and risk of hi-tech industry and their mechanism of action. After the regression, we can draw conclusions: Firstly, hi-tech industries in China are mostly in the growth stage and maturity stage. Investment value of the industries in the growth stage are mostly influenced by market premium factor, mar- ket factor, P/E ratio factor and R & D density factor, while hi-tech industries in maturity stage are mainly affected by the market premium factor, market factor, P/E ratio factor. Secondly, dynamic multi-factor model can measure the investment value of hi-tech industries adequately. The con- clusions give a reference for investors on how to make investment plan on the stocks of hi-tech enterprises, and provide some policy recommendations on the way promoting hi-tech enterprises to enhance their core technology as well.
Keywords
Multi-Factor Dynamic Model, Space State Model, Hi-Tech Enterprises, Investment Value
1. Introduction
high-tech sections reasonably? This raise requests that find a scientific method to measure the investment value of science and technology enterprise. Academia has conducted a related study. But most scholars measure the value of its equity investments by traditional methods such as DCF model or PE model, traditional valuation methods which don’t take the characteristics of hi-tech industry into account. Some valuation methods apply only to large enterprises. Those methods cannot reasonably estimate the value of SMEs especially some high- tech enterprises, which will seriously restrict the financing and property transactions of the high-tech enterprises. To solve the above problem, this article constructs dynamic multi-factor model which makes high-tech indus- tries’ characteristics and multi-factor valuation model combined. This model is suitable for Chinese technology section’s stocks and it can assess the investment value of the high-tech industries adequately. The main contri- bution of this paper is to reveal the factors influencing investment value of the technology industry and the un- derlying mechanisms of those factors. We make a reasonable assessment of the investment value of high-tech industries as well.
2. Theoretical Analysis and Research Hypotheses
High-tech enterprises have a non-traditional business operation that emphasis on intellectual capital and corpo- rate culture as well as high investments risk, which determines the hi-tech industry is characterized by a high degree of technology-intensive, high input, high risks and high expected returns. These features can be depicted by factor Model. In the framework of the no-arbitrage pricing, the basic idea of multi-factor model is to identify factors that affect the yield of stocks and expand CAPM into a multi-factor model. Three-factor model is the most famous multi-factor model, by building stock portfolios with different size and book-value ratio, Fama and French (1993) empirically prove ME (scale factor) and BE/ME (value factor) are risk factors in the US stock market which represent the fluctuations of the yield [1]. In addition, Campbell, Lettau, Malkiel and Xu (2001) proposed volatility decomposition model, the volatility of individual stocks decomposed into market volatility, sector volatility and the individual volatility, and applied this method to the study of the stock market in US, which found that industry factors have a significant impact on stocks [2]. Summarizing the literatures according pricing the investment value of high-tech industries, we recognize that in addition to market premium factor, other factors affecting the value of the investment industry can be divided into two categories: industry-specific factors which stand for the industry-specific risk; factors reflect the macro-economic conditions.
2.1. Hi-Tech Industry-Specific Factors and Mechanism of Action
High-tech industries are technology-intensive and capital-intensive industries. R & D is momentum for the de- velopment of high-tech industries, while R & D requires a lot of financial support. Lev, Nissism and Thomas (2005) added the R & D factor to three factors model and found that capitalization and subsequent amortization of R & D should unambiguously increase the efficiency of market prices and resource allocation [3]. Zhou wan Yi, Wang Zhen Yi, Su (2011) studied the relationship between R & D factor and value of the high-tech SMEs. They draw the conclusion that R & D factor had a positive influence on the value of the company [4]. But Dosi, G., Llerena, P., Labini, M.S. (2006) find R & D didn’t promote the growth of economy with some European countries data in different period [5]. Sun Xiaohua, Xin Meng Yi (2013) considered that R & D as an element of production is in compliance with the law of diminishing marginal returns, coupled with the national innovation system may exist system failures. There is a significant relationship of the inverted U-shaped between the R & D strength and profitability of the industry [6]. Above all, a reasonable scale of R & D should promote corporate profit growth. The rapid development of China’s high-tech industries is largely driven by the introduction of foreign mature technology and lack of independent innovation capability, which make R & D bring little mar- ginal costs and relatively high revenue. Thus, this paper puts forward the hypothesis H1: R & D factor which affects the returns of hi-tech industry significantly.
tries is in correspondence with enterprise operational risk, the poor operating conditions and high leverage ratio result in high risk of their expected earnings, which led the industry to bring the company’s system of large- scale risks, and its non-systematic risk is mainly caused by speculator’s advocate on the high-tech sector in the Chinese market. P/E factor and B/M factor reflect the changes in capital structure during the different industrial lifecycle stage, which can affect investors’ expectations of future earnings. In sum, we get two assumptions H2: scale factor suitable for assessing the investment value of technology industries. H3: P/E factor is more suitable than the B/M factor when assessing the investment value of high-tech industries.
In addition, at different stages of the life cycle, high-tech enterprises operating mode and capital structure are significantly different, thus have an impact on the high-tech industries’ investment value. From the perspective that lifecycle impact business operations, Jawahar and McLaughlin (2001) consider in the different life cycle stages the agency problems faced by companies is in varying severity, which is bound to affect the efficiency of corporate governance, thus affecting the R & D investment of high-tech enterprises [8]. Lifecycle impacts the capital structure of the enterprises, Fanhongbo (2002) pointed out that the industries in maturity stage growth had a higher P/E ratio than the industries in growth stage, which reflect the lifecycle effect on prices of stocks. In summary, we propose the following assumption H4: lifecycle affects the value of science and technology in- dustry, hi-tech industry with different lifecycle stage should be different in P/E ratio and R & D.
2.2. Macroeconomic Factors and Mechanism of Action
Macroeconomic cycles affect the intrinsic value of assets, mainly through two way that elasticity of demand and the cash flow of high-tech industries. Electronics, pharmaceutical biotechnology and IT industry are non cyclical Industries which have small demand elasticity and a relatively stable cash flow, theoretically such industries should have lower investment risks. Ricardo de O. Cavalcanti, Ed Nosal (2009) found that cyclical Industries in an expansionary monetary policy have a better performance, while non-cyclical industries perform better in the tightening environment [9]. Sun Haibo, Song Xi (2009) used M2 to measure the macroeconomic cycle, and they come to the same conclusion [10]. Other macro-economic factors such as inflation rate and term spreads influ- ence the price of stocks by affecting the investors’ expectations and investment preferences, Wan Yan Wing (2005) demonstrated that the rate of inflation and term spreads have a significant impact on the yields of stocks [11]. Wang Yintian and Zhu Yingzi (2011) established the eight-factor model, they found that macroeconomic factors such as the repo rate and term spreads have significant explanatory power for China’s A-share market’s risk premium [12].
Summarizes the conclusions of previous studies, we propose the following hypothesis H5: macroeconomic factors, such as M2, CPI, term spreads and other factors that significantly affect the yield of hi-tech industry portfolios.
3. Theoretical Models and Research Methods
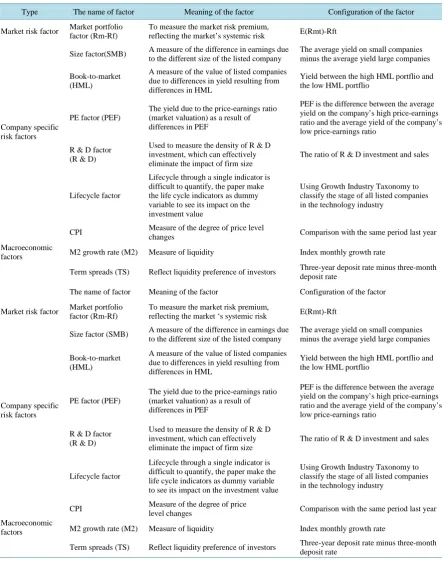
We built a dynamic multi-factor valuation model of hi-tech industry from the “cross-sectional dimension” and the “time dimension”. The “cross-sectional dimension” is used to analyze the source of hi-tech enterprises’ stock investment cross-section premium at established stage, while the “time dimension” is used to analyze the in- vestment value of the high-tech industry over time. First, building relationships between cross-sectional ex- cepted returns and affecting factors. For some factors with incomplete data during study period, we picked seven factors with complete data in observation period, as shown in Table 1.
Using the selected sample data to estimate multiple linear regression model (1) and then obtain a high degree of significant factors by filtering based on a significant degree of each factor. The specific relation estimated for the portfolio of each hi-tech industry is:
( )
it ft i(
mt ft)
i(
t)
i(
t)
i(
t)
i t i 2t i t i E R −R = +a βE R −R +s E SMB +h E HML +e E PEF +c CPI +m M +t TS +ε (1)After summarizing the effective cross-sectional factors from the results of short term and long term regression, we put the lifecycle factor as dummy variables into the model, and ultimately got the dynamic multi-factor model.
4. Measurement of the Hi-Tech Industry Investment Value
4.1. Data
Table 1. Factors and its composition method.
Type The name of factor Meaning of the factor Configuration of the factor
Market risk factor Market portfolio factor (Rm-Rf) To measure the market risk premium, reflecting the market’s systemic risk E(Rmt)-Rft
Company specific risk factors
Size factor(SMB) A measure of the difference in earnings due to the different size of the listed company
The average yield on small companies minus the average yield large companies
Book-to-market (HML)
A measure of the value of listed companies due to differences in yield resulting from differences in HML
Yield between the high HML portflio and the low HML portflio
PE factor (PEF)
The yield due to the price-earnings ratio (market valuation) as a result of differences in PEF
PEF is the difference between the average yield on the company’s high price-earnings ratio and the average yield of the company’s low price-earnings ratio
R & D factor (R & D)
Used to measure the density of R & D investment, which can effectively eliminate the impact of firm size
The ratio of R & D investment and sales
Lifecycle factor
Lifecycle through a single indicator is difficult to quantify, the paper make the life cycle indicators as dummy variable to see its impact on the investment value
Using Growth Industry Taxonomy to classify the stage of all listed companies in the technology industry
Macroeconomic factors
CPI Measure of the degree of price level
changes Comparison with the same period last year
M2 growth rate (M2) Measure of liquidity Index monthly growth rate
Term spreads (TS) Reflect liquidity preference of investors Three-year deposit rate minus three-month deposit rate
The name of factor Meaning of the factor Configuration of the factor
Market risk factor Market portfolio factor (Rm-Rf)
To measure the market risk premium,
reflecting the market ‘s systemic risk E(Rmt)-Rft
Company specific risk factors
Size factor (SMB) A measure of the difference in earnings due to the different size of the listed company
The average yield on small companies minus the average yield large companies
Book-to-market (HML)
A measure of the value of listed companies due to differences in yield resulting from differences in HML
Yield between the high HML portflio and the low HML portflio
PE factor (PEF)
The yield due to the price-earnings ratio (market valuation) as a result of differences in PEF
PEF is the difference between the average yield on the company’s high price-earnings ratio and the average yield of the company’s low price-earnings ratio
R & D factor (R & D)
Used to measure the density of R & D investment, which can effectively eliminate the impact of firm size
The ratio of R & D investment and sales
Lifecycle factor
Lifecycle through a single indicator is difficult to quantify, the paper make the life cycle indicators as dummy variable to see its impact on the investment value
Using Growth Industry Taxonomy to classify the stage of all listed companies in the technology industry
Macroeconomic factors
CPI Measure of the degree of price
level changes Comparison with the same period last year
M2 growth rate (M2) Measure of liquidity Index monthly growth rate
Term spreads (TS) Reflect liquidity preference of investors Three-year deposit rate minus three-month deposit rate
nology. Based on the Standards of Industry Classification distributed by the Securities Regulatory Commission, high-new tech enterprises concentrate in the following industries, such as biological medicine, mechanical equipment, chemistry and plastic, electronic and information technology. This paper chooses the monthly data of technology industry covering the period from January 2007 to December 2013 as the sample data to calculate, excluding the listed companies whose book value is less than zero.
4.2. Regression Analysis Considering the Fluctuations in the Stock Market
The stability of the eight factors, R & D density, CPI and M2 growth rate are non-stationary, their time series are first-order autocorrelation. In order to reduce the complexity, we choose the random walk model to describe the measurement model of non-stationary factors. By using incremental method, we can know that chemistry and plastic, electronic is in the maturity stage, and biological medicine, mechanical equipment, and information technology is in the growth stage, the detail analysis results can be seen in the appendix.
( )
*(
)
* * * * & * 2 * *E R −Rf =β Rm−Rf +s SMB+h HML+e PEF+r R D+m M +c CPI+t TS (2)
( )
@STATE r=r −1 (3)
( )
@STATE m=m −1 (4)
( )
@STATE c=c −1 (5)
Using the data during the observation period to estimate the state space model from Formula (2) to (5). We can draw the conclusion that the market premium factor, market value factor and price-earning ratio factor have significant influences in almost all the industries, while the R & D factor is significant to the premium of indus- tries in the growth stage.
4.3. Regression Model Modification
Based on the conclusion, we introduce lifecycle factor as the dummy variable into the coefficient of R & D den- sity factor, then we build the multi-factor dynamic model. The modified model is as follows.
( )
*(
)
* * * * &E R −Rf =β Rm−Rf +s SMB+e PEF+r θ R D (6)
( )
@STATE r=r −1 (7)
when the hi-tech industry is in the growth stage, θ =1, and when the hi-tech industry is in the maturity stage, 0
θ = . Then we use Calman filter to estimate ai, βi, si, ei and corresponding t-statistic.
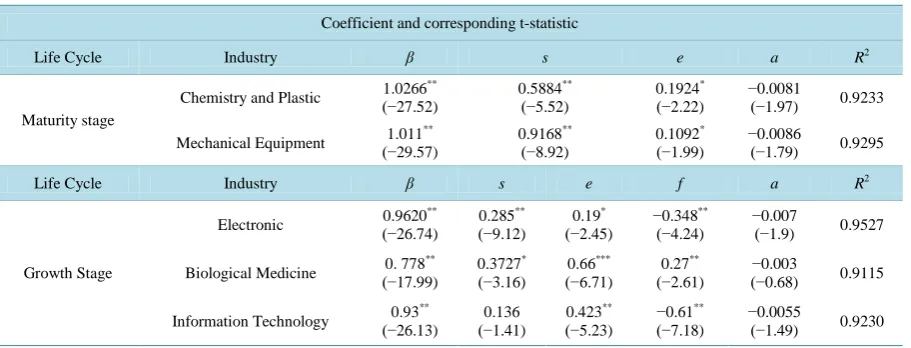
By analyzing Table 2, we can draw following conclusions: 1) the market premium factor, scale and price- earning ratio factor are significant, which are fit for the evaluation of the hi-tech industries’ investment value in Chinese stock market, while the book-to-market factor is not significant. The R & D density factor is significant to the growth-stage industry but not significant to the maturity-stage industry, which means the R & D density factor influences the enterprise in the different industry cycle differently. So the hypothesis H1, H2 and H3 is true; 2) The macroeconomic factors can hardly pass the significance test. They are only effective in the short term, but the effect to the securities market will be weakened greatly. The hypothesis 4 is false; 3) The adjusted
R2 of the modified regression model is almost between 0.91 and 0.96, which means the multi-factor dynamic model can fully explain the excess earnings of hi-tech enterprises portfolio.
5. Identification on the Investment Risk of Hi-Tech Enterprise
According to Table 2, we conclude the hi-tech enterprise investment risk, the details are as follow:
Table 2. The multi-factor dynamic model results after introducing the period variable.
Coefficient and corresponding t-statistic
Life Cycle Industry β s e a R2
Maturity stage
Chemistry and Plastic 1.0266 **
(−27.52) 0.5884
**
(−5.52) 0.1924
*
(−2.22) −0.0081 (−1.97) 0.9233
Mechanical Equipment 1.011
**
(−29.57) 0.9168
**
(−8.92) 0.1092
*
(−1.99) −0.0086 (−1.79) 0.9295
Life Cycle Industry β s e f a R2
Growth Stage
Electronic 0.9620
**
(−26.74) 0.285 **
(−9.12) 0.19
*
(−2.45) −0.348 **
(−4.24) −0.007 (−1.9) 0.9527
Biological Medicine 0. 778
**
(−17.99) 0.3727 *
(−3.16) 0.66 ***
(−6.71) 0.27
**
(−2.61) (−0.68) −0.003 0.9115
Information Technology 0.93 **
(−26.13) (−1.41) 0.136 0.423 **
(−5.23) −0.61
**
(−7.18) −0.0055 (−1.49) 0.9230
Data source: RESSET database. The data marked * is significant in 95% confidence level,and which marked ** is significant in 99% confidence level. When confidence level is 95%, critical value of t-test is about 2, and when confidence level is 99%, critical value of t-test is about 2.65.
• The hi-tech industries mostly have the “Small Firm Effect”. The scale factor coefficient of the hi-tech indus- try is more than zero, which means when the small-scale portfolio leads the large-scale portfolio, valuation factor contributes positive profit. And the hi-tech industry in growth-stage has Small Firm Effect more ob- viously than the hi-tech industry in maturity-stage. Because some small size listed hi-tech enterprises with small circulated stock value and unsteady financial situation, so they can be manipulated easily by some big funds.
• Characteristic of the hi-tech enterprises that is highly valued reflects that the investors expect the hi-tech in- dustry will achieve rapid development. The price-earning ratio coefficient of hi-tech industry is more than 0, means the industry be valued higher. When the high-devalued portfolio leads the low-devalued portfolio, valuation factor contributes positive profit. And the hi-tech industry in growth-stage has more obvious high-devalued characteristic than the hi-tech industry in maturity-stage. This shows that the domestic inves- tors put more attention on the develop expectation of the growth-stage industries. Besides, the growth-stage industries are always weak-periodicity, so it is less affected by the macroeconomyc and the profit level is steady enough to support the high price-earning ratio.
• The input on R & D contributes positively to the growth-stage hi-tech enterprise investment value, while the effect to the maturity-stage enterprise is uncertain. The main reason is that, in the growth stage, with the fierce market competition and increasing product production, the enterprises add the input on R & D and in- vents new product to get the competitive advantage. So the input on research and development is the signifi- cant factor which effects to the enterprise value. When the industry enters the maturity stage, the big enter- prises survived in the competition monopolize the whole market, so competition between firms turns from the price measures to the non-price measures. The input on the research and development is steady and its effect to the enterprise value is smaller.
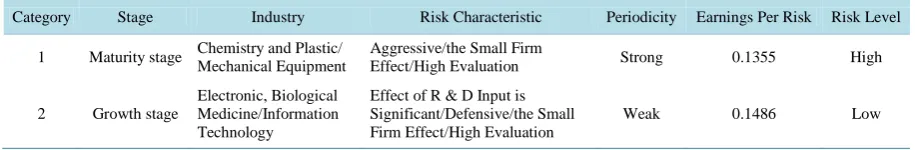
By analyzing above, we can identify the hi-tech industry investment risk, and the results can be seen in Table 3. The first category is effected by the economic cycle, its risk is higher than the second category, but earning is lower. So investing the hi-tech enterprise portfolio in the second category whose risk level is lower. For example, we can find that, when invest in the biological medicine industry, the earning is higher and steadier than the oth- er industries, so the portfolio has better prospect.
6. Countermeasures and Suggestion
According to the analysis of factors which affect return rate of hi-tech companies above, this paper gives sug- gestions for portfolio constructing and industrial policies as follow.
Table 3. The risk level of different hi-tech industry portfolio.
Category Stage Industry Risk Characteristic Periodicity Earnings Per Risk Risk Level
1 Maturity stage Chemistry and Plastic/ Mechanical Equipment
Aggressive/the Small Firm
Effect/High Evaluation Strong 0.1355 High
2 Growth stage
Electronic, Biological Medicine/Information Technology
Effect of R & D Input is Significant/Defensive/the Small Firm Effect/High Evaluation
Weak 0.1486 Low
and valuation risk, we can construct a portfolio which contains stock of other industries to pool the total risk. Taking finance industry and insurance industry as example, these two industries are characterized by big scale and low valuation. In order to reduce the scale risk and valuation, we could use stock of hi-tech industry compa- nied with stock of finance industry and insurance industry to construct a portfolio.
Making different policies for hi-tech enterprises in different lifecycle stages. According to the empirical con-clusion, demand for R & D input of hi-tech industries is different in individual life stage. So that government should support enterprises in growth stage with R & D funds, helping them to enhance product quality, develop core technology and build up self-owned brand; while the funds for enterprises in maturity stages should be cut, on the other hand government could assist these enterprises by improving reproduction of high-tech goods and expanding oversea market. Government can subsidize hi-tech companies by differentiated government alloca-tions funds, tax cutting and expanding financing channels to realize industrial reforming promotion.
Acknowledgements
This paper is achievement of project “Anlaysis the investment value and risk of science and technology enter- prises” (2013TCY003), and thank Graduate Innovation Fund of Tianjin University of Finance & Economics for their financial support.
References
[1] Fama, E.F. and French, K.R. (1993) Common Risk Factors in the Return on Stocks and Bonds. JournalofFinancial Eeonomics, 33, 3-56.
[2] Campbell, J.Y., Lettau, M., Malkiel, B.G. and Xu, Y.X. (2001) Have Individual Stocks Become More Volatile? An Em- pirical Exploration of Idiosyncratic Risk. TheJournalofFinance, 56, 1-43.
http://dx.doi.org/10.1111/0022-1082.00318
[3] Lev, B., Nissim, D. and Thomas, J. (2005) On the Informational Usefulness of R & D Capitalization and Amortization. [on line] accounting.rutgers.edu.
[4] Zhou, W.Y., Wang, Z.Y. and Su, L. (2011) Correlation between R & D and the Investment Value of Small High-Tech Companies. Accounting Monthly. FinanceandAccountingMonthly, 27, 36-38.
[5] Dosi, G., Llerena, P. and Labini, M.S. (2006) The Relationships between Science, Technologies and Their Industrial Exploitation: An Illustration through the Myths and Realities of the So-Called European Paradox. ResearchPolicy, 35, 1450-1464.http://dx.doi.org/10.1016/j.respol.2006.09.012
[6] Sun, X.-H. and Xin, M.-Y. (2013) The Threshold Regression Analysis Based on Chinese Industrial Department Panal Data. StudiesinScienceofScience, 31, 377-385.
[7] Pan, L. and Xu, J.G. (2011) The Risk Factors and Specific Factors in A-Share Market. JournalofFinancialResearch, 10, 83-87.
[8] Jawahar, I. and McLaughlin, G. (2001) Toward a Descriptive Stakeholder Theory: An Organizational Life Cycle Ap-proach. Academy of Management Review, 26, 397-414.
[9] de O. Cavalcanti, R. and Nosal, Ed. (2009) Some Benefits of Cyclical Monetary Policy. Economic Theory, 39, 195- 216.
[10] Sun, H.B. and Song, X. (2009) Build an Investment Portfolio Depended on Monetary Cycle. JournalofCentralUni- versityofFinance & Economics, 11, 41-45.
[11] Wan, Y.W., et al. (2005) The Factors Affect Stock Market Risk Premium. Journal of Financial Research, 12, 62-72.
Appendix
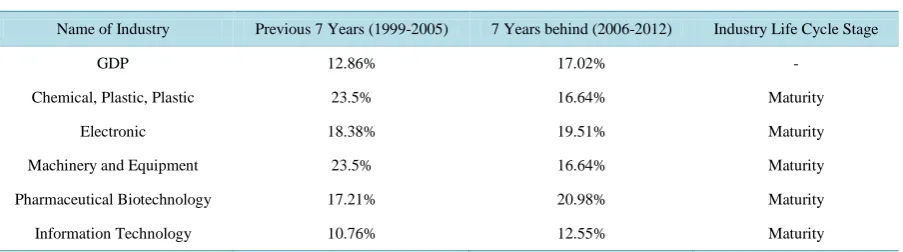
[image:8.595.89.541.174.300.2]This paper classified the stage of all listed companies in the technology industry using Growth Industry Tax- onomy, the result is shown in Table 4. This article uses the GDP growth rate to be representative of the growth rate of entire industrial sector. Taking into account the problems of data acquisition, we set previous stage per iodization in 7 years and stage behind in 7 years.
Table 4. Growth rates during the various industrial sectors adjacent.
Name of Industry Previous 7 Years (1999-2005) 7 Years behind (2006-2012) Industry Life Cycle Stage
GDP 12.86% 17.02% -
Chemical, Plastic, Plastic 23.5% 16.64% Maturity
Electronic 18.38% 19.51% Maturity
Machinery and Equipment 23.5% 16.64% Maturity
Pharmaceutical Biotechnology 17.21% 20.98% Maturity
Information Technology 10.76% 12.55% Maturity
currently publishing more than 200 open access, online, peer-reviewed journals covering a wide range of academic disciplines. SCIRP serves the worldwide academic communities and contributes to the progress and application of science with its publication.
Other selected journals from SCIRP are listed as below. Submit your manuscript to us via either