Design and Implementation of a Map Building Model for
Base Stations Placement
Alenoghena Caroline Omoanatse
Department of Telecommunications Engineering,Federal University of Technology Minna,
Emagbetere Joy Okumo
Department of Electrical/ElectronicUniversity of Benin, Nigeria
ABSTRACT
In this paper, a map building function which will display spatial data for the region surrounding a proposed base transceiver station (BTS) location has been developed. The agitation for more base stations and issues of non compliance of most Global system for mobile telecommunications (GSM) base stations in the country to stipulated safety requirement by regulatory agencies in Nigeria necessitated this research work. The placement of Base stations in cellular network is determined during the site selection process in radio network planning. Development of a digital spatial map for base station placement was born out of the need to make improved decisions on placement of base stations in built-up areas. The territory map was developed using a MATLAB scripts which converts coordinate data (longitude and latitude) to equivalent vector locations using binary codes. The model development process involve preprocessing of data, location generation and map plotting. The developed digital map gives a clear picture of the infrastructure on ground in form of square rasters. The developed map building model was implemented using spatial data collected from selected areas in Minna, Nigeria. The results reveal a 100% representation of the structures on ground.
Key Words
Base transceiver station, Map building, Regulation, Site, Selection
1. INTRODUCTION
The launch of GSM service in August 2001 to Nigeria resulted in an unprecedented increase of telecommunication users from about 500,000 in 2001 to over 120 million in 2013 with prospect for more market. As at March 2013, 97.36% of telecommunication users in Nigeria rely on the GSM platform [7]. The growth in the number of GSM subscribers has resulted in the multiplication of the number of base station in order to meet demand services. becomes a necessity. Since more BTS’s are needed, the issue of appropriate location for their placement became paramount to the regulatory body, to ensure environmental safety and that the operator gives more efficient and effective coverage and better service delivery. In cellular telecommunication system, deciding where to place the base station is a very important issue during the process of cell planning [1]. The BTS for a given geographical area has to be well positioned for maximum coverage and minimal interference. These are the indexes for measuring the quality of any mobile service [6].
In recent times, the Nigerian environmental regulatory body (NESREA) has had course to shut down some base stations that pose threat to public safety [4], resulting in poor service delivery. The presence of a BTS is always felt by the surrounding structures, human and material, irrespective of the fact that the BTS may stand alone on a space with the minimum space as specified by regulations; there is a call for the need to take neighbourhood concerns into consideration in
BTS placement [3]. The Site selection process in the deployment of wireless radio facilities is a tedious one especially in already built-up environment. [8].
Though no related work was available for review, this research was motivated by the need to reduce time and cost spent on site selection process involving scouting and visits. This work provides means for a more exhaustive search of a given territory for suitable locations for BTS placement while employing heuristic search tool like genetic algorithm and tabu search. A survey on challenges to base station placements reveal land issues as foremost problem in securing locations for BTS placement in Nigeria [2]. The task of securing BTS sites mostly in built-up urban settlements is tedious and subjective. The tools used by radio planners, like mapinfo are essential for network planning and optimization. They are used to plot drive test information, view cellular networks with sites and cells and analyze performance indicators of the system [9]. This research however considered the provision of a digital area map which will aid the radio planning engineer to make a cost resourceful site selection.
Presentations in this paper include; system model and programme development, implementation of the model and results, conclusion and future research direction.
2. MAP BUILDING MODEL
The map building model was developed as mathematical functions in Matlab 7.5 script. The functions were developed following the process flow diagram of fig 1.0
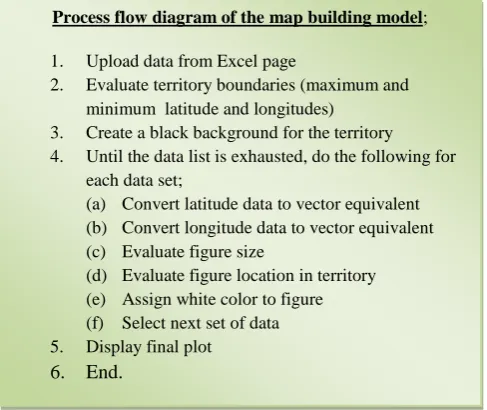
Process flow diagram of the map building model;
1. Upload data from Excel page
2. Evaluate territory boundaries (maximum and minimum latitude and longitudes)
3. Create a black background for the territory 4. Until the data list is exhausted, do the following for
each data set;
(a) Convert latitude data to vector equivalent (b) Convert longitude data to vector equivalent (c) Evaluate figure size
(d) Evaluate figure location in territory (e) Assign white color to figure (f) Select next set of data 5. Display final plot
[image:1.595.319.563.516.721.2]6. End.
32
2.1
Map Preprocessing function
This function analysis this data set provided and thus determine the total map area. The total map area is defined based on the minimum and maximum values of longitude and latitude. The conversion of a change in decimal degree to meters is referred to as the step size. The step size defines the relationship between the actual coordinates taken and the image displayed. The equivalent of one decimal degree change in longitude or latitude is approximated using the Harvesine formular [6] as;
Difference of 0.00001 (decimal degree) = 10 meters
The total plot size is given as a vector X, Y;
(1.1) and
(1.2) Where:
Xmax and Xmin are maximum and minimum values of Latitude
in the data set,
Ymax and Ymin are maximum and minimum values of
Longitude in the data set ∆ is the step size.
The building size is set here. This is dependent on the total territory size. For a direct replica of site plotted, the building size is equal to the step size.
2.2 The Map Location Generator
This function evaluates the vector location of each data set, and assigns a vector position for each set of data in the total map area defined by X Y. These locations are given as Ψx, and Ψy.
The location assignment is given as;
Ψ (1.3)
Ψ (1.4) Where;
, are the ith component of the data set under consideration.
2.3 The Map Plotting Function
This function assigns binary codes to each data set using an 8 bit representation. The image is assigned 8 bits per pixel giving a 256-colour image presented in binary format of 0 or 255 (white or black) . The 255 colour (white) is assigned to the space given by the map location generator (Ψx, Ψy) for
each data set and is given as;.
(1.5)
Ψ
Ψ
And
Ψ
Ψ (1.6)
Where n = 8.
3. BRIEF DESCRIPTION OF MINNA,
NIGERIA
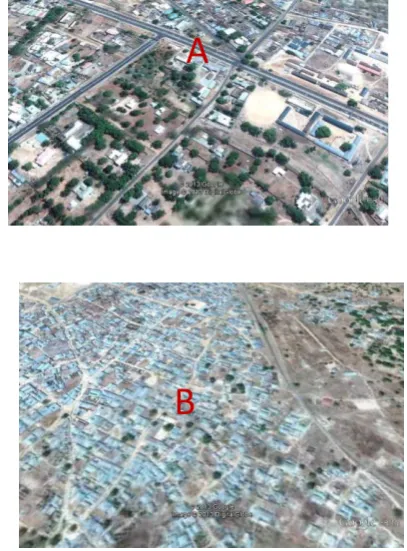
Minna town is an urban town in the central region of Nigeria, about 150 km from Abuja the countries capital city. Minna, like most urban towns in Nigeria, has two diverse types of settings; the planned urban settlement like GRA, Tunga and the unplanned settlements like Kpakungu, Sauka Kauta and Barikin Sale. The terrain in Minna can best be described as non-uniform as the town is blessed with surrounding hills. The inhabited regions in the town however are flat, with very scanty habitation in the hilly regions. Figure 2.0 shows the satellite view as well as photo imagery of some locations in Minna town. The town is devoid of any high rise building that could be used as a base to place BTS as is the case in towns in developed countries. The radio companies in Minna have erected mast/ towers beside each base station with towers in order to enhance their business operations.
3.1 Implementation of the Map Building
Model In Minna
[image:2.595.342.546.375.651.2]Sample field data are taken from different locations in Minna. Areas location coordinates of existing structures around base station were the target. The field data were taken with Germin Fig 2.0 Satellite Imagery of sections of Minna town A-Planned settlement, B-unplanned settlements
(Source: Google earth 2013)
A
made hand held GPS device with resolution of 2 – 5 meters. The areas covered were determined using the street map as a guide. The GPS equipment was switched on and allowed to track available satellites; this took about 5 minutes for each data recording. Four coordinates were taken for each feature recorded as longitude A and B and latitude A and B. All data collected are saved in the computer database in excel format. Tables 1.1 A, B, and C are samples of data collected from Okada road, FUT staff quarters Gidan kwano and Airport roads, all within Minna town. Coordinates of ground structures can also be collected on-line or from secondary sources.
Table 1.1 (A) Raw field data of coordinates of some features in Okada road Minna
S/ N
Latitude ‘x1’
(dec degrees
)
Longitud e ‘y1’
(dec degrees)
Latitud e ‘x2’
(dec degree
s)
Longitud e ‘y2’
(dec degrees)
Elevatio n (m)
1 9.63089 0
6.53220 9.6310 4
6.53219 285
2 9.63084 0
6.53168 9.6309 9
6.53169 261
3 9.63070 0
6.53136 9.6309 0
6.53127 269
4 9.63126 0
6.53215 9.6315 2
6.53222 291
5 9.63120 0
6.53195 9.6313 7
6.53191 270
6 9.63109 0
6.53158 9.6312 3
6.53159 270
7 9.63157 0
6.53204 9.6317 9
6.53208 277
Table 1.1 (B) Raw field data of coordinates of features in FUT Staff quarters Gidan kwano Campus S/
N
Latitud e ‘x1’
(dec degrees
)
Longitud e ‘y1’
(dec degrees)
Latitud e ‘x2’
(dec degrees
)
Longitud e ‘y2’
(dec degrees)
Elevatio n (m)
1 9.5254
1 6.44713
9.5255
5 6.44715 235
2 9.5257
8 6.44716
9.5259
1 6.44720 241
3 9.5261
5 6.44720
9.5262
6 6.44723 238
4 9.5265
5 6.44710
9.5265
8 6.44725 241
5 9.5262
0 6.44666
9.5263
3 6.44661 237
6 9.5265
5 6.44660
9.5266
8 6.44656 235
7 9.5268
8 6.44650
9.5270
3 6.44646 236
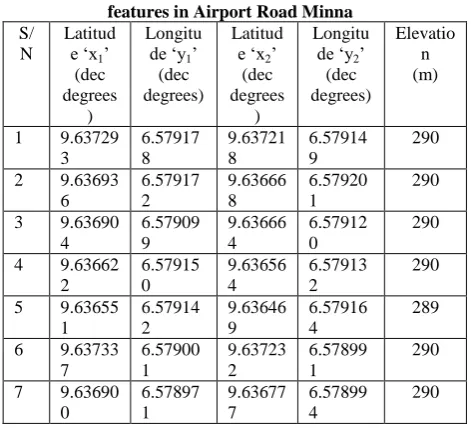
Table 1.1 (C) Raw field data of coordinates of some features in Airport Road Minna
S/ N
Latitud e ‘x1’
(dec degrees
)
Longitu de ‘y1’
(dec degrees)
Latitud e ‘x2’
(dec degrees
)
Longitu de ‘y2’
(dec degrees)
Elevatio n (m)
1 9.63729 3 6.57917 8 9.63721 8 6.57914 9 290
2 9.63693 6 6.57917 2 9.63666 8 6.57920 1 290
3 9.63690 4 6.57909 9 9.63666 4 6.57912 0 290
4 9.63662 2 6.57915 0 9.63656 4 6.57913 2 290
5 9.63655 1 6.57914 2 9.63646 9 6.57916 4 289
6 9.63733 7 6.57900 1 9.63723 2 6.57899 1 290
7 9.63690 0 6.57897 1 9.63677 7 6.57899 4 290
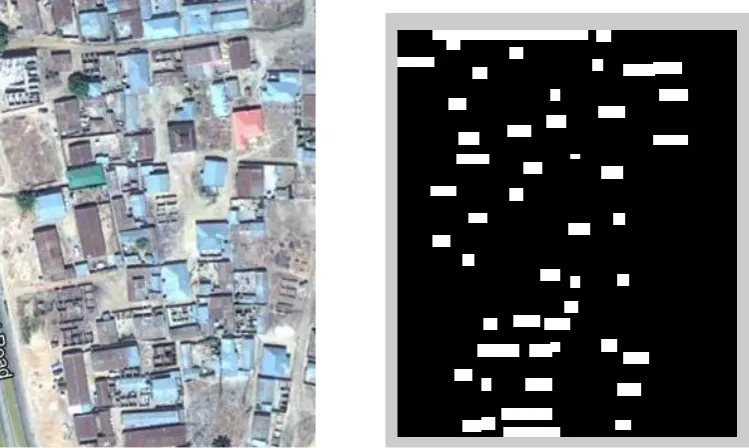
3.2 Results and Discussion
The spatial data collected for the various implementation sites were fed into the map building model and run in a 32 bit 256 ram pc. Results of the plotted maps are shown alongside the satellite imagery of the locations taken from Google earth imagery. The results are presented as Figures 3.1, 3.2 and 3.3 from the different sites in Minna town.
[image:3.595.313.549.82.297.2] [image:3.595.51.287.221.428.2] [image:3.595.51.288.456.659.2]34
Fig 3.2 Plot for Federal University of Technology Staff quarters, Gidan Kwano campus Minna
[image:4.595.101.504.280.421.2]Fig 3.3 Airport road, Minna
[image:4.595.133.508.467.691.2]4. CONCLUSION
In this paper, a map building model for the placement of base station has been developed and implemented. The developed map building model together with the other radio network planning tools will provide the radio engineer a view of the territory covered by a proposed base station site. This will go a long way in ensuring the selection of suitable sites for BTS placements. The spatial data base generated will also serve for other facility placement decisions. Further work on the map model is the integration of the model with an intelligent based BTS placement tool. Also the effect of variation of the step size will be studied.
5. REFERENCES
[1] Ajay M. (2004) “Fundamentals of Cellular Network Planning and Optimization” John Wiley & Sons Ltd, England (2004) pgs 21-31
[2] C. O. Alenoghena , J. O Emagbetere (2012) “Base Station Placement Challenges in Cellular Networks: The Nigerian Experience. “ proceedings of 4th
IEEE International Conference on Adaptive Science & Technology (ICAST) Ghana 25-27th Oct 2012. http://ieeexplore.ieee.org/xpl/login.jsp?tp=&arnumber=6 381057
[3] C O Alenoghena, J O Emagbetere and A M Aibinu 2013 “Artificial Intelligence Based Technique for BTS Placement” IOP Conf. Ser.: Mater. Sci. Eng. 53 012056 URL - http://dx.doi.org/10.1088/1757-899X/53/1/012056
[4] Guardian Newspaper [2012] “Nesrea-Ncc-Continue-Fight-over-Base-Stations” Tuesday 08 May 2012 http://www.ngrguardiannews.com
[5] Haversine Formula (2013)
http://rosettacode.org/wiki/Haversine_formula accessed on 11th Dec. 2013
[6] Kai L., Erkki L.’ and Jaakko L. (1998 ) “Radio Coverage Optimization with Genetic Algorithms” The 9th
IEEE International Symposium on Personal, Indoor and Mobile Radio Communication vol.1 pg 318-312.
[7] Nigerian Communications Commission “Subscriber data” http//www.ncc.org accessed on 29th
July 2013. [8] Rambally R. S. and Maharajh A.,(2009) “Cell Planning
Using Genetic Algorithm and Tabu Search” IEEE second International conference on Applications of Digital Information and Web Technologies, ICADIWT '09. London pgs 640-645
[9] Telecomhall (2011) “Mapinfo for Telecom- part 1” Online tutorial http://www.telecomhall.com/mapinfo-for-telecom-part-1.aspx assessed on 12th June 2013. [10]