Data Aggregation based Cooperative MIMO System for
Wireless Sensor Networks: Performance Analysis
Syed Akhtar Imam
Department of Electronics & Communication Engineering Jamia Millia Islamia, New Delhi,
India
Vibhav Kumar Sachan
Department of Electronics & Communication Engineering KIET Group of Institutions,
Ghaziabad, U.P, India
Shivani Singh
Department of Electronics & Communication Engineering KIET Group of Institutions,
Ghaziabad, U.P, India
ABSTRACT
To increase the life span of wireless sensor network, energy consumption must be minimized while satisfying given throughput and delay requirement. In this paper, we described an energy model based on cooperative MIMO scheme considering of both transmission and data aggregation energy is proposed for wireless sensor network. Based on this consequence, jointly considering both cooperative MIMO and data aggregation techniques which shows performance enhancement over conventional SISO system for same signal-to-noise ratio. Moreover, at critical distance value MIMO system outperforms SISO system is compared. The results show that MQAM is the best modulation technique is proved by simulations and suitable diversity technique for energy miniaturization to send a given number of bits are analyzed.
Keywords
Alamouti diversity schemes, Data aggregation, Energy Efficiency, Wireless sensor network.
1.
INTRODUCTION
World-wide communication is possible with anyone or anywhere using multi-media ranges evolving wireless communication. Wireless sensor networks are made up of various sensor devices that are spread over the geographical area to be monitored and communicate as well as gather information from environment using wireless links. Battery is the main power source in a sensor node, in this consequence energy is a very critical resource in wireless technology. To save energy efficient transmission technique is required so that energy consumption must be minimized while satisfying given throughput and delay requirements [1]. In order to minimize total energy consumption includes both transmission energy and circuit energy consumption for both MIMO and SISO systems have been proposed. Recent investigation on multi-input-multi-output (MIMO) illustrates a huge improvement of energy –efficiency in WSNs [3]-[9].However, direct application of MIMO techniques to sensor networks is not practical due to the limited physical size of sensor node which typically can only support a single antenna. Therefore, by allowing individual single antenna nodes tocooperate on information transmission and reception, a cooperative MIMO system can be constructed such that Energy efficient MIMO schemes can be developed. While data aggregation has been considered an essential tool for
integrating such data to reduce redundancy and to reduce energy consumption by minimizing number of transmission. In this context, an energy model for WSNs based on the energy consumption is formulated mathematically to calculate overall energy consumption of cooperative MIMO systems with data aggregation consideration. Following energy-efficient communication techniques for maximizing lifetime and for delay reduction of wireless sensor networks are discussed in this paper .A comparison study is done between MIMO approach and SISO approach at critical distance values. The results shows in this paper promises that joint consideration of the energy consumption of cooperative MIMO and data aggregation techniques will further reduce energy consumption and thus improves network lifetime. The rest of the paper is organized as follows: In section 2, System model for MIMO system including energy consumption is described. In section 3, Energy analysis of point-to-point communication systems for jointly considering data aggregation into a cooperative MIMO communication system is investigated .Comparisons of the critical distances at which cooperative MIMO outperforms the SISO system for different parameters discussed in section 4. Finally, summarizes our conclusions in section 5.
2.
SYSTEM MODEL
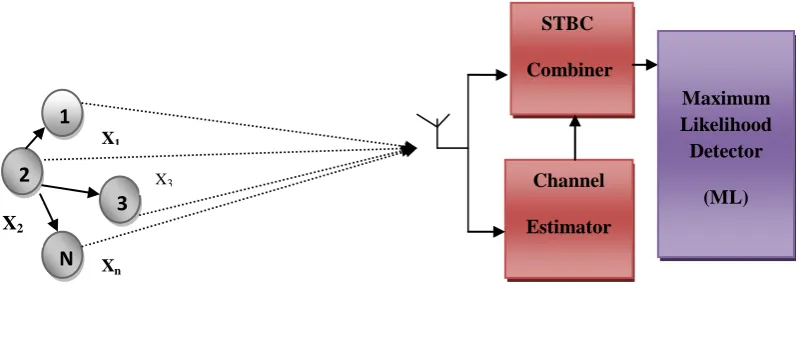
A better and practical approach to exploit diversity schemes in WSNs .Space-time coding (STC) technique in wireless systems are most widely used with the aim of joint channel encoding of multiple transmit antennas to achieve coding gain and diversity gain . As shown in figure 1, Alamouti space-time block code (STBC) employing two transmit antennas and a single receiver antenna [2]. s1 and s2 are two different symbols that are transmitted simultaneously in first time slot from antenna 1 and 2. Consecutively, two coded symbols
such as * 2
s
and * 1
s
are transmitted during next time slot. The main concept of the Alamouti’s STBC scheme for any number of transmit antenna based on orthogonal designs using both real and complex constellations to achieve diversity. Where (*) denotes complex conjugate.
The transmission code matrix for the Alamouti codes, multiplies the code matrix S by its Hermitian transpose ST satisfies as
Fig 1: A STBC Transmit Diversity system with M transmit antenna and 1 receive antenna
Fig 2: A cooperative STBC Transmit Diversity system with M transmit node and 1 destination node
I
s
s
SS
T
(
1 2
2 2)
(1)Where,
I
is the two-by-two identity matrix. Assume that both the paths experiences constant fading coefficients over the two consecutive symbol transmission intervals which can be expressed as:1 1 1 1
1
(
)
(
)
j
e
h
h
T
t
h
t
h
(2)2 2 2 2
2
(
)
(
)
j
e
h
h
T
t
h
t
h
(3)Where k=1, 2 are the amplitude gain and phase shift from the path from transmit antenna to the receiver antenna and T is the symbol duration. Therefore, the received signal in the first slot and in second time slot, is given as
1 2 2 1 1 1
)
(
t
r
h
s
h
s
r
(4)2 * 1 2 * 2 1 2
)
(
t
T
r
h
s
h
s
r
(5)Where, η1 and η2 are the complex white noise with zero mean
and variance σ2 for the first time slot and second time slot,
respectively. The receiver system is coherent and optimal, then the attempt to recover s1 and s2 can be given by the
following linear combination:
M k k M k k Hh
h
s
h
h
h
s
h
r
r
h
h
h
h
s
1 * 2 1 1 * 2 2 2 1 * 2 2 1 * 1 1 2 * 2 1 * 1 * 2 2 1~
(6)
The decision variable vector is denoted by
~
s
withs
meanand
M k k h 1 2
variance is sent to the ML detector. Ingeneral, the Alamouti space-time coding from two transmits antennas up to M transmit antennas. The basic concept of OSTBC is shown in figure 1 where, the scheme can achieve full transmit diversity up to M order with M transmit antennas while allowing the use of a very simple Maximum Likelihood detector (ML) and linear signal combining at receiver. Multiple-input-single-output MISO STBC is more practical and promising to be implemented in WSNs due to a simpler decoding algorithm which leads to lower processing energy at receiver. The pictorial concept of cooperative MISO STBC is shown in figure 2.
T
XR
3.
ENERGY EFFICIENCY OF
ALAMOUTI SCHEME BASED
COOPERATIVE MIMO SYSTEM IN
WSNS
Energy consumption of the proposed cooperative MIMO-based scheme with system parameters given in [3], [4] .The total energy consumption along the signal path can be divided into two main components: the power consumption of all the power amplifiers PPA and the power consumption of all other
circuit blocks Pc [3], [5]. The power consumption of the power amplifiers can be obtained as
out
PA
P
P
(
1
)
(7)
Where, α = ( ξ – η )/ η with η the drain efficiency of the RF power amplifier and ξ the peak to average ratio (PAR) which is depends on the modulation scheme and the associated constellation size. When the channel only experiences a square law path loss, we have
2 24
r t b b k f l outG
G
R
E
d
N
M
P
(8)
Where,
k
is the signal attenuation and Eb denotes requiredenergy per bit at the receiver for a given BER specification, Rb is the bit rate, d is the transmission distance, Gt is the
transmitter antenna gain, Gr is the receiver antenna gain, and λ
is the carrier wavelength, Ml is the link margin, and Nf is
receiver noise figure. The second term Pc in the total power
consumption as
)
(
)
(
ADC filt IFA mix LNA synth r synth filt mix DAC t CP
P
P
P
P
P
N
P
P
P
P
N
P
(9)
Where Nt are the number of transmitter antennas and Nr
number of receiver antennas respectively. PDAC, Pmix, PLNA,
PIFA, Pfltr, PADC and Psynare the power consumption values
for the Digital to Analog Converter (DAC), the mixer, the Low Noise Amplifier (LNA), the Intermediate Frequency Amplifier (IFA), the active filters at the transmitter side, the active filters at receiver side, the Analog to Digital Converter (ADC), and the frequency synthesizer, respectively. To estimate the values of PADC, PDAC and PIFA, we usethe model
introduced in [8]. Finally, the total energy consumption per bit for a fixed rate system can be obtained as
b C PA
bt
P
P
R
E
(
)
/
(10)
Where, Rb is the bitrate. Thus, total energy consumption is
estimated by multiplying Ebt by the number of bits to be
transmitted.
4. ENERGY ESTIMATION OF
COOPERATIVE MIMO WITH DATA
AGGREGATION
While MIMO systems are now increasingly considered as a key technique with aim to improve performance of wireless communication link and channel capacity over conventional single antenna system (SISO),the concept cooperative MIMO lead to better energy saving and communication delay
reduction as well. To exploit potential MIMO gains each node equipped with one or more antennas to emulate cooperatively transmit /and receive. For energy-constrained systems such as wireless sensor networks (WSNs), maximizing network life time is the main concern. By integrating data aggregation into a cooperative MIMO communication system, the lifetime of a WSN can be prolonged by several times compared to single antenna system (SISO).Moreover, the energy consumption of cooperative MIMO transmission and data aggregation are jointly considered to further reduce energy consumption and thus reduce transmission power.
Assume, there are N sensor nodes in a data aggregation cluster and each of which has Ni transmission bits, where
N
i
1
,
2
,...
.Firstly, data collected by multiple local sensors will be transmitted to a cluster head for aggregation. Finally, the aggregated data will be transmitted to a remote destination node in a cooperative MIMO approach or non cooperative approach (SISO). In this context, energy consumption for cooperative MIMO approach can be divided into four steps. In the first step, collected data transmitted to cluster head for data aggregation. At the second step, cluster head transmits the collected data to Mt-1 nodes. After eachnode receives all the information bits, these Mt nodes encode
the transmission sequence according to the Alamouti diversity codes. In the third step, since each node has a preassigned index i, they will transmit sequence which the ith antenna should transmit in an Alamouti MIMO system. On the receiving side, there are
M
r nodes joining the cooperative reception. Finally, in the fourth step, (Mr-1) assisting nodesfirst quantize each symbol they receive into nr bits then
transmit all bits using uncoded MQAM to the destination node for the joint detection. According the four stage communication approach described above, the total energy can be written as
N i S M h r r h i i r b N i N i M J N i i i to j i bf t i i MIMODF
E
N
E
n
N
N
E
N
E
E
N
E
r t 1 1 1 1 1 1 1 1 1
(11)
Where
E
it is the energy cost per bit for local transmission on the Tx side,i
1
,
2
,....
N
andE
bf denotes the energy costper bit for data aggregation.
E
toj denotes the local transmission energy cost per bit for cooperation communication, j = 1,2,….Mt-1 . i is the percentage ofremaining data after aggregation, which reflects the correlation between data amongst different sensors, and
E
br denotes the energy cost per bit for long haul MIMO transmission.E
hr denotes the local transmission energy cost per bit for joint detection on the receiving side, h = 1, 2…Mr-1, and
m N i i i s b N N
1 is the total number of symbol
received by each node at the receiving side with bm as the
1
1 1 1
N
i
N
i
N
i i i o i bf t i i SISO
DF
N
E
E
N
E
N
E
(12)
Where, Eo denotes the SISO long haul transmission. Here, it
may be noted that the first and second terms in equation (12) are exactly the same as those in equation (11), since the communication process are the same at these steps. Hence the difference in energy consumption between cooperative communication and non cooperative communication are not related with first two terms in equation (11) and equation (12). In this paper, two different communication schemes based on data aggregation are discussed below in the section.
4.1 Communication Scheme A
In Scheme A, after data aggregation N2 needs not to transmit
it all data to N1 where N2 knows which datum is redundant
and does not transmit the overlapped data to save energy as
shown in the figure 3. The total energy consumption of scheme A is given by
21 2 1 2
1
2 2 1
1
(
1(
)(
))
i i r b i
to i bf t
A
N
E
E
N
E
N
N
N
E
N
E
(13)
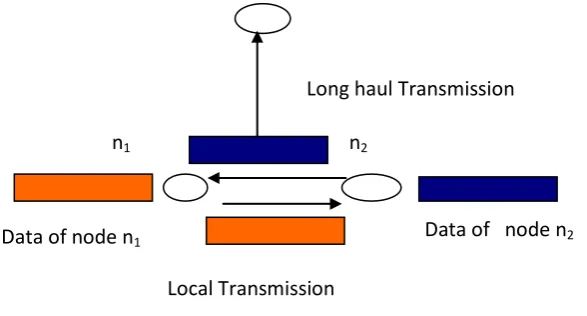
4.2Communication Scheme B
In scheme B, N2 will transmit all its data to N1 to meet critical
delay requirements where data aggregation algorithm is complex and time consuming in a real-time system as shown in the figure 4. The total energy consumption of scheme B is given by
21
2
1 2 2 1
1
i i
i r b to i bf t
B
N
E
E
N
E
N
E
N
[image:4.595.58.277.72.112.2]E
(14)
[image:4.595.126.546.99.591.2]Fig 3: Communication scheme A with data aggregation using Cooperative MIMO technique
Fig 4: Communication scheme B with data aggregation using Cooperative MIMO technique
5.
SIMULATIONS RESULTS
The numerical result based on MATLAB/Simulink .Findings based on simulation using mathematical model provide useful insights into certain performance aspects and identifying promising solutions for the energy-efficient WSNs. From figure 5 observe that M-ary Quadrature Amplitude Modulation (MQAM) modulation schemes is preferred for
better BER performance when Rayleigh fading is present in wireless sensor networks.
Table 1 Simulation parameters Simulation parameters Units Values
Carrier frequency, ( GHz 2.5
Bandwidth,(B) KHz 10
n
1n
2Data of node n
1Data of node n
2Long haul Transmission
Local Transmission
n
2n
1Data of node n
1Data of node n
2Long haul Transmission
[image:4.595.147.523.272.454.2] [image:4.595.127.421.489.647.2]Drain efficiency, (η) 0.35
Link margin ) db 40
Antenna gains,( ) dbi 5
Power consumption by
Mixer, mw 30.3
Power consumption by
filter, mw 2.5
Average bit error rate,
10
-3Power consumption by frequency synthesizer,
mw
50
Receiver noise figure,
,( db
10
The single-sided thermal
[image:5.595.316.541.69.303.2]noise PSD, dbm/hz -171
Fig 5 : BER performance comparison of different modulation techniques in Rayleigh fading channel
Figure 5,Shows BER performance curve for different modulation order of QAM. It is found that in Rayleigh fading BER at 10-1, 4-QAM gives better performance of 3 dB as compared to DPSK and 6dB as compared to FSK. Thus, it is concluded that Quadrature Amplitude Modulation (4-QAM) modulation schemes is preferred for better BER performance when Rayleigh fading is present in wireless sensor networks.
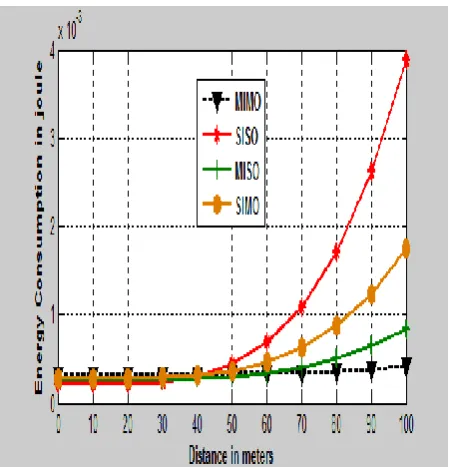
Fig 6 : Energy consumption versus distance for different diversity schemes
From figure 6 ,shows the effect of local and long-haul distance on total energy consumption .It is shown that MIMO outperforms at other techniques. From figure 7, energy consumption will further rreduce for MIMO with data aggregation scheme A than Scheme B for gamma 75%.
Fig 7: Comparison of energy consumption for different approaches
[image:5.595.57.271.70.468.2] [image:5.595.317.540.397.599.2]0 5 10 15 20 25 30 35 40 45 50 40
50 60 70 80 90 100 110 120
Local Transmission Distance in meters (dm)
C
ri
ti
c
a
l
P
o
in
t
o
f
L
o
n
g
-h
a
u
l
Tr
a
n
s
m
is
s
io
n
i
n
m
e
te
rs
(
d
)
The critical Distance over dm in scheme A (2 x 2) with gama
[image:6.595.315.541.68.313.2](gama = 60 %) (gama = 70 %) (gama = 80 %)
Fig 8 : Critical distance over dm in scheme A (2×2) with
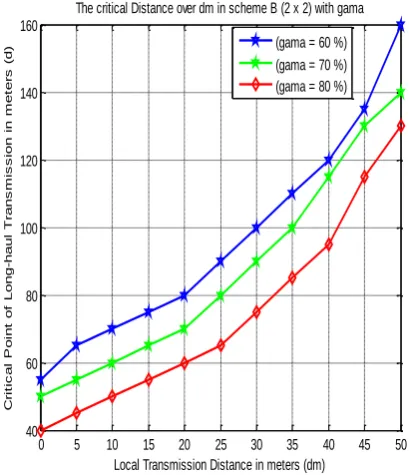
In figure 9, The total energy consumption of this scheme with
= 80%, 70% and 60% .the data of the two nodes are insignificant with
= 80% at critical distance . However, in scheme B, critical distance increases as
decreases from 80% to 60%.0 5 10 15 20 25 30 35 40 45 50 40
60 80 100 120 140 160
Local Transmission Distance in meters (dm)
C
ri
ti
c
a
l
P
o
in
t
o
f
L
o
n
g
-h
a
u
l
Tr
a
n
s
m
is
s
io
n
i
n
m
e
te
rs
(
d
)
The critical Distance over dm in scheme B (2 x 2) with gama
(gama = 60 %) (gama = 70 %) (gama = 80 %)
Fig 9: Critical distance over dm in scheme B (2×2) with
[image:6.595.67.266.75.300.2]From figure 10, total energy per bit Ebt is minimized for an optimal constellation size at different transmission distances. From figure 11, large amount of energy can be saved for MIMO optimal constellation size.
Fig 10: Energy consumption per bit versus constellation size.
From figure 11, Energy consumption is decreases as
decreases from 80% to 50% with scheme A.Fig 11: Energy consumption versus distance in meters for different
of scheme A6.
CONCLUSIONS
This paper proposed cooperative-MIMO technique with data aggregation based communication scheme-A can offer substantial energy savings in wireless sensors network based on simulations
.
Further,
analyzed the performance of MIMO system improved in Rayleigh fading channel using different modulation techniques. Simulation results show that the MIMO outperforms than other diversity techniques. In terms of BER performance, QAM is found to perform better for given Eb/No. Simulation results show the comparisons of the [image:6.595.316.553.380.609.2] [image:6.595.64.269.405.643.2]than SISO system. Optimized constellation size for each transmission distance for which energy consumption is minimized is evaluated.
7.
REFERENCES
[1] Paulraj, A.J., Gore, D.A., Nabar, R.U., 2003. “Introduction of Space-Time Wireless communication”, Preprint, Cambridge University Press, Cambridge, UK. [2] G.J.Foschini and M.J.Gans, “On limits of wireless
communications in a fading environment when using multiple antennas,’’Kulwer Wireless Pers.commun., vol.6, pp.311-335, Mar.1998.
[3] Cui. S., Goldsmith. A. J. and Bahai. A., (2004) “Energy-efficiency of MIMO and cooperative MIMO techniques in sensor networks”, IEEE Journal on Selected Areas in Communications, Vol. 22, No. 6, pp1089-1098s [4] S.K.Jayweera, “Energy analysis of MIMO techniques in
wireless sensor networks,” in 38th
Annual conf.on inform. Sci. and Syst. (CISS 04), Princeton, NJ, USA, Mar.2004.
[5] J.G.Proakis, Digital communications,4th ed. Mc Graw-Hill,New York,2000.
[6] X.Li, M.chen and W.Liu, “Application of STBC encoded cooperative transmission in wireless sensor networks,”IEEE signal processing Lett., vol.12,no.2, pp.134-137.
[7] Vibhav Kumar Sachan, Syed Akhtar Imam and M.R. Khan, “Integrated Energy Analysis of Space Time Block Codes for Energy Efficient RF Sensor Networks” International Journal of Telecommunication and Radio Engineering, Russia, Vol.71, Issue 19, PP. 1769-1780, Dec. 2012.
[8] Vibhav Kumar Sachan, Syed Akhtar Imam “Performance Analysis of Cooperative MIMO Techniques in Wireless Sensor Networks”. The IUP Journal of Telecommunication, INDIA, Vol.4, No. 2, PP. 32-41, May 2012