IJPSR (2019), Volume 10, Issue 7 (Research Article)
Received on 31 October 2018; received in revised form, 11 January 2019; accepted, 20 January 2019; published 01 July 2019
DEVELOPMENT AND VALIDATION OF A NEW HPLC-UV METHOD FOR SIMULTANEOUS
ESTIMATION OF CETIRIZINE HYDROCHLORIDE AND PHENYLEPHRINE
HYDROCHLORIDE IN TABLET FORMULATION
Debpratim Chakraborty, Rhitabrita Chakraborty, Sarbojit Kundu * and Rakesh Kumar Rishi Department of Pharmacognosy, Central Drugs Laboratory, Kolkata - 700016, West Bengal, India.
ABSTRACT: A simple, rapid, and sensitive high-performance liquid
chromatographic method with UV detection has been developed and validated according to the ICH guidelines for the quantitation of Cetirizine Hydrochloride (CET) and Phenylephrine Hydrochloride (PHEN) in the tablet dosage form. Chromatographic separation was carried out in a Zorbax eclipse plus, C18 column (250 mm × 4.6 mm; 5 µm particle size) with simple mobile phase composition of a mixture of Buffer (Water + 0.2% v/v Triethylamine, pH 7.5 by dil. H3PO4) and Acetonitrile (63:37 v/v) at a flow rate of 1ml/min and sample
injection of 20 µL was injected at 25 ºC. The eluent was monitored with a UV/VIS detector set at 232 nm with a total run time of 15 minutes. The method was linear over the concentration range of 20-100 µg/ml for CET and 40-100 µg/ml for PHEN with a correlation coefficient of 0.999 for both the analytes. Accuracy and precision values of both within-run and between-run were obtained from six different sets of three quality control (QC) samples analyzed on separate occasions for both the analytes ranged from 99.30% to 100.04% and 0.23% to 1.90%, respectively. Extraction recovery of analytes in the pharmaceutical formulation was found to be from 97.34% to 101.74%. The developed and validated method was successfully applied to the quantitative determination of CET and PHEN in a pharmaceutical formulation.
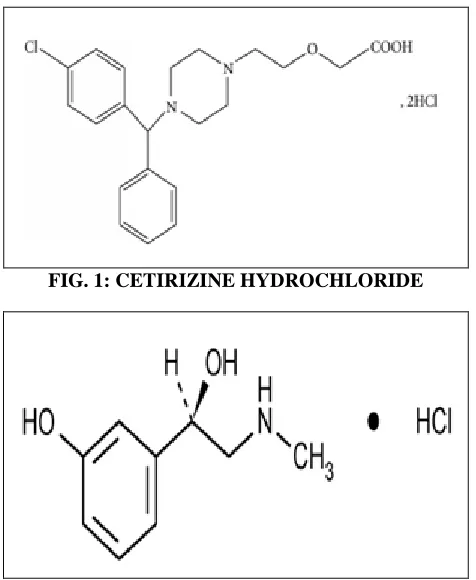
INTRODUCTION: Cetirizine Hydrochloride (CET), the Hydrochloride of 2-[4-(4-Chlorobenzhydryl) Piperazin-1-yl] ethoxy acetic acid. C21H25ClN2O3, 2HCl = 461.8 Fig. 1 1-3, is a piperazine derivative and metabolite of hydroxyzine and is described as a long-acting non-sedative antihistamine with some mast cell stabilizing activity. It appears to have a low potential for drowsiness in usual doses and to be virtually free of antimuscarinic activity. CET is used for the symptomatic relief of allergic conditions including rhinitis and chronic urticaria 4.
QUICK RESPONSE CODE
DOI:
10.13040/IJPSR.0975-8232.10(7).3349-53
The article can be accessed online on www.ijpsr.com
DOI link: http://dx.doi.org/10.13040/IJPSR.0975-8232.10(7).3349-53
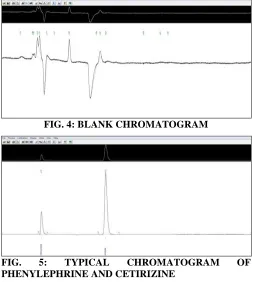
Phenylephrine (PHEN), the Hydrochloride of (R)-1- (3- hydroxyphenyl)- 2- methylamino ethanol (C9H13NO2, HCl; mol. Weight. 203.7) Fig. 21-3, is a sympathomimetic (selective α1 agonist) drug with a direct and predominant effect on adrenergic receptors. Topically, it is used as a nasal decongestant. It is also a frequent constituent of orally administered nasal decongestant preparations. It acts as a nasal decongestant by producing vasoconstrictory action on arterioles of the nasal mucosa. It also has been used to increase blood pressure by causing vasoconstriction, reflex bradycardia, produces mydriasis, etc. 4 CET & PHEN have been individually analyzed using HPLC methods in earlier studies.
However, a few analytical methods were reported for the simultaneous determination of CET and PHEN in a mixture by HPLC 5, 6.
Keywords:
High-performance liquid chromatography, UV-Spectro photometry, Cetirizine Hydrochloride
& Phenylephrine Hydrochloride
Correspondence to Author: Sarbojit Kundu
Department of Pharmacognosy, Central Drugs Laboratory, Kolkata - 700016, West Bengal, India.
An extensive review of the literature did not reveal any simple and suitable HPLC method for the simultaneous determination of both drugs 7-9. Therefore, attempts were made to develop a validated, simple, precise, and sensitive, isocratic reverse phase high performance liquid chromatographic method for simultaneous determination of both the drugs in pharmaceutical formulations.
[image:2.612.55.293.292.582.2]The proposed methods were validated in compliance with the ICH guidelines and were successfully applied for simultaneous analysis of Cetirizine Hydrochloride and Phenylephrine Hydrochloride in their pharmaceutical formulations during the normal course of testing in this laboratory.
FIG. 1: CETIRIZINE HYDROCHLORIDE
FIG. 2: PHENYLEPHRINE HYDROCHLORIDE
MATERIALS AND METHODS:
Chemicals and Reagents: CET and PHEN were available in the laboratory in pure form. Tablet formulation was received in this laboratory as a routine part of the quality check. Acetonitrile (HPLC Grade), Phosphoric acid (analytical grade from RANKEM), Triethylamine (HPLC grade from RANKEM), and HPLC-grade water generated from a Milli-Q water purification system were among the other chemicals and reagents used in the analysis.
The sample was received in this laboratory is procured from the pharmaceutical industry, and that is considered as Sample I and the sample is in tablet formulation.
Instrumentation and Chromatographic Conditions: HPLC apparatus (PerkinElmer; Model: Flexar) consisted of quaternary pump, multiple wavelength UV/VIS detector, auto-sampler, solvent manager, column oven and Total Chrom Navigator Version 6.3.2 software. Chromatographic separation was performed isocratically at room temperature using a Agilent Zorbax eclipse Plus, C18 (250 mm × 4.6 mm, 5 µm particle size) Mobile phase consisted of a mixture of Buffer (Water + 0.2% v/v Triethylamine, pH 7.5 by dil H3PO4) and Acetonitrile (63:37 v/v) at a flow rate of 1ml/min and sample injection of 20 µl was injected at 25 ºC. The eluent was monitored with a UV/VIS detector set at 232 nm.
Preparation of Stock and Working Solutions:
24.8 gm of CET and 25.1 gm of PHEN taken in a 25 ml volumetric flask and dissolving in the mobile phase to obtain a concentration of 1000 µg/ml. The stock solution stored in an amber colored labeled volumetric flask at 8 ºC.
Preparation of Calibration Standards and Quality Control (QC) Samples: Five calibration standards (CC) of CET and PHEN at the concentration of 10, 20, 50, 100 and 120 µg/ml were prepared by spiking 0.1, 0.2, 0.5, 1.0, 1.2 ml respectively to 10 ml by Mobile phase. Five calibration standards (CC) of PHEN at a concentration of 20, 40, 100, 200 and 250 µg/ml were prepared by spiking 0.2, 0.4, 1.0, 2.0, 2.5 ml respectively to 10 ml by Mobile phase. Three QC sample of CET 20, 50, 100 µg/mL and Three QC sample of PHEN 40, 100, 200 µg/ml were used respectively. All standards stored in an amber colored labeled volumetric flask at 8 ºC.
Preparation of Stock of Mixed Standard Solution: 5 mg of CET and 10 mg of PHEN are taken in 10 ml of Mobile Phase.
Method Validation: The proposed methods were validated in compliance with the ICH guidelines and were successfully applied for the determination of Cetirizine Hydrochloride and Phenylephrine Hydrochloride in their pharmaceutical formulations. This method was validated to meet the acceptance criteria with the ICH guidelines of method validation 10.
Selectivity: Selectivity of the method was determined by analyzing the blank (mobile phase), to demonstrate the lack of chromatographic interference at the retention time of the analytes.
Accuracy and Precision: Accuracy of an analytical procedure is the closeness of agreement between accepted conventional true values (reference values) and the values found. The accuracy of the proposed methods was tested by the determination of CET and PHEN at different concentration levels within the linear range of each compound. Precision was studied by determination of intra-day and inter-day precision. Intra-day precision was determined by injecting five standard solutions of three different concentrations on the same day, and inter-day precision was determined by injecting the same solutions for three consecutive days. Relative standard deviation (RSD %) of the peak area was then calculated to represent precision.
Extraction Recovery: Recoveries of CET were determined in the addition standard (20, 50, 100 µg/ml) by comparing the experimental and true values (20, 50, 100 µg/ml) and recoveries of PHEN were determined in the addition standard (40, 100, 200 µg/ml) by comparing the experimental and true values (40, 100, 200 µg/ml).
RESULTS AND DISCUSSION:
Optimization of Chromatography: In the work chromatographic conditions were optimized to obtain high sensitivity, reproducibility, and sample throughput for the determination of CET and PHEN. Both analytes contain basic nitrogen atoms and therefore have the potential to cause the peak tailing due to the interaction of these basic nitrogen atoms with the silanol group of the stationary phase during chromatographic separation. To obtain symmetrical peaks with better resolution, the chromatographic condition, i.e. pH of the buffer, the concentration of the organic modifier and
silanol blocker were optimized. A various chromatographic condition such as mobile phase composition, an analytical column with different packing materials (C8, C18, Phenyl, Cyano) and configuration (10, 15, 25 cm) was used to obtain sharp peak with reducing tailing, and better resolution with no peak impurity. Finally, Agilent Zorbax Eclipse Plus C18 column was selected which provided reduced peak tailing and acceptable peak purity index. Eclipse Plus C18 packing is made by first chemically bonding a dense monolayer of dimethyl-n-octadecylsilane stationary phase to a specially prepared, an improved ultra-high purity (>99.995% SiO2), ZORBAX Rx-SIL porous silica support. The bonded-phase packing is doubly end-capped using proprietary reagents and procedures to obtain maximum deactivation of the silica surface. Mobile phase composition was selected base upon the peak parameter (symmetry, tailing, resolution and peak purity index, etc.), run time, the case of preparation and cost.
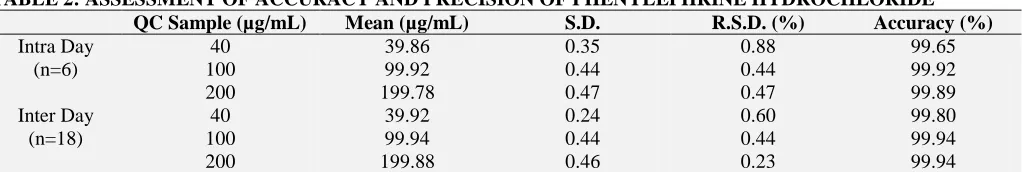
[image:3.612.313.566.476.758.2]The most suitable mobile phase composition was found to be Buffer (Water + 0.2% v/v Triethyl-amine, pH 7.5) and Acetonitrile (63:37 v/v) respectively. Under the chromatographic conditions outline, highly symmetrical, sharp peaks of CET and PHEN were obtained at retention time about 6.2 and 2.4 min. respectively. The total run time is 15 min taken for the analysis.
FIG. 4: BLANK CHROMATOGRAM
FIG. 5: TYPICAL CHROMATOGRAM OF
A typical overlay spectrophotometric examination 11-13
of both ingredients in mobile phase shows the significant absorbance at 232 nm hence the wavelength fixed at 232 nm.
[image:4.612.313.566.53.189.2]Selectivity: The method was found to selective as no significant interfering peak is observed at the retention times of CET and PHEN which were 6.2, and 2.4 min respectively. Total chromatographic run time was 15.0 min. Fig. 5 and 6 show the representative chromatograms of blank spiked with analytes.
FIG. 3: OVERLAY SPECTRUM
FIG. 6: CALIBRATION CURVE OF CETIRIZINE FIG. 7: CALIBRATION CURVE OF PHENYLEPHRINE
Accuracy and Precision: The accuracy and precision of the proposed methods were tested by the determination of CET and PHEN at different concentration levels within the linear range of each compound. The low SD (< 1) of six determinations indicated the high accuracy and precision of the proposed method. Collective results are shown in
[image:4.612.57.563.227.361.2]Table 1 and 2. The inter- and intra-day determination of CET and PHEN over 3 consecutive days by the same analyst using the same instrument is shown in Table 1 and 2. The low RSD (< 2%) reflects the ruggedness of the methods.
TABLE 1: ASSESSMENT OF ACCURACY AND PRECISION OF CETIRIZINE HYDROCHLORIDE
QC Sample (µg/mL) Mean (µg/mL) S.D. R.S.D. (%) Accuracy (%)
Intra Day (n=6)
20 19.96 0.34 1.68 99.80
50 50.02 0.37 0.74 100.04
100 99.74 0.32 0.32 99.74
Inter Day (n=18)
20 19.86 0.38 1.90 99.30
50 49.94 0.27 0.54 99.88
100 99.96 0.39 0.39 99.96
S.D. = Standard deviation; R.S.D. (%) (Relative standard deviation) = [(S.D. / Mean) × 100]; Accuracy (%) = [(Mean / Conc. Added) × 100]; n = number of replicates
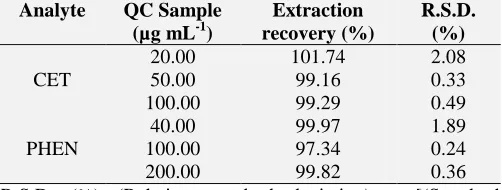
TABLE 2: ASSESSMENT OF ACCURACY AND PRECISION OF PHENYLEPHRINE HYDROCHLORIDE
QC Sample (µg/mL) Mean (µg/mL) S.D. R.S.D. (%) Accuracy (%)
Intra Day (n=6)
40 39.86 0.35 0.88 99.65
100 99.92 0.44 0.44 99.92
200 199.78 0.47 0.47 99.89
Inter Day (n=18)
40 39.92 0.24 0.60 99.80
100 99.94 0.44 0.44 99.94
200 199.88 0.46 0.23 99.94
Extraction Recovery: Recovery results were found to be satisfactory as these were consistent,
[image:4.612.53.564.614.700.2]TABLE 3:EXTRACTION RECOVERY OF ANALYTES (n = 5)
Analyte QC Sample (µg mL-1)
Extraction recovery (%)
R.S.D. (%)
CET
20.00 101.74 2.08
50.00 99.16 0.33
100.00 99.29 0.49
PHEN
40.00 99.97 1.89
100.00 97.34 0.24
200.00 99.82 0.36
R.S.D. (%) (Relative standard deviation) = [(Standard deviation /Mean) × 100]; n = number of replicates.
Implementation to Pharmaceutical Formulation:
This newly developed method was applied to determine the CET and PHEN in a pharmaceutical formulation (tablet). Result ware summarized in
Table 4.
TABLE 4: ESTIMATION CETIRIZINE AND
PHENYLEPHRINE IN DIFFERENT FORMULATION Sample Analyte Claim
(mg/Tab)
Found (mg/Tab)
%
Sample 1
CET 5 5.101 102.03
PHEN 10 10.198 101.98
CONCLUSION: Here, we have developed and validated an HPLC-UV method that has significant advantages over the previously published methods as it provides simple mobile phase composition for chromatographic separation, shorter run time for analysis, simple sample preparation as well as improved sensitivity. Therefore, this new method leads to a simple, feasible, cost-effective, rapid method with a high degree of accuracy and specificity to quantify CET and PHEN in tablet formulations with HPLC-UV simultaneously.
ACKNOWLEDGEMENT: Nil
CONFLICT OF INTEREST: Authors have read the journal’s policy on disclosure of potential conflict of interest and had none to declare. This method has been evolved by doing routine testing
of drug samples received for quality control in this laboratory.
REFERENCES:
1. Indian Pharmacopoeia. The Indian Pharmacopoeia
Commission Ghaziabad, 8th edition 2018.
2. British Pharmacopoeia. British Pharmacopoeia
Commission. London, 9th edition 2018.
3. The United States Pharmacopeia-National Formulary (USP–NF), USP 41–NF 36th ed. 2018. United States Pharmacopeial Convention: Rockville, Maryland, USA. 4. Martindale: The Complete Drug Reference.
Pharma-ceutical Press, 39th edition 2017.
5. Dewani AP and Patra S: Development and validation of a novel RP-HPLC method for simultaneous determination of Paracetamol, Phenylephrine hydrochloride, Caffeine, Cetirizine and Nimesulide in tablet formulation. Arabian Journal of Chemistry 2015; 8(4): 591-98.
6. Tonde T, Ramesh H, Bhandarkar S, Bopade TS and Hiradeve SM: Simultaneous estimation of Cetirizine hydrochloride and Phenylephrine hydrochloride in tablet dosage form by RP-HPLC. International Journal of Biomedical and Advance Research 2017; 8(12): 465-72. 7. Sethi PD: High-Performance Liquid Chromatography,
Quantitative Analysis of Pharmaceutical Formulations. CBS Publishers & Distributors, 1st edition 2007.
8. Dewani AP, Shelke PG, Bakal RL, Jaybhaye SS,
Chandewar AV and Patra S: Gradient HPLC-DAD determination of Paracetamol, Phenylephrine hydro-chloride, Cetirizine in tablet formulation. Drug Res (Stuttg) 2014; 64(5): 251-56.
9. Patel NK and Kalaveni KJ: Analytical method
development and validation of Cetirizine hydrochloride and Phenylephrine hydrochloride in the combined dosage form. Journal of Pharmaceutical Science and Bio-scientific Research 2015; 5(2): 180-86.
10. Validation of Analytical Procedures, Proceedings of the International Conference on Harmonisation (ICH), Geneva. Commission of the European Communities 1996. 11. Wankhede SB, Lad KA and Chitlange SS: Development
and validation of UV-Spectro photometric methods for Simultaneous estimation of Cetirizine hydrochloride and Phenylephrine hydrochloride in tablets. Inter Journal of Pharmaceutical Sci and Drug Res 2012; 4(3): 222-26. 12. Joshi R, Pawar N, Dongre U and Katiyar S: Effective
Quantitation of Acetaminophen, Phenylephrine
hydrochloride, Cetirizine hydrochloride and Caffeine in Pharmaceutical dosage form using UV-Spectroscopy. Journal of Pharmacy Research 2012; 5(2): 1018-21. 13. Clarke's Analysis of Drugs and Poisons. Pharmaceutical
Press, 4th edition 2011.
All © 2013 are reserved by International Journal of Pharmaceutical Sciences and Research. This Journal licensed under a Creative Commons Attribution-NonCommercial-ShareAlike 3.0 Unported License.
This article can be downloaded to Android OS based mobile. Scan QR Code using Code/Bar Scanner from your mobile. (Scanners are available on Google Play store)
How to cite this article: