IJPSR (2019), Volume 10, Issue 10 (Research Article)
Received on 23 January 2019; received in revised form, 18 April 2019; accepted, 13 June 2019; published 01 October 2019 DEVELOPMENT AND VALIDATION OF RP-HPLC METHOD FOR THE DETERMINATION OF DASATINIB IN TABLET DOSAGE FORM
Panchumarthy Ravi Sankar * and Saranu Anusha
Vignan Pharmacy College, Vadlamudi - 522213, Andhra Pradesh, India.
ABSTRACT: The objective of the present study was to develop and validate a novel RP-HPLC method for the determination of Dasatinib in the pharmaceutical dosage form. Chromatographic separation was conducted on agilent technologies-1260 series with the G1311C quaternary pump, Thermo Scientific C18 column (4.6 mm i.d. × 250 mm, 5 µm particle size) and equipped
with photodiode array detector G1315D. The mobile phase consisted of methanol and acetonitrile mixed in the ratio of 50:50 v/v, was used at a flow rate of 1 ml/min, and the detection wavelength was set at 323 nm. The retention time for Dasatinib was found to be 4.073 min. The calibration was linear (r2 = 0.999) in the concentration range of 2-10 µg/ml. The limit of detection and the limit of quantitation were found to be 0.5263 μg/ml and 1.5948 µg/ml, respectively. Recovery of Dasatinib in tablet formulation was observed in the range of 98.09-99.57%. Percentage assay of Dasatinib (Dasanat) was found to be 99.45% w/w. Thus the novel proposed method for Dasatinib was found to be feasible for the estimation of Dasatinib in bulk as well as the pharmaceutical dosage form.
INTRODUCTION: The chemical name of
Dasatinib is N-[2-Chloro-6-methylphenyl] -2- [[6-[4-(2-hydroxyethyl) -1- piperazinyl] -2-methyl-4-pyrimidinyl] amino] -5-thiazole carboxamide Fig 1. Dasatinib is utilized for the treatment of chronic myeloid leukemia and acute lymphoblastic leukemia. A thorough literature survey of Dasatinib revealed that very few analytical methods had been reported for estimation of Dasatinib hitherto. Majority of methods for determination of Dasatinib in biological fluids and pharmaceutical dosage forms includes LC-MS/MS 1-4, LC-MS 5-6, HPTLC-LC 7, HPTLC 8, UPLC-MS 9, HPLC-MS 10, RP-HPLC 11 and UV-Visible Spectrophotometric method 12-13.
QUICK RESPONSE CODE
DOI:
10.13040/IJPSR.0975-8232.10(10).4531-37
The article can be accessed online on
www.ijpsr.com
DOI link: http://dx.doi.org/10.13040/IJPSR.0975-8232.10(10).4531-37
[image:1.612.320.560.597.724.2]This novel proposed method contributes quick estimation, correct peak shape, precise, simple, and quick, use of smaller sample volumes and utilizing methanol as a mobile phase which is economical when compared with other existing methods. So, it is necessary to develop a simple, precise, and rapid RP-HPLC method for the quantitative determination of Dasatinib. This work describes the validation parameters stated by the International Conference on Harmonization [ICH] guidelines Q2 (R1) 14-18. The chemical structure of dasatinib is shown in Fig.1.
FIG. 1: CHEMICAL STRUCTURE OF DASATINIB Keywords:
Dasatinib, RP-HPLC, Validation, ICH guidelines Correspondence to Author: Dr. Panchumarthy Ravi Sankar
Professor and HOD,
Department of Pharmaceutical Analysis, Vignan Pharmacy College, Vadlamudi - 522213,Andhra Pradesh, India.
MATERIALS AND METHODS:
Chemicals and Reagents: The above said standard drug was gifted from Hetero Labs Ltd., Hyderabad, India. All the chemicals used in this method were of high-grade purity and purchased from Merck Chemical Division Ltd., Mumbai. HPLC grade acetonitrile, water, methanol, and triethylamine were obtained from Merck pharmaceuticals private Ltd., Mumbai, India. Commercial tablets of the above said formulation was obtained from a local pharmacy.
Instrumentation and Conditions: The High-Pressure Liquid Chromatographic system utilized was an Agilent high-pressure liquid chromatograph 1260 series with the GI311C quaternary pump, Thermo Scientific C18 column (5 µm particle size Χ 4.6 × 250 mm) (made in the USA) and a diode array detector G1315D was utilized. Ezchrome elite software was used for chromatography data acquisition, processing, and control of HPLC chromatograph. Digital pH meter (systronics model - 802), an electronic balance (Shimadzu TX223L), a sonicator (spectral lab, model UCB 40) and UV-Visible spectrophotometer (systronics model-2203) were used in this study.
Preparation of Mobile Phase: To prepare mobile phase HPLC grade methanol and acetonitrile were mixed in the ratio of 50:50% v/v and was filtered through 0.45 μm nylon membrane filter and degassed by sonication.
Preparation of Stock and Working Standard Solutions: Accurately 10 mg of pure Dasatinib was weighed and transferred into 10 ml clean volumetric flask and 5 ml mobile phase was added, if necessary, sonicate to dissolve. The volume was adjusted up to the mark with the mobile phase. This is the primary stock solution of Dasatinib with a concentration of 1000 μg/ml.
The secondary stock solution is prepared by adding 1 ml of primary stock solution in 10 ml volumetric flask and made up the volume with a mobile phase having the concentration range 100 μg/ml. Five standard working solutions were prepared for the calibration graph by adding defined volumes of the secondary stock solution and diluting with the mobile phase. The concentrations of Dasatinib are 2, 4, 6, 8, and 10 µg/ml, respectively.
Sample Preparation for Tablets: Accurately weighed twenty Dasatinib tablets, and the average weight was calculated. Accurately weighed a portion of tablet powder equivalent to 100 mg of Dasatinib and transferred into a 100 ml volumetric flask to this 50 ml mobile phase was added and sonicated for 15 min. The mobile phase was adjusted up to the mark. The solution was filtered using a 0.45 µm nylon filter. From the above solution pipette out 1.0 ml into a 100 ml volumetric flask and dilute with mobile phase up to the mark and mix well. It was further diluted to get the desired concentration. The amount present in the tablet was calculated from the plotted calibration graph or utilizing the regression equation. After setting the chromatographic conditions and stabilizing the instrument to obtain a steady baseline, the sample solution was loaded in the 20 µl fixed sample loop of the injection port.
Analytical Method Validation: Once the chromatographic and the experimental conditions were established, the method was validated by the determination of the following parameters such as specificity, system suitability, linearity, precision, accuracy, robustness, limit of detection (LOD) and limit of quantitation (LOQ) as per ICH Q2 (R1) guidelines.
System Suitability Parameters: The chromato-graphic systems used for analysis must pass system suitability before going to start the experiment. At first HPLC system is stabilized for forty minutes. Inject blank preparation (single injection) and standard preparation (six replicates) and record the chromatograms to evaluate the system suitability parameters such as tailing factor (NMT 1.5), theoretical plate count (NLT 3000) and retention time. The % RSD for the peak area of six replicate injections of Dasatinib standard NMT 2.0. The parameters, such as tailing factor, % RSD, and theoretical plates, were studied.
Linearity: Standard stock solution of the Dasatinib (1 mg/ml) was prepared with the mobile phase. To study the linearity range of drugs, serial dilutions were made from a standard stock solution in the range of 2-10 µg/ml.
analyte of interest without interference from placebo and degradation products. The specificity of the method was established by injecting blank, placeb, and standard solution in triplicate and recording the chromatograms.
Precision: The precision of the method was determined by repeatability (intra-day) and intermediate precision (inter-day). Repeatability was determined by performing six repeated analysis of the same working solution of Dasatinib on the same day, under the same experimental conditions. The intermediate precision of the method was assessed by carrying out the analysis on different days and also by another analyst performing the analysis in the same laboratory (between-analysts).
Accuracy: The accuracy of a method is defined as the closeness of a measured value to the true value. The recovery studies were carried out at 50%, 100% and 150% of the target level in the tablet in triplicate each in the presence of placebo.
Robustness: The robustness was determined by analyzing the same sample under various conditions. The factors considered to be: variations in the flow rate, the organic ratio of the mobile phase, and pH. There were no significant changes in the chromatographic pattern when the above modifications were made in the experimental conditions, showing that the method is robust. The % RSD of Dasatinib should not be more than 2.0%. LOD and LOQ: Limit of detection is the lowest concentration in a sample that can be detected, but not necessarily quantified under the stated experimental conditions. The limit of quantitation is the lowest concentration of an analyte in a sample which can be quantitatively determined with suitable precision and accuracy. LOD and LOQ were calculated based on using following formulas, LOD = 3.3 × σ/S and LOQ = 10 × σ/S, where σ is the deviation response, S is the slope of the calibration curve.
RESULTS AND DISCUSSION:
Method Development and Optimization: The current study was aimed at developing a sensitive, rapid, and accurate reversed-phase HPLC method for the analysis of Dasatinib in bulk drug and the pharmaceutical dosage form. To get decorous
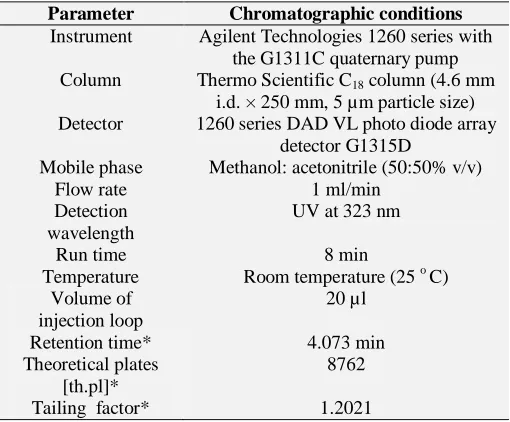
retention time, sharp and well-resolved peaks, the parameters such as different flow rates, detection wavelength, a choice of mobile phases containing acetonitrile, methanol, and HPLC grade water were studied. Good quality symmetrical sharp peak, minimum tailing factor in short run time was obtained with C18 column and mobile phase composed of methanol: acetonitrile in the ratio of 50:50 v/v, at a flow rate of 1 ml/min with maximum λmax at 323 nm. All the system suitability parameters were computed at the optimized chromatographic conditions. The retention time of 4.073, plate number of 8762, and a tailing factor of 1.2021 were obtained for Dasatinib. The obtained values of the entire system suitability parameters are within the limits of the agreeable range, which shows that the proposed method is fit for the detection of Dasatinib in the tablet form. The optimum chromatographic conditions and system suitability parameters are tabulated in Table 1.
TABLE 1: OPTIMIZED CHROMATOGRAPHIC CONDITIONS AND SST
Parameter Chromatographic conditions
Instrument Agilent Technologies 1260 series with the G1311C quaternary pump Column Thermo Scientific C18 column (4.6 mm
i.d. × 250 mm, 5 µm particle size) Detector 1260 series DAD VL photo diode array
detector G1315D
Mobile phase Methanol: acetonitrile (50:50% v/v)
Flow rate 1 ml/min
Detection wavelength
UV at 323 nm
Run time 8 min
Temperature Room temperature (25 o C) Volume of
injection loop
20 µl
Retention time* 4.073 min
[image:3.612.315.570.363.574.2]Theoretical plates [th.pl]*
8762
Tailing factor* 1.2021
*Number of six determinations
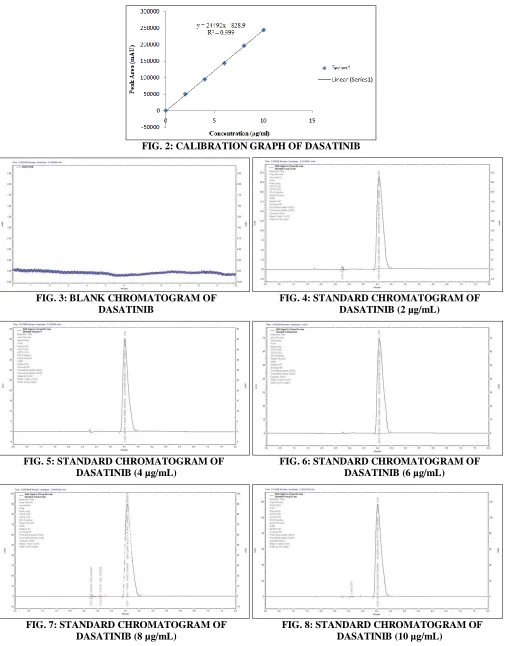
Linearity: The calibration curve was constructed between concentrations versus peak area prepared in the concentration range of 2-10 µg/ml of stock solution. The results are tabulated in Table 2.
TABLE 2: CALIBRATION DATA OF DASATINIB S.
no.
Concentration
(μg/ml) Peak area, (mAU)
1 2 49801
2 4 94609
3 6 143681
4 8 196870
FIG. 2: CALIBRATION GRAPH OF DASATINIB
FIG. 3: BLANK CHROMATOGRAM OF FIG. 4: STANDARD CHROMATOGRAM OF DASATINIB DASATINIB (2 µg/mL)
FIG. 5: STANDARD CHROMATOGRAM OF FIG. 6: STANDARD CHROMATOGRAM OF DASATINIB (4 µg/mL) DASATINIB (6 µg/mL)
FIG. 7: STANDARD CHROMATOGRAM OF FIG. 8: STANDARD CHROMATOGRAM OF DASATINIB (8 µg/mL) DASATINIB (10 µg/mL)
The calibration graph of Dasatinib is presented in Fig. 2. The regression equation was found to be Y = 24492x - 828.9. The correlation coefficient of Dasatinib r2 was noted as 0.999, which states that
The standard chromatograms of Dasatinib are presented in Fig. 4 to 8.
Specificity: Commonly used tablet excipients did not interfere with this method. It shows that the method is specific. Furthermore, the well-shaped peaks also indicate the specificity of the method. The specificity results are tabulated in Table 3.
TABLE 3: SPECIFICITY STUDY
Name of the solution Retention time (tR) min
Mobile phase No peaks
Placebo No peaks
Dasatinib 10 µg/ml 4.073 min
Precision: The system precision is done by using
the standard chemical substance to ensure that whether the analytical system is working properly or not. The retention time and area of 6 determinations were measured, and RSD was calculated. Blank and Standard solutions were injected six times into the HPLC system, and the chromatograms were recorded to obtain RSD. System precision results are shown in Table 4. It was noted that the % RSD values of precision for intra-day and inter-day Table 5 precision was 0.0022 and 0.0016, respectively. Intra-day and inter-day % RSD values lower than 2% assuring that this method was found to be fairly precise and reproducible.
TABLE 4: RESULTS OF SYSTEM PRECISION
Sample Concentration (µg/mL) Injection no. Peak area (mAU) Mean ± SD* % RSD#
Dasatinib 10 1 244830 244814.2 ± 56.4815 0.023
2 244827
3 244838
4 244841
5 244849
6 244700
*Each value is represented as a mean ± SD of 6 observations (n=6), SD: Standard Deviation, RSD: Relative Standard Deviation, # Acceptance criteria <2.0.
TABLE 5: INTRA-DAY AND INTER-DAY PRECISION DATA OF DASATINIB
Concentration
(μg/mL) Intra-day precision
Inter-day precision
Day 1 Day 2 Day 3
6 143680 143682 143681 143679
143683 143680 143684 143682
143681 143684 143682 143680
143685 143686 143680 143683
143687 143681 143685 143684
143688 143685 143679 143681
Mean ± SD* 1436 ± 3.224 1436 ± 2.366 1436 ± 2.316 1436 ± 1.870
% RSD# 0.0022 0.0016 0.0016 0.0013
*Each value is represented as a mean ± SD of 6 observations (n=6), SD: Standard Deviation, RSD: Relative Standard Deviation, # Acceptance criteria <2.0.
Accuracy: A study of recovery was conducted for Dasatinib intact tablet from about 50 %, 100 %, and 150 % of the initial assay concentration. Sample solutions were prepared in triplicate for each level and analyzed as per test method. The individual % recovery, % average recovery, and % RSD for recovery at each level were calculated, and the results are found to be within the limit. Accuracy results are shown in Table 6. Robustness: The robustness of the developed method was evaluated by small, deliberate changes in method parameters such as flow rate (± 0.2 ml/min), detection wavelength (± 5 nm) and mobile phase composition (± 5 %). The % RSD values of robustness, which is less than 2% reveal that the
proposed method is robust. The results of robustness study results are shown in Table 7.
TABLE 6: RESULTS OF ACCURACY
% Level Spiked
% Recovery
Mean % Recovery
% RSD
50 99.85 99.57 0.552
98.94 99.93
100 97.58 98.09 1.503
99.76 96.95
150 98.86 99.21 0.542
99.83 98.94
TABLE 7: ROBUSTNESS RESULTS OF DASATINIB
Parameters Optimized Used Retention
time (min)
Plate count $
Peak asymmetry #
Remarks
Flow rate (± 0.2 ml/min)
1.0 ml/min 0.8 ml/min 3.997 8780 1.12 *Robust
1.0 ml/min 4.073 8762 1.20 *Robust
1.2 ml/min 4.211 8750 1.23 *Robust
Detection wavelength (± 5 nm)
323 nm 318 nm 4.073 8762 1.25 Robust
323 nm 4.073 8762 1.20 Robust
328 nm 4.073 8762 1.23 Robust
Mobile phase composition (MEOH:ACN)
50:50 v/v 45:55 v/v 4.011 8750 1.20 *Robust
50:50 v/v 4.073 8762 1.20 *Robust
55:45 v/v 4.019 8769 1.22 *Robust
Acceptance criteria (Limits): # Peak Asymmetry < 1.5, $ Plate count > 2000, * Significant change in retention time. LOD and LOQ: The developed method was found
to be highly sensitive with LOD of 0.5263 μg/ml and LOQ of 1.5948 μg/ml. The LOD and LOQ values are presented in Table 8. The results of LOD and LOQ supported the sensitivity of the developed method.
TABLE 8: LOD AND LOQ RESULTS OF DASATINIB Limit of detection (LOD) 0.5263 μg/ml Limit of quantitation (LOQ) 1.5948 μg/ml
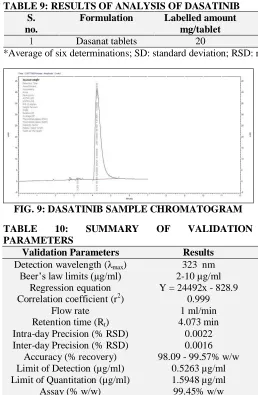
[image:6.612.45.303.354.749.2]Analysis of Tablet Formulation: The developed and validated method was successfully applied for the determination of Dasatinib in their tablet dosage form. The assay result Table 9 shows that the amount of the drug was in excellent agreement with the labeled value of the formulation. The representative sample chromatogram of Dasatinib is shown in Fig 9. Table 10 represents the summary of validation parameters.
TABLE 9: RESULTS OF ANALYSIS OF DASATINIB S.
no.
Formulation Labelled amount mg/tablet
Amount found mg/tablet
Mean % Assay ± SD
% RSD*
1 Dasanat tablets 20 19.89 99.45 ± 1 1.005
*Average of six determinations; SD: standard deviation; RSD: relative standard deviation
FIG. 9: DASATINIB SAMPLE CHROMATOGRAM
TABLE 10: SUMMARY OF VALIDATION
PARAMETERS
Validation Parameters Results Detection wavelength (λmax) 323 nm Beer’s law limits (µg/ml) 2-10 µg/ml
Regression equation Y = 24492x - 828.9 Correlation coefficient (r2) 0.999
Flow rate 1 ml/min
Retention time (Rt) 4.073 min Intra-day Precision (% RSD) 0.0022 Inter-day Precision (% RSD) 0.0016
Accuracy (% recovery) 98.09 - 99.57% w/w Limit of Detection (µg/ml) 0.5263 µg/ml Limit of Quantitation (µg/ml) 1.5948 µg/ml
Assay (% w/w) 99.45% w/w
CONCLUSION: In conclusion, a simple, accurate, sensitive, rapid, and precise RP-HPLC method was developed and validated for the estimation of Dasatinib in the pharmaceutical dosage form. Statistical analysis for the above said results demonstrates that the method is fit for the estimation of Dasatinib in tablet forms. The assay values were in good agreement with their respective labeled claim. The absence of interfering peaks in the chromatogram suggests that the tablet excipients do not interfere with the estimation of the drug by the proposed method. Hence, it is concluded that the proposed method can be utilized for research studies, quality control, and routine analysis for the quantification of Dasatinib in tablet dosage form with lesser resources available.
ACKNOWLEDGEMENT: The authors are
CONFLICT OF INTEREST: Nil REFERENCES:
1. Patel PN, Samanthula G, Sridhar V, Arla R, Varanasi KKVS and Swarop Kumar VVS: Validated LC-MS/MS method for simultaneous determination of Dasatinib and Sitagliptin in rat plasma. Analytical Methods 2014; 6: 433-39.
2. Michael TF, Shruti A, Dara H, Michael L, Steve U, Linda K and Bruce S: A validated LC-MS/MS assay for the simultaneous determination of the anti-leukemic agent Dasatinib and two pharmacologically active metabolites in human plasma: application to a clinical pharmacokinetic study. J Pharm Biomed Analysis 2012; 58: 130-35. 3. Cao S, Wang X, Zheng L, Sun M, Wang Y and Fan R:
Development of an LC-MS/MS method for the determination of Dasatinib in rat plasma. Lat Am J Pharm 2015; 34: 542-46.
4. Andriamanana I, Gana I, Duretz B and Hulin A: Simultaneous analysis of anticancer agents Bortezomib, Imatinib, Nilotinib, Dasatinib, Erlotinib, Lapatinib, Sorafenib, Sunitinib and Vandetanib in human plasma using LC-MS/MS. J. Chromatogr B 2013: 83-91.
5. Wen C, Zhang Q, He Y, Deng M, Wang X and Ma J: Gradient elution LC-MS determination of Dasatinib in rat plasma and its pharmacokinetic study. Acta Chromatographica 2015; 27: 81-89.
6. Furlong MT: Quantification of Dasatinib and its pharmacologically active metabolites in human plasma by LC-MS. Journal of Pharmaceutical and Biomedical Analysis 2012; 58: 130-35.
7. Mhaske D and Dhaneshwar S: Stability indicating HPTLC and LC determination of Dasatinib in the pharmaceutical dosage form. Chromatographia 2007; 95: 7-252.
8. Bhole R, Bonde C and Biradar P: Development and validation of stability indicating HPTLC method for estimation of Dasatinib and characterization of degradation products by using mass spectroscopy. Eurasian Journal of Analytical Chemistry 2018; 13: 1-11.
9. Eva K, Jurij T, Tadej P and Albin K: Simultaneous measurement of Imatinib, Nilotinib and Dasatinib in Dried blood spot by Ultra-High Performance Liquid Chromatography-Tandem Mass Spectrometry. Journal Chromatogr B 2012; 903: 150-56.
10. Antonio D and Avolio GV: HPLC-MS method of the antileukemia drugs Imatinib, Dasatinib and Nilotinib in human peripheral blood mononuclear cell. J of Pharmaceutical and Biomed Analysis 2012; 59: 109-16. 11. Dodda TNR, Regalla NR and Regalla MR: Method
development and validation of stability indicating RP-HPLC method for the estimation of Dasatinib in tablet dosage form. Indo American Journal of Pharmaceutical Research 2013; 3: 1331-45.
12. Panchumarthy R, Anusha S and Srinivasa Babu P: Development and validation of UV-Spectrophotometric method for determination of Dasatinib in bulk and pharmaceutical dosage form and its degradation behavior under various stress conditions. IJPSRR 2018; 53: 45-50. 13. Gowri Sankar D, Rajeswari A, Nagesh Babu A and Vamsi
Krishna M: UV-Spectrophotometric determination of Dasatinib in pharmaceutical dosage forms. Asian Journal of Chemistry 2009; 21: 5777-79.
14. Ravisankar P, Naga Navya C, Pravallika D and Navya Sri D: A review on step-by-step analytical method validation. IOSR Journal of Pharmacy 2015; 5: 7-19.
15. Ravisankar P, Gowthami S and Devala Rao G: A review on analytical method development. Indian J of Research in Pharmacy and Biotechnology 2014; 2: 1183-1195. 16. Ravisankar P, Swathi V, Srinivasa Babu P, Shaheem
Sulthana M and Gousepeer SK: Current trends in performance of forced degradation studies and stability indicating studies of drugs. IOSR Journal of Pharmacy and Biological Sciences 2017; 12: 17-36.
17. Kanthale SB, Thonte SS and Supekar BB: Development of stability indicating assay method. IJPSR 2019; 10: 1625-31.
18. ICH Q2 (R1): Validation of analytical procedures, Text and methodology. International Conference on Harmonization, Geneva 2005: 1-17.
All © 2013 are reserved by International Journal of Pharmaceutical Sciences and Research. This Journal licensed under a Creative Commons Attribution-NonCommercial-ShareAlike 3.0 Unported License.
This article can be downloaded to Android OS based mobile. Scan QR Code using Code/Bar Scanner from your mobile. (Scanners are available on Google Play store)
How to cite this article: