JOURNAL OFCLINICALMICROBIOLOGY, Nov. 2004, p. 5102–5108 Vol. 42, No. 11 0095-1137/04/$08.00⫹0 DOI: 10.1128/JCM.42.11.5102–5108.2004
Antimicrobial Susceptibility Testing of
Acinetobacter
spp. by
NCCLS Broth Microdilution and Disk Diffusion Methods
Jana M. Swenson,* George E. Killgore, and Fred C. Tenover
Division of Healthcare Quality Promotion, Epidemiology and Laboratory Branch, Centers for Disease Control and Prevention, Atlanta, Georgia
Received 2 April 2004/Returned for modification 21 June 2004/Accepted 19 July 2004
Although both broth microdilution (BMD) and disk diffusion (DD) are listed by NCCLS as acceptable meth-ods for testingAcinetobacterspp. for antimicrobial susceptibility, few studies have compared the results gen-erated by the two methods. We tested 196 isolates ofAcinetobacterspp. from nine U.S. hospitals and from the Centers for Disease Control culture collection by using BMD and DD and clinically appropriate antimicrobial agents. Categorical results for amikacin, ciprofloxacin, gatifloxacin, gentamicin, imipenem, levofloxacin, mero-penem, tobramycin, and trimethoprim-sulfamethoxazole were comparable for the two methods: there was only one very major (VM) error, with tobramycin, and only one major (M) error, with meropenem, when DD results were compared with BMD results. However, VM errors were frequent with the-lactams and -lactam–
-lactam inhibitor combinations, while M errors were often observed with tetracyclines. For BMD, tests frequently exhibited subtle growth patterns that were difficult to interpret, especially for-lactams. If subtle growth (i.e., granular, small button, or “starry” growth) was considered positive, error rates between BMD and DD were unacceptably high for ampicillin-sulbactam (VM error, 9.8%; minor [m] error, 16.1%), piperacillin (VM error, 5.7%; m error, 13.5%), piperacillin-tazobactam (VM error, 9.3%; m error, 12.9%), ceftazidime (VM error, 6.2%; m error, 11.4%), cefepime (VM error, 6.2%; m error, 13.0%), cefotaxime (m error, 21.2%), ceftri-axone (m error, 23.3%), tetracycline (M error, 11.4%; m error, 32.1%), and doxycycline (M error, 2.6%). When subtle growth patterns were ignored, the agreement still did not achieve acceptable levels. To determine if the problems with BMD testing occurred in other laboratories, we sent frozen BMD panels containing-lactam drugs and nine isolates to six labs with experience in performing BMD and DD. Among these laboratories, cefepime MICs ranged from<8 to>32g/ml for four of the nine strains, confirming the problem in inter-preting BMD results. Discrepancies between the categorical interpretations of BMD and DD tests were noted primarily with cefepime and piperacillin, for which the BMD results were typically more resistant. Clinical laboratories should be aware of these discrepancies. At present, there are no data to indicate which method provides more clinically relevant information.
Acinetobacterspecies are ubiquitous in nature and are the most common gram-negative organisms found on the skin of hospital personnel (1). Because of their ability to develop re-sistance to a variety of antimicrobial agents and to cause in-fection in debilitated hosts, isolates that are clinically signifi-cant must often be tested for antimicrobial susceptibility in order to guide anti-infective therapy (16). Although this group
of organisms is included with Pseudomonas aeruginosa in
NCCLS disk diffusion (DD) interpretive tables (Table 2B in NCCLS document M100-S14, M2) (15a), no published reports document the performance of the NCCLS reference methods,
broth microdilution (BMD) and DD, for Acinetobacter spp.
Therefore, we compared DD to BMD for this organism group. (This work was presented in part at the 103rd General Meet-ing of the American Society for Microbiology, WashMeet-ington, D.C., 18 to 22 May, 2003.)
MATERIALS AND METHODS
Bacterial strains.A total of 196 isolates ofAcinetobacterspp. were tested. Of this total, 117 isolates were obtained from 11 hospital laboratories in nine different states (California, Georgia, Illinois, Massachusetts, New York, New Jersey, North Carolina, Texas, and Washington), 15 isolates were obtained from
the Project ICARE (Intensive Care Antimicrobial Resistance Epidemiology) collection (3), and 64 were obtained from the Centers for Disease Control and Prevention (CDC) collection. All of the isolates from the hospital laboratories were selected randomly, i.e., they were not chosen because of any particular resistance characteristic or mechanism. Isolates from the ICARE and CDC collections were selected to include isolates representing all resistance patterns and species available. Appropriate quality control organisms were used for all testing. All isolates were frozen upon receipt and, when removed from the freezer, were subcultured twice prior to testing.
Identification.All strains were identified at the CDC by restriction fragment analysis of their ribosomal DNAs amplified as described by Vaneechoutte et al. (17, 19), except that a different reverse primer was used (TCA CAA AGT GGT AAG CGC CCT C). The PCR assay was validated by the use of genetically characterized strains from the CDC prior to use. Some of the strains were also identified by traditional biochemical methods (16).
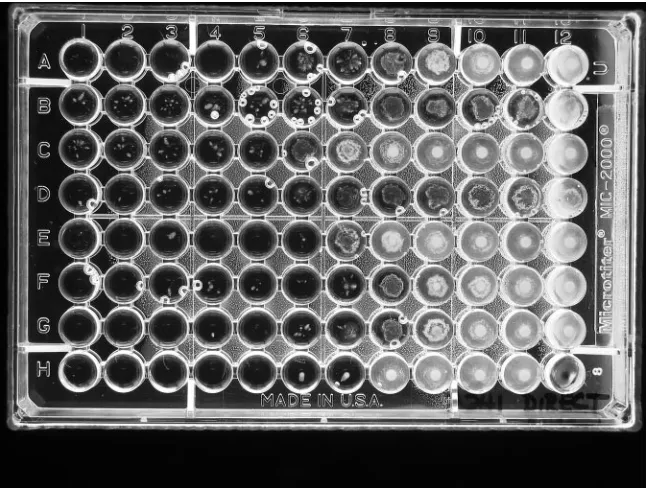
Susceptibility test methods.All strains were tested by NCCLS BMD and DD methods (10), using cation-adjusted Mueller-Hinton broth (Difco, Sparks, Md.) and Mueller-Hinton agar (BBL MH II; Becton Dickinson Microbiology Systems, Cockeysville, Md.) (11, 13). For BMD, when trailing or subtle growth patterns occurred above an obvious end point, two MIC readings were made, a conser-vative one at the highest concentration at which no growth occurred and a liberal one at a concentration that ignored any subtle growth above an obvious end point (Fig. 1).
Antimicrobial agents.The antimicrobial agents included in this study were as follows (concentrations tested, in micrograms per milliliter; source): amikacin (1 to 128; Sigma-Aldrich, St. Louis, Mo.), ampicillin-sulbactam (2:1) (0.03-0.015 to 64-32; Sigma and United States Pharmacopoeia, Rockville, Md.), cefepime (0.5 to 64; Bristol-Myers Squibb Co., Wallingford, Conn.), cefotaxime (0.5 to 64; Sigma), ceftazidime (0.5 to 64; Lilly Research Laboratories, Indianapolis, Ind.), ceftriaxone (0.5 to 64; Sigma), ciprofloxacin (0.12 to 16; Bayer Corporation, West Haven, Conn.), doxycycline (0.12 to 16; Sigma), gatifloxacin (0.25 to 32; Bristol-* Corresponding author. Mailing address: CDC, Mailstop G08, 1600
Clifton Rd., NE, Atlanta, GA 30333. Phone: (404) 639-0196. Fax: (404) 639-1381. E-mail: [email protected].
5102
on May 15, 2020 by guest
http://jcm.asm.org/
Myers Squibb), imipenem (0.12 to 16; Merck & Co., Rahway, N.J.), levofloxacin (0.25 to 32; Johnson & Johnson, Spring House, Pa.), meropenem (0.25 to 32; AstraZeneca Pharmaceuticals LP, Wilmington, Del.), piperacillin (1 to 128; Sigma), piperacillin-tazobactam (1-4 to 128-4; Sigma and Wyeth-Ayerst Phar-maceuticals, Pearl River, N.Y.), polymyxin B (0.5 to 16; Sigma), tetracycline (0.25 to 32; Sigma), ticarcillin-clavulanic acid (1-2 to 128-2; GlaxoSmithKline, Collegeville, Pa.), tobramycin (0.25 to 32; Sigma), and trimethoprim-sulfame-thoxazole (1:19) (0.25-4.8 to 8-152; Sigma).
Inoculum effect.Twelve strains that showed colonies beyond an obvious end point in the broth microdilution plates were retested at 0.2, 1, and 2 times the NCCLS recommended inoculum concentration of 5⫻105CFU/ml.
Fixed concentration versus fixed ratio of-lactamase inhibitor.The concen-trations of-lactam and-lactamase inhibitor drugs approved for use in labo-ratory testing by the NCCLS are a 2:1 ratio for ampicillin-sulbactam and fixed concentrations of inhibitors for piperacillin-tazobactam (4g/ml) and ticarcillin-clavulanate (2g/ml). In order to determine if the number of discrepancies between test results would decrease with a different configuration of-lactam agents and-lactamase inhibitors, we retested all strains by using both a fixed ratio (2:1) of-lactam agent to-lactamase inhibitor and a fixed concentration of-lactamase inhibitor with the-lactam agent for ampicillin-sulbactam (fixed concentration, 8g/ml), piperacillin-tazobactam (4g/ml), and ticarcillin-clavu-lanic acid (2g/ml). In addition, tazobactam and sulbactam were tested alone at concentrations of 0.12 to 128g/ml.
Interlaboratory testing.Frozen BMD panels prepared at the CDC containing ampicillin-sulbactam, piperacillin-tazobactam, piperacillin, ceftazidime, and cefepime were sent along with nine selectedAcinetobacterisolates to five labo-ratories with experience in performing NCCLS reference methods. Each of the five laboratories and the CDC tested the nine strains by BMD and DD with the BMD plates and disks supplied to them, but they used their own lot of Mueller-Hinton agar.
RESULTS
Identification. The identifications of the 196 isolates used for this study (to the species or genomospecies level) are shown in Table 1, along with the frequencies of very major errors (for one or more antimicrobial agents) in DD results
when compared with the results from BMD. TheAcinetobacter
calcoaceticus-baumanniicomplex (genomospecies 1, 2, 3, and 13) comprised 149 (76%) of the 196 isolates and gave 79.5%
(35 of 44) of the very major errors. Three of the isolates did not yield adequate growth by one of the methods; therefore, the total number of isolates with BMD results was 195 and the number with both BMD and DD results was 193.
Broth microdilution MICs. In the BMD tests, very small colonies or a star-like growth type (unique from the trailing observed with trimethoprim-sulfamethoxazole) was observed in wells containing high concentrations of several drugs, i.e., concentrations above which an obvious reduction in growth had occurred. This was noted for 64 (32.8%) of the 195
[image:2.585.131.455.69.313.2]organ-FIG. 1. Example of subtle growth patterns for an isolate of anAcinetobacter sp. Conservative MICs read were A4,⬎B1, ⬎C1, ⬎D1, E (unreadable), F2, G3, and H5. Liberal MICs read were A7, B7, C5, D6, E6, F7, G6, and H7. The bubbles in several wells can be ignored.
TABLE 1. Species identification of 196Acinetobactersp. isolates and frequency of isolates that express very major
errors by disk diffusion
Species (genomospecies)
Frequency (%)
No. (%)a with very major errors by DD
A. baumannii(GS 2)b
96 (49.0) 17 (38.6)
A. calcoaceticus(GS 1)b
5 (2.6) 1 (2.3)
A. haemolyticus(GS 4) 2 (1.0)
A. johnsonii(GS 7) 5 (2.6) 1 (2.3)
A. junii(GS 5) 2 (1.0)
A. lwoffii(GS 8/9) 6 (3.1) 3 (6.8) GS 3b
24 (12.2) 5 (11.4)
GS 10 2 (1.0)
GS 11 3 (1.6)
GS 10/11 1 (0.5)
GS 12 4 (2.0)
GS 13b 24 (12.2) 12 (27.3)
GS 14 3 (1.6) 1 (2.3)
GS 15 1 (0.5)
GS 16 1 (0.5) 1 (2.3) Unable to identify to species level 17 (8.7) 3 (6.8) Total 196 (100) 44 (100)
aAll errors were with-lactam agents, except for one with tobramycin. bGenomospecies 1, 2, 3, and 13 make up the A. calcoaceticus-baumannii complex.
on May 15, 2020 by guest
http://jcm.asm.org/
[image:2.585.301.540.521.700.2]isms and almost exclusively with the -lactam agents tested (Fig. 1). When such growth was noted, two end points were recorded, with one taking into account any growth in the well, even small colonies or subtle growth patterns after the large reduction in growth (called the conservative end point), and one that ignored colonies or subtle growth and called the MIC at the obvious reduction in growth (called the liberal end point). The MICs at which 50% of the isolates were inhibited
(MIC50values), the MIC90values, and the ranges of MICs for
19 antimicrobial agents tested are shown in Tables 2 and 3. The percentages of strains that were categorized as susceptible by the use of NCCLS interpretive criteria (except for polymyxin B) are also presented. For polymyxin B, a susceptible
break-point ofⱕ2g/ml and a resistant breakpoint ofⱖ4g/ml were
used, as suggested by Gales et al. (6). For the-lactam agents,
with which the presence of subtle growth above an obvious end point was most likely to occur, activities are given for both the conservative and liberal MIC readings (Table 2). When
con-servative MIC end points were used for the-lactam agents
(Table 2), the percentages of isolates that were susceptible were always lower than those when liberal MIC readings were used. The differences in percentages of susceptible isolates for
the two readings were all significant (P⬍0.01, except for
ceftri-axone [P ⫽0.03], by McNemar’s chi-square test). Since
pat-terns of subtle growth were not observed for the non--lactam
agents, only one MIC result is given for each in Table 3.
Ampicillin-sulbactam was the most active -lactam agent
tested (63.6 to 68.7% of isolates were susceptible); the least active agent was cefotaxime (15.9 to 20.5% of isolates were susceptible) (Table 2). As expected, the activity increased when the liberal MIC end point was used. Of the nonpenicillin and noncephalosporin agents tested (Table 3), the most active were polymyxin B (91.3% of isolates were susceptible) and imipenem (89.2% of isolates were susceptible). Of the two
-lactamase inhibitors tested, sulbactam exhibited a slightly
higher activity than tazobactam, as judged by the MIC50values.
Inoculum effect.Twelve strains were tested with inocula at
0.2, 1, and 2 times the recommended concentration of 5⫻105
CFU/ml. The presence of subtle growth or small colonies be-yond the obvious end point increased as the inoculum
in-creased; however, even using a 0.2⫻inoculum (i.e., 105CFU/
ml) did not eliminate the growth of colonies beyond the obvious end point.
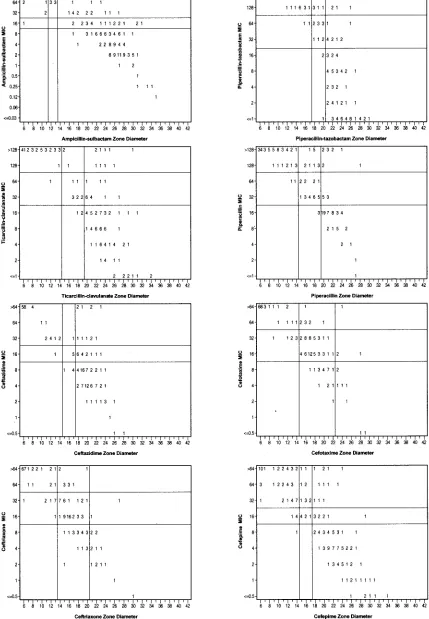
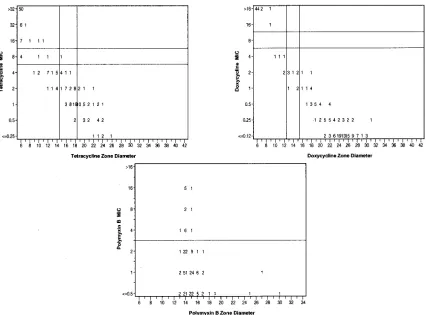
Correlation of MICs and zone diameters.Discrepancy rates for BMD versus DD are presented in Table 4, with
corre-sponding scatter plots for the-lactam agents (Fig. 2) and for
tetracycline, doxycycline, and polymyxin B (Fig. 3).
Unaccept-able error rates were noted for all of the-lactam agents tested
[image:3.585.301.541.87.291.2]and for tetracycline. Very major errors (susceptible according
TABLE 2. Activities of eight-lactam agents against 195arandomly selected isolates ofAcinetobacterspp., using both
conservative and liberal MIC readings
Antimicrobial
agent Reading
c MIC (g/ml)
% Susceptible
isolatesb
50% 90% Range
Ampicillin-sulbactam Cons 8 ⬎64 0.12–⬎64 63.6 Lib 4 ⬎64 0.12–⬎64 68.7 Piperacillin Cons 128 ⬎128 ⱕ1.0–⬎128 30.8 Lib 32 ⬎128 ⱕ1.0–⬎128 38.5 Piperacillin-tazobactam Cons 64 ⬎128 ⱕ1.0–⬎128 43.1 Lib 16 ⬎128 ⱕ1.0–⬎128 55.9 Ticarcillin-clavulanate Cons 32 ⬎128 ⱕ1.0–⬎128 46.7 Lib 16 ⬎128 ⱕ1.0–⬎128 54.4 Ceftazidime Cons 16 ⬎64 ⱕ0.5–⬎64 44.6 Lib 8 ⬎64 ⱕ0.5–⬎64 50.8 Cefotaxime Cons 32 ⬎64 ⱕ0.5–⬎64 15.9 Lib 32 ⬎64 ⱕ0.5–⬎64 20.5 Ceftriaxone Cons 32 ⬎64 ⱕ0.5–⬎64 19.0 Lib 32 ⬎64 ⱕ0.5–⬎64 22.1 Cefepime Cons 16 ⬎64 ⱕ0.5–⬎64 48.5 Lib 8 ⬎64 ⱕ0.5–⬎64 54.1
a
One unidentified isolate did not grow in the MIC plate. b
According to NCCLS criteria. c
Cons, conservative reading, i.e., not ignoring any growth; Lib, liberal reading, i.e., ignoring colonies or subtle growth patterns.
TABLE 3. Activity of 11 non--lactam agents against 195 randomly selected isolates ofAcinetobacterspp.
Antimicrobial agent
MIC (g/ml) %
Susceptible isolates
50% 90% Range
Ciprofloxacin 1.0 ⬎16 ⱕ0.12–⬎16 56.4 Levofloxacin ⱕ0.25 32 ⱕ0.25–⬎32 60.5 Gatifloxacin ⱕ0.25 32 ⱕ0.25–⬎32 60.0 Gentamicin 2 ⬎32 ⱕ0.25–⬎32 58.0 Tobramycin 1.0 ⬎32 ⱕ0.25–⬎32 69.7 Amikacin 4 64 ⱕ1.0–⬎128 80.0 Tetracycline 2 ⬎32 ⱕ0.25–⬎32 61.5 Doxycycline 0.25 ⬎16 ⱕ0.12–⬎16 74.9 Imipenem 0.25 8 ⱕ0.12–⬎16 89.2 Meropenem 1.0 16 ⱕ0.25–⬎32 80.5 Polymyxin B ⱕ0.5 2 ⱕ0.5–16 91.3a
Trimethoprim-sulfamethoxazole
0.5 ⬎8 ⱕ0.25–⬎8 58.5 Sulbactam 8 128 0.5–⬎128 —b
Tazobactam 16 128 0.5–⬎128 —
[image:3.585.42.283.97.274.2]aUsing a susceptible category ofⱕ2g/ml (see reference 6). b—, no interpretive criteria are available.
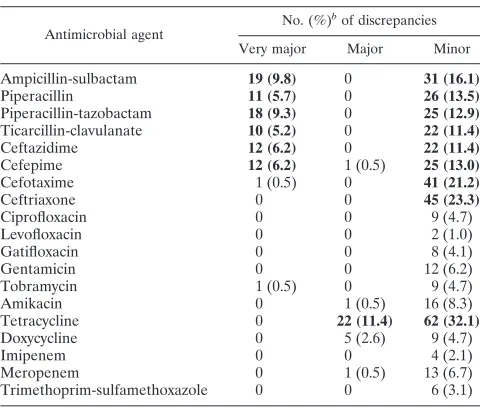
TABLE 4. MIC and zone diameter discrepancy rates for 19 antimicrobial agents and 193aAcinetobacterspp.
Antimicrobial agent No. (%)
b
of discrepancies
Very major Major Minor
Ampicillin-sulbactam 19 (9.8) 0 31 (16.1)
Piperacillin 11 (5.7) 0 26 (13.5)
Piperacillin-tazobactam 18 (9.3) 0 25 (12.9)
Ticarcillin-clavulanate 10 (5.2) 0 22 (11.4)
Ceftazidime 12 (6.2) 0 22 (11.4)
Cefepime 12 (6.2) 1 (0.5) 25 (13.0)
Cefotaxime 1 (0.5) 0 41 (21.2)
Ceftriaxone 0 0 45 (23.3)
Ciprofloxacin 0 0 9 (4.7) Levofloxacin 0 0 2 (1.0) Gatifloxacin 0 0 8 (4.1) Gentamicin 0 0 12 (6.2) Tobramycin 1 (0.5) 0 9 (4.7) Amikacin 0 1 (0.5) 16 (8.3) Tetracycline 0 22 (11.4) 62 (32.1)
Doxycycline 0 5 (2.6) 9 (4.7)
Imipenem 0 0 4 (2.1)
Meropenem 0 1 (0.5) 13 (6.7) Trimethoprim-sulfamethoxazole 0 0 6 (3.1)
a
Three isolates did not grow when tested by DD. b
The total population was used as the denominator. Unacceptable levels are shown in bold. They areⱖ1.5% for very major errors andⱖ3% for major errors, as recommended in NCCLS document M23 (12). Minor errors ofⱖ10% are also shown in bold.
5104 SWENSON ET AL. J. CLIN. MICROBIOL.
on May 15, 2020 by guest
http://jcm.asm.org/
[image:3.585.43.284.540.708.2]FIG. 2. Scatter plots comparing BMD MICs and DD zone diameters for eight-lactam antimicrobial agents against 193 isolates of Acineto-bacterspp.
on May 15, 2020 by guest
http://jcm.asm.org/
to DD but resistant according to BMD) occurred with ampi-cillin-sulbactam, piperacillin, piperacillin-tazobactam, ticarcil-lin-clavulanate, ceftazidime, and cefepime. Although using the
liberal readings for the-lactam agents (Table 5) reduced the
error rates slightly, they remained at an unacceptable level for all of the agents tested.
NCCLS has not established interpretive breakpoints for the DD method for polymyxin B. However, in this study and in a study by Gales and coworkers, DD did not differentiate the
presumed resistant population (MICⱖ4g/ml) from the
sus-ceptible population (MICⱕ2g/ml) (6).
Using a fixed concentration versus a fixed ratio of -lacta-mase inhibitor for BMD.To determine if the problems with
the-lactam–-lactamase inhibitor combinations could be
re-solved by using a fixed ratio of inhibitor to -lactam agent
instead of a fixed concentration of inhibitor, we used BMD to
test both fixed ratios and fixed concentrations of-lactamase
inhibitors. A comparison of the discrepancy rates is presented in Table 6. For all three agents, there were fewer very major
errors for the 2:1 fixed ratio of-lactam to-lactamase
inhib-itor than for the fixed concentration tested, but the error rates (very major or minor) remained at an unacceptable level for both formulations.
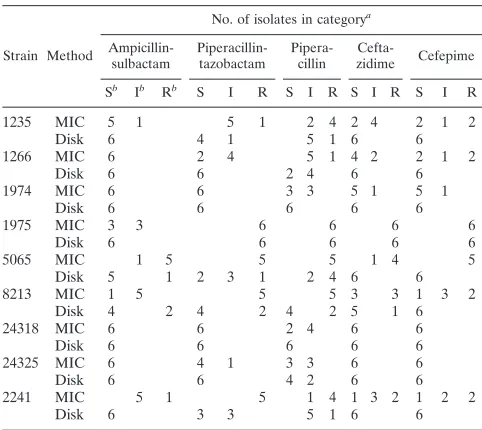
Interlaboratory testing.The testing of nine selected strains in six different laboratories confirmed that the testing problems could be replicated in other laboratories, even in those with considerable experience in performing NCCLS reference
test-ing methods. Variations in both the MIC results and the cat-egorical interpretations were observed for all of the strains for
one or more of the -lactam agents tested (Table 7). For
example, categorical interpretations for cefepime results var-ied from susceptible to resistant, and cefepime MIC results
ranged fromⱕ8 toⱖ32g/ml for four of the nine isolates. The
occurrence of very major errors for BMD versus DD was also highest for cefepime; however, very major errors occurred with
[image:5.585.80.506.68.383.2]FIG. 3. Scatter plots comparing BMD MICs and DD zone diameters for tetracycline, doxycycline, and polymyxin B against 193 isolates of Acinetobacterspp.
TABLE 5. BMD and DD discrepancy rates for eight antimicrobial agents, with comparisons of conservative readings
and liberal readings
Antimicrobial agent
Discrepancy ratea (%)
Very major Major Minor
Cons Lib Cons Lib Cons Lib
Ampicillin-sulbactam 9.8 7.8 0 0 16.1 13.0
Piperacillin 5.7 2.6 0 0 13.5 13.0
Piperacillin-tazobactam 9.3 2.6 0 0 12.9 10.4
Ticarcillin-clavulanate 5.2 1.6 0 0 11.4 8.8 Ceftazidime 6.2 2.1 0 0 11.4 9.8 Cefepime 6.2 1.6 0.5 0.5 13.0 9.3 Cefotaxime 0.5 0.5 0 0 21.2 23.8
Ceftriaxone 0 0 0 0 23.3 22.3
aThe total population was used as the denominator. Unacceptable levels are shown in bold. Cons, conservative reading, i.e., not ignoring colonies or subtle growth; Lib, liberal reading, i.e., ignoring growth beyond an obvious end point.
5106 SWENSON ET AL. J. CLIN. MICROBIOL.
on May 15, 2020 by guest
http://jcm.asm.org/
five of the nine strains for at least one of the-lactam agents tested (data not shown).
DISCUSSION
The increasing resistance ofAcinetobacterspp. to many
an-timicrobial agents has been well documented (4, 5, 7, 18, 20, 21). However, the optimal method for determining the in vitro
susceptibility ofAcinetobacterspp. to-lactams and other
an-timicrobial agents in the clinical laboratory has yet to be
de-termined. Although the testing ofAcinetobacterspp. by DD is
recommended in NCCLS document M2, Performance
Stan-dards for Antimicrobial Disk Susceptibility Tests:Approved Stan-dard,8th ed.(15), the breakpoints given in this document were
established primarily with large numbers ofEnterobacteriaceae
andP. aeruginosaand relatively few isolates ofAcinetobacter. Few studies have directly compared the results of BMD and DD for this genus. Because all commercial methods for anti-microbial susceptibility testing are verified by comparison to NCCLS reference methods, it is important that the accuracy of reference testing methods be validated.
In this study, the error rates for all of the non--lactam
antimicrobial agents tested, with the exception of tetracycline, were within the acceptable ranges established by the NCCLS (12). Although an unacceptable level of major errors occurred with tetracycline, the number of errors with DD for tetracy-cline could be reduced if the breakpoints for the disk diffusion test were adjusted.
Several problems with testing-lactam agents were
encoun-tered in this study. For many of the isolates tested, the pres-ence of sporadic or subtle growth beyond an obvious end point made determining an MIC end point difficult. Others have also
seen trailing end points with some-lactams (8). If, as the
NCCLS recommends in document M7 (14), the end point is read as the lowest concentration “that completely inhibits growth of the organism. . .as detected by the unaided eye,” then the presence of subtle growth and small colonies in the well should not be ignored. Because the high number of very major errors may have been due to reading the MIC end points too conservatively as a result of these subtle growth patterns, a
second MIC determination, which ignored the individual col-onies and star-like growth patterns, was included. Despite the manner in which the end points were determined, there re-mained an unacceptable level of very major errors for all of the
-lactam agents, with the exceptions of cefotaxime and
ceftri-axone (which showed unacceptable minor error rates). Unfor-tunately, there are neither human nor animal model data to indicate which end point (a DD or liberally or conservatively read BMD end point) is more clinically relevant.
Because polymyxin B has excellent activity against this group of organisms, for which there are limited therapeutic options, the need for interpretive criteria, particularly for BMD, is critical. Unfortunately, it does not appear from our data and from those of Gales and colleagues that a DD assay for poly-myxin B is likely to yield accurate results for this organism group. As Gales et al. discuss, this may be due to the fact that the polymyxin molecule diffuses poorly in agar, perhaps due to its size (6).
The therapeutic potential of using sulbactam alone has also been discussed (2). Since the activity of the combination of
ampicillin and sulbactam againstAcinetobacterspp. comes
al-most exclusively from the sulbactam component (2, 8, 9), the use of a combination disk may be able to predict the activity of sulbactam alone. However, further studies are needed to de-termine if breakpoints for sulbactam alone can be developed. In summary, the results of BMD and DD are concordant for
most non--lactam agents. Thus, DD can be used with
confi-dence forAcinetobacterspp. and these agents. While an
unac-ceptably high rate of major errors was observed with tetracy-cline, this problem may be resolved by readjusting the DD breakpoints to smaller zone diameters. The BMD tests for the
-lactam agents, which were difficult to read because of subtle
[image:6.585.43.285.99.247.2]growth beyond an obvious end point, continue to pose a prob-lem of interpretation. Further studies are needed to determine
TABLE 6. BMD and DD discrepancy rates for three antimicrobial agents when testing a fixed ratio versus a fixed
concentration of-lactamase inhibitor
Antimicrobial agent or expt conditionb n
No. (%) of
discrepancies Susceptible%
isolatesa Very major Major Minor
Ampicillin-sulbactam
Fixed ratio (2:1) 191 25 (13.1) 0 28 (14.7) 52.9 Fixed concentration
(8g/ml)
186 63 (33.9) 0 15 (8.1) 46.0 Piperacillin-tazobactam
Fixed ratio (2:1) 193 6 (3.1) 0 42 (21.9) 48.2
Fixed concentration (4g/ml)
192 25 (13.0) 0 48 (24.9) 37.6 Ticarcillin-clavulanate
Fixed ratio (2:1) 192 0 0 36 (18.8) 51.3
Fixed concentration (2g/ml)
192 5 (2.6) 0 21 (10.9) 51.8
aAccording to the NCCLS breakpoint for the-lactam agent. bNCCLS conditions are shown in bold.
TABLE 7. Variation in MIC and zone category from testing nine problemAcinetobacterspp. in six laboratories
Strain Method
No. of isolates in categorya
Ampicillin-sulbactam Piperacillin-tazobactam Pipera-cillin Cefta-zidime Cefepime Sb Ib Rb
S I R S I R S I R S I R
1235 MIC 5 1 5 1 2 4 2 4 2 1 2
Disk 6 4 1 5 1 6 6
1266 MIC 6 2 4 5 1 4 2 2 1 2
Disk 6 6 2 4 6 6
1974 MIC 6 6 3 3 5 1 5 1
Disk 6 6 6 6 6
1975 MIC 3 3 6 6 6 6
Disk 6 6 6 6 6
5065 MIC 1 5 5 5 1 4 5
Disk 5 1 2 3 1 2 4 6 6
8213 MIC 1 5 5 5 3 3 1 3 2
Disk 4 2 4 2 4 2 5 1 6
24318 MIC 6 6 2 4 6 6
Disk 6 6 6 6 6
24325 MIC 6 4 1 3 3 6 6
Disk 6 6 4 2 6 6
2241 MIC 5 1 5 1 4 1 3 2 1 2 2
Disk 6 3 3 5 1 6 6
aWhen the total number of results is⬍6, a laboratory reported that MICs were uninterpretable.
bS, susceptible; I, intermediate; R, resistant.
on May 15, 2020 by guest
http://jcm.asm.org/
[image:6.585.300.541.484.699.2]appropriate methods for testing-lactam antimicrobial agents and for testing sulbactam and polymyxin B.
ACKNOWLEDGMENTS
We thank the following individuals and institutions for donating clinical strains: Tamara L. Underwood, Duke University Medical Cen-ter, Durham, N.C.; Jean Spargo, Massachusetts General Hospital, Boston, Mass.; Stephen Jenkins, Mt. Sinai Hospital, New York, N.Y.; Donna Hacek, Northwestern Memorial Hospital, Chicago, Ill.; Doug Prince, Piedmont Hospital, Atlanta, Ga.; Susan Munro, Stanford Health Services, Palo Alto, Calif.; Janet Hindler, UCLA Medical Cen-ter, Los Angeles; Lettie McElmeel and Sharon Crawford, UTHSC, San Antonio; Judy Rothberg, UMDNJ-Robert Wood Johnson Med-ical School, New Brunswick, N.J.; and Thomas Fritsche and Sue Swanzy, University of Washington and Harborview Medical Center, Seattle, Wash. We also thank the following for their help during the multilaboratory phase of the study: Mary Jane Ferraro and Jean Spargo, Massachusetts General Hospital, Boston, Mass.; Janet Hind-ler, UCLA, Los Angeles; Ronald Jones and Douglas Biedenbach, JMI Labs, North Liberty, Iowa; James Jorgensen and Lettie McElmeel, UTHSC, San Antonio; and Ellen Jo Baron and Susan Munro, Stanford Health Services, Palo Alto, Calif.
The use of trade names is for identification purposes only and does not constitute endorsement by the Public Health Service or the U.S. Department of Health and Human Services.
REFERENCES
1.Allen, D. M., and B. J. Hartman.2000.Acinetobacterspecies, p. 2339–2344. InG. L. Mandell, J. E. Bennett, and R. Dolin (ed.), Principles and practices of infectious diseases. Churchill Livingstone, Inc., Philadelphia, Pa. 2.Corbella, X., J. Ariza, C. Ardanuy, M. Vuelta, F. Tubau, M. Sora, M. Pujol,
and F. Gudiol.1998. Efficacy of sulbactam alone and in combination with ampicillin in nosocomial infections caused by multiresistantAcinetobacter baumannii.J. Antimicrob. Chemother.42:793–802.
3.Fridkin, S. K., C. D. Steward, J. R. Edwards, E. R. Pryor, J. E. McGowan, Jr., L. Archibald, R. P. Gaynes, F. C. Tenover, and Project Intensive Care Antimicrobial Resistance Epidemiology Hospitals.1999. Surveillance of an-timicrobial use and anan-timicrobial resistance in U.S. hospitals: project ICARE phase 2. Clin. Infect. Dis.29:252.
4.Friedland, I., L. Stinson, M. Ikaiddi, S. Harm, and G. L. Woods.2003. Phenotypic antimicrobial resistance patterns inPseudomonas aeruginosaand Acinetobacter: results of a multicenter intensive care unit surveillance study, 1995–2000. Diagn. Microbiol. Infect. Dis.45:245–250.
5.Gales, A.C., R. N. Jones, K. R. Forward, J. Lin˜ares, H. S. Sader, and J. Verhoef.2001. Emerging importance of multidrug-resistantAcinetobacter species andStenotrophomonas maltophiliaas pathogens in seriously ill pa-tients: geographic patterns, epidemiological features, and trends in the SEN-TRY antimicrobial surveillance program (1997–1999). Clin. Infect. Dis.32
(Suppl. 2):104–113.
6.Gales, A. C., A. O. Reis, and R. N. Jones.2001. Contemporary assessment of antimicrobial susceptibility testing methods for polymyxin B and colistin: review of available interpretative criteria and quality control guidelines. J. Clin. Microbiol.39:183–190.
7.He´ritier, C., L. Poirel, D. Aubert, and P. Nordmann.2003. Genetic and
functional analysis of the chromosome-encoded carbapenem-hydrolyzing ox-acillinase OXA-40 ofAcinetobacter baumannii.Antimicrob. Agents Chemo-ther.47:268–273.
8.Higgins, P. G., H. Wisplinghoff, D. Stefanik, and H. Seifert.2004. In vitro activities of the-lactamase inhibitors clavulanic acid, sulbactam, and ta-zobactam alone or in combination with-lactams against epidemiologically characterized multidrug-resistantAcinetobacter baumanniistrains. Antimi-crob. Agents Chemother.48:1586–1592.
9.Levin, A. S.2002. MultiresistantAcinetobacterinfections: a role for sulbac-tam combinations in overcoming an emerging worldwide problem. Clin. Microbiol. Infect.8:144–153.
10.NCCLS.2000. Methods for dilution antimicrobial susceptibility tests for bacteria that grow aerobically. Approved standard, 5th ed. NCCLS docu-ment M7-A5. NCCLS, Wayne, Pa.
11.NCCLS.2000. Performance standards for antimicrobial disk susceptibility tests. Approved standard, 7th ed. NCCLS document M2-A7. NCCLS, Wayne, Pa.
12.NCCLS.2001. Development of in vitro susceptibility testing and quality control parameters. Approved guideline, 2nd ed. NCCLS document M23-A2. NCCLS, Wayne, Pa.
13.NCCLS.2002. Performance standards for antimicrobial susceptibility testing. Twelfth informational supplement. NCCLS document M100-S12. NCCLS, Wayne, Pa.
14.NCCLS.2003. Methods for dilution antimicrobial susceptibility tests for bacteria that grow aerobically. Approved standard, 6th ed. NCCLS docu-ment M7-A6. NCCLS, Wayne, Pa.
15.NCCLS.2003. Performance standards for antimicrobial disk susceptibility tests. Approved standard, 8th ed. NCCLS document M2-A8. NCCLS, Wayne, Pa.
15a.NCCLS.2004. Performance standards for antimicrobial disk susceptibility testing. Fourteenth informational supplement. NCCLS document M100-514. NCCLS, Wayne, Pa.
16.Schreckenberger, P. C., M. I. Daneshvar, R. S. Weyant, and D. G. Hollis.
2003.Acinetobacter,Achromobacter,Chryseobacterium,Moraxella, and other nonfermentative gram-negative rods, p. 749–779. InP. R. Murray, E. J. Baron, J. H. Jorgensen, M. A. Pfaller, and R. H. Yolken (ed.), Manual of clinical microbiology. ASM Press, Washington, D.C.
17.Seifert, H., L. Dijkshoorn, P. Gerner-Smidt, N. Pelzer, I. Tjernberg, and M. Vaneechoutte.1997. Distribution ofAcinetobacterspecies on human skin: comparison of phenotypic and genotypic methods. J. Clin. Microbiol.35:
2819–2825.
18.Urban, C., S. Segal-Maurer, and J. J. Rahal.2003. Considerations in control and treatment of nosocomial infections due to multidrug-resistant Acineto-bacter baumannii.Clin. Infect. Dis.36:1268–1274.
19.Vaneechoutte, M., L. Dijkshoorn, I. Tjernberg, A. Elaichouni, P. De Vos, G. Claeys, and G. Verschraegen.1995. Identification ofAcinetobactergenomic species by amplified ribosomal DNA restriction analysis. J. Clin. Microbiol.
33:11–15.
20.Vila, J., J. Ruiz, M. Navia, B. Becerril, I. Garcia, S. Perea, I. Lopez-Her-nandez, I. Alamo, F. Ballester, A. M. Planes, J. Martinez-Beltran, and T. J. De Anta.1999. Spread of amikacin resistance inAcinetobacter baumannii strains isolated in Spain due to an epidemic strain. J. Clin. Microbiol.37:
758–761.
21.Yum, J. H., K. Yi, H. Lee, D. Yong, K. Lee, J. M. Kim, G. M. Rossolini, and Y. Chong.2002. Molecular characterization of metallo- -lactamase-produc-ingAcinetobacter baumanniiandAcinetobactergenomospecies 3 from Korea: identification of two new integrons carrying theblaVIM-2gene cassette.
J. Antimicrob. Chemother.49:837–840.
5108 SWENSON ET AL. J. CLIN. MICROBIOL.