Copyright © 2001, American Society for Microbiology. All Rights Reserved.
Comparison of Two Methods for Serotyping
Campylobacter
spp.
DOROTHY MCKAY, JUNE FLETCHER, PEGGY COOPER,ANDFIONA M. THOMSON-CARTER* Department of Medical Microbiology, Grampian University Hospitals Trust, Foresterhill,
Aberdeen AB25 2ZN, Scotland
Received 18 January 2001/Returned for modification 4 March 2001/Accepted 14 March 2001
Two serotyping schemes (Penner and Laboratory of Enteric Pathogens [LEP]) based on soluble heat-stable
antigens were used to analyze 3,788Campylobactersp. isolates. A significant percentage (36.6%) was untypeable
using LEP serotyping; greater cross-reaction was also observed. The relative discrimination capabilities of the techniques were similar. Penner serotyping fulfils more of the requisite criteria for typing methods.
Campylobacterspp. are the major cause of bacterial gastro-intestinal disease in the United Kingdom: more than 60,000 cases of infection were reported in 1999. Further, the reported figure is considered to be a 7.6-fold underestimate of the true community incidence (18). Many phenotypic and genotypic methods have been applied in the characterization of isolates for epidemiological purposes (11). No single ideal typing method has been identified, although several of those pro-posed have utility in epidemiological investigations alone or in combination (6, 10, 12, 16). Serotyping based on the soluble heat-stable (HS) antigens of campylobacters is widely used in typing rationales; the principles and practice of the technique have been reviewed recently (9). The major serotyping method is that of Penner and Hennessy (14); an adaptation of this basic method has also been described (4).
For a period of 1 year all isolates ofCampylobacter jejuniand
Campylobacter colifrom human clinical specimens received by the Scottish Reference Laboratory were analyzed using both methods to determine whether the modified Penner method offered improved discrimination.
MATERIALS AND METHODS
Campylobactersp. isolates and growth conditions.Isolates ofCampylobacter
spp. from clinical specimens were received at the Reference Laboratory from diagnostic laboratories (n⫽18) throughout Scotland. Isolates were received on charcoal transport swabs and were incubated microaerobically for Penner sero-typing at 42°C for up to 72 h on campylobacter selective agar (2), following which they were subcultured microaerobically at 42°C for up to 72 h on 5% (vol/vol) defibrinated sheep blood agar. Isolates were cultured microaerobically for LEP serotyping at 37°C for up to 72 h on Columbia blood agar with 5% (vol/vol) horse blood. During the period of the study (1 November 1998 to 31 October 1999), 3,788 isolates were received and subsequently analyzed using each serotyping method.
Isolate identification.AllC. jejuniandC. coliisolates were identified to species level by standard microbiological methods including growth at 42°C, hippurate hydrolysis, catalase activity, and resistance to antibiotics (13).
Penner serotyping.Serotyping was performed according to the soluble HS antigenic scheme of Penner and colleagues (15) using a panel of 66 O antisera. Bacterial suspensions were prepared for analysis as described previously (15). Briefly, boiled supernatants of bacterial suspensions were incubated with 1% (vol/vol) sheep erythrocytes at 37°C for 30 min and then washed three times with phosphate-buffered saline, pH 7.4. The antigen-sensitized erythrocyte suspen-sions were screened against a panel of 66 antisera; positive hemagglutination was
considered to be a positive result. All suspensions giving positive results were titrated against doubling dilutions of the antiserum or antisera with which they reacted.
Antisera for the Penner scheme were prepared by the Scottish Antibody Production Unit, Law Hospital, Carluke, United Kingdom, according to the standard immunization protocol (14). Formalin-killed (3% [vol/vol]) bacterial suspensions were used as inocula. In previous pilot studies, no difference in specificity or sensitivity was detectable between antisera prepared from live antigens and those prepared from killed antigens (data not shown).
LEP serotyping.Serotyping was performed using a panel of 62 antisera (30 of 62 were absorbed to prevent cross-reactions) to screen bacterial suspensions prepared according to a previously described method (4). Briefly, boiled bacte-rial suspensions were agglutinated directly with 62 antisera at 50°C for 2.5 h. When agglutination occurred with more than one antiserum, the reacting anti-sera were titrated against the bacterial strain; titers of⬎40 were considered to be positive. All antisera for the LEP serotyping scheme were prepared by the Central Public Health Laboratory, London, United Kingdom.
Each isolate was analyzed by the two methods in turn. Any isolate found to be untypeable by either method was subjected to at least two further repeat analyses in order to maximize typeability. Serotypes were termed concordant when the same serotype was observed for the same isolate under the Penner scheme and the LEP scheme; they were termed divergent when the serotypes observed under the two schemes differed.
RESULTS
A total of 3,788 isolates ofCampylobacterspp. were analyzed in this study:C. jejuni, 3,633 (95.9%) isolates, andC. coli, 155 (4.1%) isolates. All had been isolated from human clinical specimens.
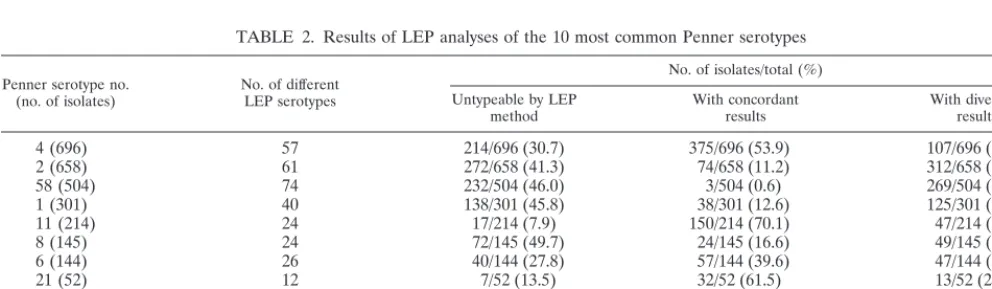
More than one-third (36.6%) of isolates were untypeable using the LEP method. In contrast, only 8.2% of isolates were untypeable by the Penner method, a 4.5-fold difference. A small percentage (3.4%) was untypeable by both methods. The percentages of untypeable isolates for each of the most com-mon Penner and LEP serotypes are given in Tables 2 and 3.
The Scottish Reference Laboratory has previously reported that certain Penner serotypes are predominant among the 66 serotypes possible, routinely comprising a significant propor-tion of all Scottish isolates (17). The distribupropor-tion of common serotypes in terms of predominance and frequency of isolation remains mostly unchanged.
In this study, similar common serotypes were identified (Ta-ble 1). LEP serotyping analyses of the same isolates also iden-tified an unequal distribution, with certain serotypes being more common than others (Table 1). Summation of the per-centages of isolates comprising the 10 most common serotypes for each method with the percentage untypeable by each method left remainders of 16.9% of total isolates and 22.5% of * Corresponding author. Mailing address: Dept. of Medical
Micro-biology, Grampian University Hospitals Trust, Foresterhill, Aberdeen AB25 2ZN, Scotland. Phone: 44-1224-553819. Fax: 44-1224-840632. E-mail: [email protected].
1917
on May 15, 2020 by guest
http://jcm.asm.org/
total isolates for Penner and LEP serotyping, respectively. These less common serotypes each comprised⬍1.0% of total isolates (Penner scheme) or ⬍2.0% of total isolates (LEP scheme).
In some instances, the nomenclature devised for LEP sero-typing results is not directly comparable with that for Penner serotyping on the basis that certain LEP antisera were found to be indistinguishable using direct agglutination and so have been excluded from the scheme (4).
Of LEP serotype results, 36.4% differed from and 27.5% concurred with those obtained by Penner serotyping (Table 2). More than one-third of isolates (average, 36.1%) for which a Penner serotype had been obtained were untypeable by the LEP method (range, 7.9 to 49.7%). If the untypeable isolates are deducted, the average percentage of divergent results, 56.9%, still exceeds that of the concordant results, 43.1%. For the 10 most common Penner serotypes shown here, 331 dif-ferent LEP serotypes were obtained, e.g., where 658 isolates had been typed as Penner 2, 61 different LEP serotypes were obtained and only 11.2% of these concurred with the Penner result. Similar observations were made for the other common serotypes: concordant results range from 0.6 to 70.1%; diver-gent results range from 15.4 to 58.8%.
Comparison of the Penner serotypes obtained for isolates
representing the 10 most common LEP serotypes demon-strated again more divergent results (average, 50.6%; range, 21.0 to 92.6%), than concordant results (average, 42.8%; range 0 to 75.0%) (Table 3). When untypeable isolates had been deducted, these values increased to 54.2 and 45.8%, respec-tively. The percentage of isolates of the 10 most common LEP serotypes untypeable by the Penner method was significantly smaller than that observed for the 10 most common Penner serotypes using the LEP method: average of 6.6% (range, 1.2 to 15.2%) compared with an average of 36.1% (Table 2).
A total of 138 different Penner serotypes were recorded for the 10 most common LEP serotypes, a ratio of 1:13.8 com-pared with 1:33.1 for the LEP analysis of the 10 most common Penner serotypes (Table 2). Because of the demonstrably greater typeability of the Penner method, it was possible to obtain results for more isolates with this method than with the LEP method, 2,817 and 1,548, respectively (Tables 2 and 3).
Calculation of Simpson’s index of diversity, a measure of the discriminatory ability of typing systems (7), using the data from Tables 2 and 3 demonstrated that Penner serotyping has an index of 0.830 whereas LEP serotyping has an index of 0.846. Therefore, there is only a marginal difference in their respec-tive discriminatory abilities.
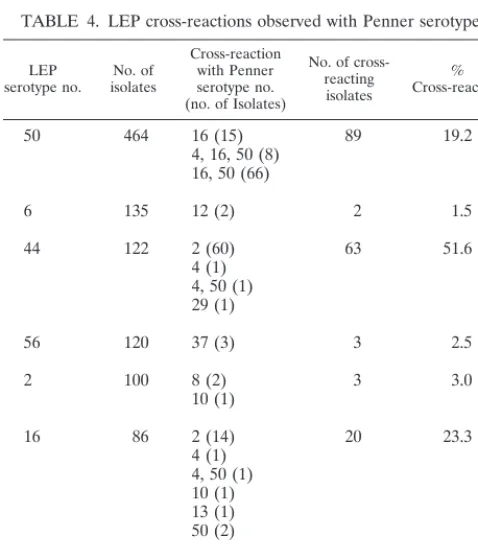
Cross-reactions between LEP and Penner serotypes have been reported previously (4). The number of isolates within the group representing the 10 most common LEP serotypes (n⫽1,548) which showed recognized cross-reactions with Pen-ner serotypes was determined, and the average percentage of cross-reaction was calculated (Table 4). Cross-reactions were observed for isolates representing seven LEP serotypes (n⫽
1,104). Overall, the percentage of cross-reaction observed for these isolates was 16.4%. Other previously undescribed cross-reactions with Penner serotypes were also noted (data not shown).
Within the LEP scheme, cross-reactions also occurred (Ta-ble 5). The most commonly seen cross-reaction was between LEP serotypes 16 and 50, with 52.3% of serotype 16 isolates demonstrating a cross-reaction with antiserum 50. Overall, the average percentage of cross-reaction observed was 14.3% (range, 0.4 to 55.8%).
[image:2.612.52.293.91.252.2]Cross-reactions among Penner serotypes were examined for the isolates representing the 10 most common Penner sero-types (n⫽2,817) (Table 6). Isolates representing nine of the TABLE 1. Ten most common Penner and LEP serotypes recorded
from 1 November 1998 to 31 October 1999
Penner serotyping LEP serotyping Serotype no. isolatesNo. of % of totalisolatesa Serotype no. isolatesNo. of % of totalisolatesa
4-cluster 696 18.4 50 464 12.3
2 658 17.4 11 261 6.9
58 504 13.3 6 135 3.6
1 301 7.9 44 122 3.2
11 214 5.7 56 120 3.2
8 145 3.8 27 104 2.7
6 144 3.8 2 100 2.6
21 52 1.4 16 86 2.3
37 52 1.4 18 79 2.1
23 51 1.8 8 77 2.0
Total 2,817 74.9 Total 1,548 40.9
[image:2.612.55.551.583.727.2]Remainder ⬍40 ⬍1.0 Remainder ⬍77 ⬍2.0 aTotal isolates include untypeable isolates (Penner, 8.2%; LEP, 36.6%).
TABLE 2. Results of LEP analyses of the 10 most common Penner serotypes
Penner serotype no.
(no. of isolates) No. of differentLEP serotypes
No. of isolates/total (%) Untypeable by LEP
method With concordantresults With divergentresults
4 (696) 57 214/696 (30.7) 375/696 (53.9) 107/696 (15.4)
2 (658) 61 272/658 (41.3) 74/658 (11.2) 312/658 (47.3)
58 (504) 74 232/504 (46.0) 3/504 (0.6) 269/504 (53.4)
1 (301) 40 138/301 (45.8) 38/301 (12.6) 125/301 (41.5)
11 (214) 24 17/214 (7.9) 150/214 (70.1) 47/214 (21.9)
8 (145) 24 72/145 (49.7) 24/145 (16.6) 49/145 (33.8)
6 (144) 26 40/144 (27.8) 57/144 (39.6) 47/144 (32.6)
21 (52) 12 7/52 (13.5) 32/52 (61.5) 13/52 (25.0)
37 (52) 13 7/52 (13.5) 20/52 (38.5) 25/52 (48.0)
23 (51) 15 19/51 (37.3) 2/51 (3.9) 30/51 (58.8)
Total 1,018/2,817 (36.1) 775/2,817 (27.5) 1,024/2,817 (36.4)
on May 15, 2020 by guest
http://jcm.asm.org/
most common serotypes (n⫽2,766) demonstrated cross-reac-tions. The average percentage of cross-reaction observed was 9.0%. If the LEP method had typed the same number of isolates as the Penner method, the proportionate average per-centage of cross-reactions observed between the two schemes would be 41.1%. Similarly, within the LEP scheme the propor-tionate average percentage of cross-reaction would be 27.7%. Comparison of the 10 most common LEP and Penner sero-types demonstrated a degree of concordance between the schemes for certain serotypes: 70.1% of Penner serotype 11 isolates were also serotyped as LEP serotype 11 (Table 2). Conversely, 58.6% of LEP serotype 11 isolates were also
Pen-ner serotype 11 (Table 3). Similarly, 75.0% LEP of serotype 2 isolates were typed as Penner serotype 2 (Table 3) although only 11.2% of Penner serotype 2 isolates were also LEP sero-type 2 (Table 2).
DISCUSSION
This study was undertaken to compare the typing abilities of two methods for serotyping Campylobacter spp., Penner and LEP serotyping. For a period of 1 year, all human clinical isolates ofC. jejuniandC. colireceived by the Scottish Refer-ence Laboratory were analyzed by both methods using stan-dard protocols and reagents.
A significant percentage (36.6%) of isolates tested were un-typeable using the LEP method; this observation is comparable with the results of another study, where 29.0%C. jejuniisolates were untypeable by this method (3).
LEP serotyping was originally devised to correct perceived limitations in the Penner serotyping method by using direct bacterial cell agglutination rather than passive hemagglutina-tion as the detechemagglutina-tion step and by using absorbed rather than unabsorbed antisera (4). In this study, no detrimental effects associated with the use of erythrocytes were noted: positive results with Penner serotyping were easier to read. The same type and quality of sheep erythrocyte, provided by the same supplier, was used throughout, and fresh suspensions were made daily. Despite strict adherence to the standard protocol, positive results in the LEP scheme were comparatively difficult to read, true agglutination reactions having to be differentiated from nonspecific reactions.
LEP antisera undergo an absorption process specifically to obviate potential cross-reactions. The results presented here indicate that a significant level of nonspecific reaction is still evident despite these precautions. In particular, the majority of serotype 16 isolates also reacted with antiserum 50, a recog-nized cross-reaction in the Penner scheme that the LEP ab-sorption protocol had been devised to prevent. Generally, the Penner method, using unabsorbed antisera, exhibited a smaller percentage of cross-reactions, facilitating the interpretation of results. Cross-reactions between LEP and Penner serotypes had been reported previously (4). In this study, other cross-reactions were also observed.
[image:3.612.55.552.91.236.2]The Penner method was less labor-intensive and technically TABLE 3. Results of Penner analysis of the 10 most common
LEP serotypes
LEP serotype no.
(no. of isolates) Penner serotypesNo. of different
No. of isolates/total (%) Untypeable by
Penner method With concordantresults With divergentresults
50 (464) 25 16/464 (3.4) 306/464 (65.9) 142/464 (30.6)
11 (261) 13 18/261 (6.9) 153/261 (58.6) 90/261 (34.5)
6 (135) 11 12/135 (8.9) 42/135 (31.1) 81/135 (60.0)
44 (122) 15 5/122 (4.1) 4/122 (3.3) 113/122 (92.6)
56 (120) 17 18/120 (15.0) 0/120 (0) 102/120 (85.0)
27 (104) 17 7/104 (6.7) 17/104 (16.3) 80/104 (76.9)
2 (100) 10 4/100 (4.0) 75/100 (75.0) 21/100 (21.0)
16 (86) 8 1/86 (1.2) 39/86 (45.3) 46/86 (53.5)
18 (79) 14 12/79 (15.2) 6/79 (7.6) 61/79 (77.2)
8 (77) 8 9/77 (11.7) 21/77 (27.3) 47/77 (61.0)
Total 102/1,548 (6.6) 663/1,548 (42.8) 783/1,548 (50.6)
TABLE 4. LEP cross-reactions observed with Penner serotypes
LEP
serotype no. isolatesNo. of
Cross-reaction with Penner serotype no. (no. of Isolates)
No. of cross-reacting isolates
% Cross-reaction
50 464 16 (15) 89 19.2
4, 16, 50 (8) 16, 50 (66)
6 135 12 (2) 2 1.5
44 122 2 (60) 63 51.6
4 (1) 4, 50 (1) 29 (1)
56 120 37 (3) 3 2.5
2 100 8 (2) 3 3.0
10 (1)
16 86 2 (14) 20 23.3
4 (1) 4, 50 (1) 10 (1) 13 (1) 50 (2)
8 77 17 (1) 1 1.3
Total 1,104a 181 16.4
aExcludes isolates which showed no cross-reaction (LEP serotypes 11 [261
isolates], 27 [104 isolates], and 18 [79 isolates]).
on May 15, 2020 by guest
http://jcm.asm.org/
[image:3.612.54.293.430.710.2]easier to perform than the LEP method. The majority of Pen-ner analyses could be completed within 1 working day from obtaining a pure culture. In contrast, completion of LEP anal-yses routinely took several days, as repeated subculture was often required to obtain sufficient bacterial growth for testing. The unit cost of LEP serotyping, including labor and inter-pretative costs, was routinely threefold greater than that of Penner serotyping. Increased cost combined with relatively poor typeability and longer sample turnaround time would preclude general application of LEP serotyping in a laboratory screening many isolates daily.
A comparison of Simpson’s indices of diversity for the two methods shows that the LEP method is marginally more dis-criminatory than Penner serotyping in that it generates a greater number of types. The greater incidence of untypeable isolates with the LEP method, however, severalfold greater than with the Penner method, means that a comparatively smaller group of isolates will be subdivided into smaller groups still, making association of epidemiologically linked isolates more difficult. This situation is analogous to serotyping of
Salmonellaspp. for which more than 2,000 serotypes are rec-ognized, although most are rarely connected with human dis-ease (18).
Because of the reported greater plasticity of the Campy-lobactersp. genome compared with that of other enteric patho-gens (5), significant phenotypic and genotypic variation is ob-served within Campylobacter sp. populations worldwide. Splitting clinical isolates into small groups against a
back-ground of considerable genetic variation will not prove useful epidemiologically.
During 1999, there were 5,954 laboratory reports of Campy-lobacter sp. infections in Scotland. The majority of Scottish isolates (82.3%, from 1 April 1998 to 31 March 1999) were submitted to the Reference Laboratory for typing. A hierar-chical approach applying several typing methods in succession is required in order to type large groups of disparate isolates definitively. The Reference Laboratory rationale had been to use biotyping for identification to the species level, Penner serotyping for identification to the subspecies level, and mo-lecular methods, e.g., pulsed-field gel electrophoresis and re-striction fragment length polymorphisms of the flagellin gene for strain definition. Outbreaks of human disease have been investigated successfully by the Scottish Reference Laboratory using this rationale (6). The advantages of this approach are that large numbers of disparate isolates can be screened and subdivided rapidly and accurately within 1 working day (Pen-ner serotyping) prior to any requisite characterization of indi-vidual isolates (pulsed-field gel electrophoresis and fragment length polymorphisms of the flagellin gene). The LEP method is not readily assimilated into this hierarchy because of its requirement for protracted incubation of cultures and its rel-atively decreased typeability.
Many methods have been proposed for characterization and typing ofCampylobacterspp. (10). Currently, no single ideal method which fulfils the desired criteria for any typing scheme, i.e., discrimination, typeability, reproducibility, and repeatabil-TABLE 5. Cross-reactions observed among LEP serotypes
LEP
serotype no. No. of isolates Cross-reactions with LEP serotype no.(no. of isolates) reacting isolatesNo. of cross- % Cross-reaction
50 464 56 (1), 62 (1) 2 0.4
11 261 3 (1), 18 (4), 21 (1), 27 (1), 50 (2) 9 3.4
6 135 12 (41), 37 (2), 13 (1), 59 (1), 9 (2) 47 34.8
44 122 16 (1), 50 (1), 56 (1) 3 2.5
27 104 29 (1), 30 (1), 56 (3) 5 4.8
2 100 9 (1), 13 (1), 16 (1), 44 (1) 4 4.0
16 86 27 (1), 19 (2), 50 (45) 48 55.8
18 79 37 (4), 27 (3), 9 (1) 8 10.1
8 77 11 (2), 15 (1), 27 (2), 37(1), 44 (2), 50 (2) 10 12.9
Total 1,428a 136 9.5
[image:4.612.53.552.83.202.2]aIncludes 120 isolates of LEP serotype 56 which showed no cross-reaction.
TABLE 6. Cross-reactions observed among Penner serotypes
Penner serotype
no. isolatesNo. of Cross-reactions, with Penner serotype no. (no. isolates) No. of cross-reactingisolates % Cross-reaction
4-clustera 696 1 (3), 11 (2), 21 (2), 37 (1), 43 (1), 58 (2), 3 (6) 17 2.4 (excluding 4-cluster)
2 658 21 (1), 55 (1) 2 0.3
58 504 3 (1), 8 (1), 13 (1), 16 (1), 18 (2), 21 (1), 44 (1) 8 1.6
1b 301 7 (2), 9 (71), 16 (1), 17 (30), 31 (2), 37 (1), 35 (1), 50 (2) 110 36.5 (excluding 44)
11 214 6 (1), 9 (1), 16 (1), 21 (3), 44 (1), 50 (1) 8 3.7
8 145 21 (1), 58 (3) 4 2.8
6 144 5 (85), 11 (1), 20 (1), 31 (1) 88 61.1
21 52 2 (1), 8 (1), 11 (4), 16 (1), 39 (1), 50 (1), 58 (1) 10 19.2
37 52 1 (1), 16 (1) 2 3.8
Total 2,766 249 9.0
aPenner 4-cluster: serotypes 4, 13, 16, and 50; cross-reaction within the cluster frequently observed. bPenner 1: recognized cross-reaction with Penner serotype 44.
on May 15, 2020 by guest
http://jcm.asm.org/
[image:4.612.53.553.589.710.2]ity (1), has been identified. Accordingly, laboratories world-wide have developed ad hoc typing rationales based on phe-notypic and gephe-notypic techniques. Penner serotyping is the most widely usedCampylobactersp. typing method because it best fulfils the established criteria. Further, in combination with selected genotypic methods the definitive characterization required to identify clusters of related isolates may be achieved (6).
Certain Penner HS serotypes predominate in Scotland (17), the 10 most common comprising 73.2% of all isolates.C. jejuni
subtypes, defined by Penner HS serotype and genotypic meth-ods, which persist for several years in diverse locations throughout Scotland have been identified (6). The 10 most common serotypes identified in the LEP scheme represented 40.9% of all isolates in this study compared with 57.0% previ-ously reported (3). In the two studies, LEP HS 50 was the most common: 12.3 and 17.8%, respectively. In the latter study, the combination of LEP serotyping with bacteriophage typing enabled identification of eight specific subtypes detected throughout a 2-year period.
Prior to this study, no systematic comparison had been made between the Penner and the LEP serotyping schemes. Oza et al. (A. N. Oza, R. T. Thwaites, D. R. A. Wareing, F. J. Bolton, and J. A. Frost, Abstr. 10th International Workshop on
Campylobacter, Helicobacter and Related Organisms, abstr. CE15, 1999) analyzed 450 randomly selected clinical isolates using LEP and Penner serotyping. A high degree of concor-dance between the two methods was seen with serotypes 6, 19, and 11. In the present study, broadly similar observations were made for serotype 11 only. LEP serotype 19 was not detected as one of the most common LEP serotypes, and the results for serotype 6 concurred for neither scheme. Other serotypes did share some commonality: the majority of LEP serotype 2 iso-lates were also typed as Penner serotype 2. Overall, more divergent results than concurrent results were evident.
Campylobacter sp. serotyping methods were previously thought to be based on detection of variation in the lipopoly-saccharide or lipooligolipopoly-saccharide structures of the bacterial surface (9, 14). After this study was completed, it was demon-strated that the previously described O antigen ofC. jejuniis a capsular polysaccharide, a common component of the HS an-tigen used for serotyping (8).
Currently, LEP serotyping offers no significant advantages over Penner serotyping for routine screening of diverse clinical isolates. LEP serotyping, however, does have several distinct disadvantages compared with Penner serotyping, principally in regard to typeability, applicability, and cost.
ACKNOWLEDGMENTS
The expertise of the staff of the Scottish Reference Laboratory for
Campylobacterspp. is gratefully acknowledged. The assistance of Sarah
Lang and Susie Nicholls in preparation of the study data is also grate-fully acknowledged. Statistical advice was provided by Alan Clark, Department of Public Health, University of Aberdeen. The study would not have been possible without the cooperation of colleagues in submission of isolates for testing.
The Scottish Reference Laboratory for Campylobacter spp. was funded by the National Services Division, Common Services Agency, Scottish Executive Department of Health.
REFERENCES
1.Bolton, F. J., A. J. Fox, J. Gibson, R. H. Madden, J. E. Moore, L. Moran, P. Murphy, R. J. Owen, T. H. Pennington, T. Stanley, F. M. Thomson-Carter, D. R. A. Wareing, and T. Wilson.1996. A multi-centre study of methods for sub-typingCampylobacter jejuni, p. 187–189.InD. G. Newell, J. M. Ketley, and R. A. Feldman (ed.), Campylobacters, helicobacters and related organ-isms. Plenum Press, New York, N.Y.
2.Bolton, F. J., and L. A. Robertson.1982. A selective medium for isolating
Campylobacter jejuni/coli. J. Clin. Pathol.35:462–467.
3.Frost, J. A.1999. The Public Health Service (PHLS):Campylobacter refer-ence typing. ACM/434, Department of Health, London, United Kingdom. 4.Frost, J. A., A. N. Oza, R. T. Thwaites, and B. Rowe.1998. Serotyping scheme
forCampylobacter jejuniandCampylobacter colibased on direct agglutina-tion of heat-stable antigens. J. Clin. Microbiol.36:335–339.
5.Harrington, C. S., F. M. Thomson-Carter, and P. E. Carter.1997. Evidence for recombination in the flagellin locus ofCampylobacter jejuni: implications for the flagellin typing scheme. J. Clin. Microbiol.35:2386–2392. 6.Harrington, C. S., F. M. Thomson-Carter, and P. E. Carter.1999. Molecular
epidemiological investigation of an outbreak ofCampylobacter jejuni identi-fies a dominant clonal line within Scottish serotype HS55 populations. Epi-demiol. Infect.122:367–375.
7.Hunter, P. R., and M. A. Gaston.1988. Numerical index of the discrimina-tory ability of typing systems: an application of Simpson’s index of diversity. J. Clin. Microbiol.26:2465–2466.
8.Karlyshev, A. V., D. Linton, N. A. Gregson, A. J. Lastovica, and B. W. Wren.
2000. Genetic and biochemical evidence of aCampylobacter jejunicapsular polysaccharide that accounts for Penner serotype specificity. Mol. Microbiol.
35:529–541.
9.Moran, A. P., and J. L. Penner.1999. Serotyping ofCampylobacter jejuni
based on heat-stable antigens: relevance, molecular basis and implications in pathogenesis. J. Appl. Microbiol.86:361–377.
10. Nachamkin, I., H. Ung, and C. M. Patton.1996. Analysis of HL and O serotypes ofCampylobacterstrains by the flagellin gene typing system. J. Clin. Microbiol.34:277–281.
11. On, S. L. W.1996. Identification methods for campylobacters, helicobacters, and related organisms. Clin. Microbiol. Rev.9:405–422.
12. On, S. L. W., H. Ibrahim Atabay, and J. E. L. Corry.1999. Clonality of
Campylobacter sputorumbv. paraureolyticus determined by macrorestriction profiling and biotyping, and evidence for long-term persistent infection in cattle. Epidemiol. Infect.122:175–182.
13. Penner, J. L.1988. The genusCampylobacter: a decade of progress. Clin. Microbiol. Rev.1:157–172.
14. Penner, J. L., and J. N. Hennessy.1980. Passive hemagglutination technique for serotypingCampylobacter fetussubsp.jejunion the basis of soluble heat-stable antigens. J. Clin. Microbiol.12:732–737.
15. Penner, J. L., J. N. Hennessy, and R. V. Congi.1983. Serotyping of Campy-lobacter jejuniandCampylobacter colion the basis of thermostable antigens. Eur. J. Clin. Microbiol.2:378–383.
16. Steele, M., B. McNab, L. Fruhner, S. DeGrandis, D. Woodward, and J. A. Odumeru.1998. Epidemiological typing ofCampylobacterisolates from meat processing plants by pulsed-field gel electrophoresis, fatty acid profile typing, serotyping, and biotyping. Appl. Environ. Microbiol.64:2346–2349. 17. Thomson-Carter, F. M.1999. Annual report. Scottish Reference Laboratory
forCampylobacterandEscherichia coliO157, Aberdeen, Scotland. 18. Wheeler, J. G., D. Sethi, J. M. Cowden, P. G. Wall, L. C. Rodrigues, D. S.
Tompkins, M. J. Hudson, and P. J. Roderick.1999. Study of infectious intestinal disease in England: rates in the community, presenting to general practice, and reported to national surveillance. BMJ318:1046–1050.