International Journal of Emerging Technology and Advanced Engineering
Website: www.ijetae.com (ISSN 2250-2459, ISO 9001:2008 Certified Journal, Volume 7, Issue 11, November 2017)
174
Structural and Optical studies of CdI
2
–Ag
2
SO
4
–TeO
2
–B
2
O
3
Glass system
Puli Nageswar Rao
1, E. Ramesh Kumar
2, K. Krishna Murthy Goud
3, B. Appa Rao
41,2,3,4 Department of Physics, Osmania University, Hyderabad-500 007, India
Abstract— This paper deals with the preparation and
characterization of xCdI–(100-x)[ 0.444 Ag2SO4–0.555
(0.4TeO2–0.6B2O3) glass system, here x is the wt% of AgI
varying from 0 to 25 with step 5 and these system were preared by melt quenching method, characterized by XRD, FTIR, optical absorption. Physical parameters like density, average molecular weight, molar volume, refractive index, polarizability, oxygen mol %, Cd and Ag ions concentration and field strength were calculated. From the optical absorption studies direct band gap Eg was calculated by
correlating Tauc’s plots and ASF method. Urbach energy (Eu)
was also calculated using optical absorption data. Free energy of the system and second-order deformation potential has been determined by using relation between Eu and Eg.
Varaition of these parameters by varying the CdI2
composition is discussed in detail.
Keywords— optical absorption, FTIR, Optical band gap,
Urback energy
I. INTRODUCTION
In recent years silver doped borotellurate glasses have attracted abundant attention because of their valuable optical and high value of ionic properties. These ion conducting materials are of technological interest in view of their applications including fuel cells, storage batteries and biosensors etc. [1]. Recent studies have shown that the glassy nature of the materials exhibit valuable optical properties and higher ionic conductivity than their respective crystalline counterparts. The electrical and optical properties depend on the nature and content of the glass former, modifier oxide and also dopant salt compositions [1-3]. Pure borate and tellurite glasses are made up of random network of boroxyl units with boron in three-fold co-ordination (BO3) and random network of telluride units with tellurium in two-fold co-ordination (TeO2).
The addition of dopant salt and modifier leads formation of BO4, TeO3, TeO4 groups and creation of non-bridging oxygen. Increase of non-bridging oxygen helps to open the network structure and the increase of conductivity and urbach energy values [3-7]. Intensive investigations on the structure, optical properties of silver based conducting glasses with TeO2 and B2O3 as glass-forming agents and Ag2SO4 as modifier have been started quite recently [3, 7, 8].
In this present study we have chosen xCdI2–(100-x)[ m Ag2SO4–f (0.4TeO2–0.6B2O3) for optical characterization. Here m and f are the weight percentage of modifier and glass formers respectively and its ratio was maintained constant (m= 0.444, f = 0.555 and m/f =0.8). Here x is the weight percentage of CdI2 changing from 0 to 25 with step 5 and Ag2SO4 is modifier and B2O3 and TeO2 are glass formers. The objective of this work is to throw some light onto the optical characterization of silver based boro tellurite glasses with increasing CdI2 doing concentration.
II. EXPERIMENTAL
International Journal of Emerging Technology and Advanced Engineering
Website: www.ijetae.com (ISSN 2250-2459, ISO 9001:2008 Certified Journal, Volume 7, Issue 11, November 2017)
175
TABLE 1
COMPOSITION OF PREPARED SAMPLES
Sample code
X Composition:
x CdI2–(100-x)[0.444Ag2SO4–
0.555(0.4TeO2–0.6B2O3)]
CBT 0 0 [0.444Ag2SO4–0.555(0.4TeO2–0.6B2O3)]
CBT 05 05 05CdI2–90[0.444 Ag2SO4–0.555(0.4TeO2–
0.6B2O3)]
CBT 10 10 10 CdI2–80[0.444 Ag2SO4–0.555(0.4TeO2–
0.6B2O3)]
CBT 15 15 15 CdI2–70[0.444 Ag2SO4–0.555(0.4TeO2–
0.6B2O3)]
CBT 20 20 20 CdI2–60[0.444 Ag2SO4–0.555(0.4TeO2–
0.6B2O3)]
CBT 25 25 25 CdI2–50[0.444 Ag2SO4–0.555(0.4TeO2–
0.6B2O3)]
The surface of the samples was polished with sand paper and velvet cloth to obtain thin and smooth surface. The nature of all CBT samples were characterized by PAN analytical Philips X’pert pro Diffractometer with Cu-Kα radiation, λ=1.5405 Å for 2θ values between 10 and 80 degree at 2° per minute scan rate.
The Fourier Transform Infrared (FTIR) spectra were recorded for CBT samples mixing with KBr using BRUKER TENSOR 27 spectrometer in the wavenumber range 250 cm-1 to 1500 cm-1. For the optical absorption measurements a recording spectrometer of kind Labindia analytical UV 3092 UV-VIS spectrometer was used. The optical absorption spectra were taken from the transmittance spectra of the CBT samples which were measured using the sample-in sample-out method [11].
The density of all CBT samples at room temperature was measured by the standard principle of Archimedes using a sensitive digital balance with O-xylene as a buoyant. The density of CBT samples was calculated by the well-known formula.
(1)
where Wa , Wxare the weight of the sample in air and the weight of the sample in O-xylene and ρ
׳
is the density of O-xylene at room temperature. All the measurements were made using a digital balance (Essae vibra HT digital balance) and to get an accurate value of density the experiment was repeated 3 or 4 times.TABLE 2
PHYSICAL PARAMETERS OF ALL ABT SAMPLES
Glass
Physical Parameter CBT 05 CBT 10 CBT 15 CBT 20 CBT 25
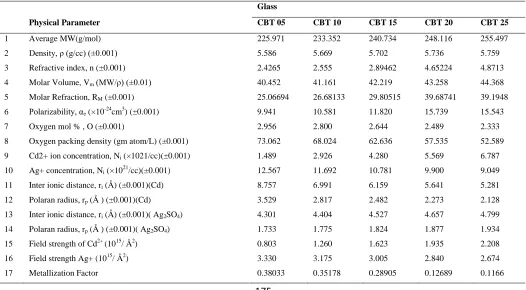
1 Average MW(g/mol) 225.971 233.352 240.734 248.116 255.497
2 Density, ρ (g/cc) (±0.001) 5.586 5.669 5.702 5.736 5.759
3 Refractive index, n (±0.001) 2.4265 2.555 2.89462 4.65224 4.8713
4 Molar Volume, Vm (MW/ρ) (±0.01) 40.452 41.161 42.219 43.258 44.368
5 Molar Refraction, RM (±0.001) 25.06694 26.68133 29.80515 39.68741 39.1948
6 Polarizability, αe (×10-24cm3) (±0.001) 9.941 10.581 11.820 15.739 15.543
7 Oxygen mol % , O (±0.001) 2.956 2.800 2.644 2.489 2.333
8 Oxygen packing density (gm atom/L) (±0.001) 73.062 68.024 62.636 57.535 52.589
9 Cd2+ ion concentration, Ni (×1021/cc)(±0.001) 1.489 2.926 4.280 5.569 6.787
10 Ag+ concentration, Ni (×1021/cc)(±0.001) 12.567 11.692 10.781 9.900 9.049
11 Inter ionic distance, ri (Å) (±0.001)(Cd) 8.757 6.991 6.159 5.641 5.281
12 Polaran radius, rp (Å ) (±0.001)(Cd) 3.529 2.817 2.482 2.273 2.128
13 Inter ionic distance, ri (Å) (±0.001)( Ag2SO4) 4.301 4.404 4.527 4.657 4.799
14 Polaran radius, rp (Å ) (±0.001)( Ag2SO4) 1.733 1.775 1.824 1.877 1.934
15 Field strength of Cd2+ (1015/ Å2) 0.803 1.260 1.623 1.935 2.208
16 Field strength Ag+ (1015/ Å2) 3.330 3.175 3.005 2.840 2.674
[image:2.612.44.570.436.726.2]International Journal of Emerging Technology and Advanced Engineering
Website: www.ijetae.com (ISSN 2250-2459, ISO 9001:2008 Certified Journal, Volume 7, Issue 11, November 2017)
176
The accuracy in the density measurements is ±0.0005 g.cm–3 and the percentage of error in the measurements of density was ±0.001 g.cm–3.
The molar volume values were calculated by using the
average molecular weight (
M
) and density (ρ) of the sample, with the help of the well-known given equation:Vm(cc/mole) =
M
(2)M
denotes the average molecular weight of the glassand
M
=ΣniAi. Here Ai and ni are the molecular weight and molar concentrations of the ith component, respectively and ρ is measured density.III. RESULTS AND DISCUSSION
A. X-ray diffraction (XRD) spectra
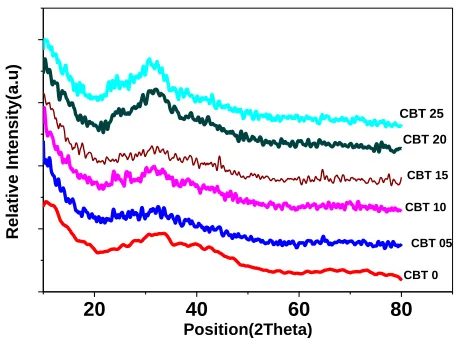
The room temperature XRD patterns of all compositions of CBT samples (From x= 0 to 25) are shown in Figure 1, between relative intensity and 2Ө (100 to 800). Absence of sharp peaks indicates the amorphous (glass) nature of the prepared samples From x= 0 to 25.
20 40 60 80
R
elative I
nte
nsity(
a.u)
Position(2Theta)
CBT 25 CBT 20
CBT 15 CBT 10
[image:3.612.56.284.420.589.2]CBT 05 CBT 0
Fig. 1. XRD patterns of CBT samples at different comositions.
B. Fourier Transforms Infrared (FTIR) spectra
IR vibrations of TeO4 trigonal bipyramids (tbp) in pure TeO2-glass contains four bands at νseq = 780 cm−1, νaseq= 714 cm−1, νasax = 675 cm
−1
and νsax = 635 cm −1
. The vibrations of TeO3 trigonal pyramids (tp) are ν s TeO3 = 680 cm−1 and νd TeO3 = 640 cm−1 for AgTeO3 [12].
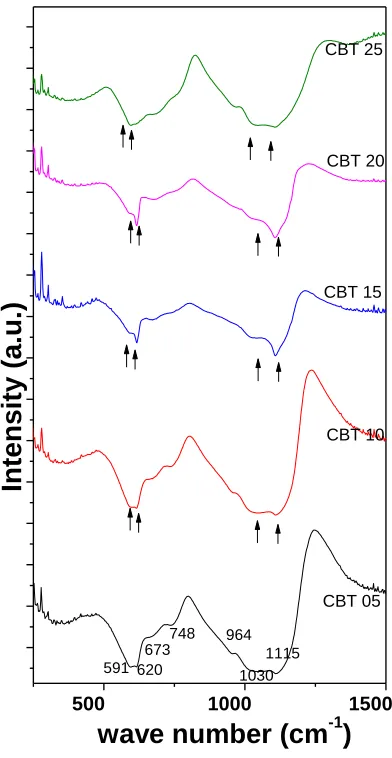
In Fig. 2, FTIR spectra of all CBT samples shown, in this spectra two fundamental modes of vibration TeO4 trigonal bipyramids (tbp) bands νasax, νaseq, and two fundamental modes of vibration TeO3 trigonal pyramids (tp) νd TeO3 for AgTeO3 and ν
s
TeO3 are shown at 672 cm
-1, 718 cm-1, 739 cm-1 and 654 cm-1respectively. Thus, the
vibrational modes of the vitreous borate network are commonly active in three infrared spectral regions. The IR spectra located in the first region that ranges in between 1200 cm-1 and 1600 cm-1 are due to the asymmetric stretching relaxation of B–O bonds from the trigonal [BO3] units. The second region ranges in between 800 cm-1 and 1200 cm-1 and its spectral features are due to the B–O bond stretching of tetrahedral BO4 units. In the third region ranging between 400 cm-1 and 800 cm-1 there is an important band located around 720 cm-1 assigned to the bending vibrations of various borate segments [12-16]. The IR absorption bands of sulphate (SO4
2-) groups are ν3 asymmetric stretch near 1100 cm-1 and ν4 band near 610 cm-1, S=O stretching bands in the region 1060 cm-1 to 1000 cm-1 and IR absorption bands of sulphate (SO32-) groups are ν2 vibration band at ∼617 cm-1 shown in fig.2 [12,17,18]. The IR spectra located in the first region that ranges in between 100 cm-1 and 750 cm-1 are due to the M-X (Metal – Halide) stretching band [19].The band near 600 cm−1 may be assigned to the stretching vibration of distorted TeO4 groups, as well as may be due to ν4 band of SO2
−4
groups [12]. The broad band near 1000 cm−1 shows the presence of sulphate groups in the CBT glasses. The presence of ν1 vibration and the broad and asymmetric peak at 1070 cm−1 indicate that the decrease of units local symmetry. It is also possible that SO3
2-
units, whose vibrations are in the same frequency range, are present [12, 17, 18]. The bands located in the range of 590 to 650 cm-1 and 640–780 cm-1 are the stretching mode [TeO4] tbp with bridging oxygen and the stretching mode of [TeO3] tp with non-bridging oxygen, respectively [13, 19-21]. Intensity of IR bands near 620 and 1115 cm-1 increases with increasing CdI2 composition as well as Intensity of IR bands near 600 cm-1 and 1000 cm-1 decrease with increasing CdI and it can be connected with additional formation of SO32- and TeO3 units [10]
IV. PHYSICAL PARAMETERS
International Journal of Emerging Technology and Advanced Engineering
Website: www.ijetae.com (ISSN 2250-2459, ISO 9001:2008 Certified Journal, Volume 7, Issue 11, November 2017)
177
Average molecular weight, density, molar volume, refractive index, molar refraction, polarizability, Cd2+ concentration, field strength of Cd ions, Inter ionic distance between Ag ions, Polaran radius Ag ions have been found to increase with increasing CdI2 composition. Oxygen mol %, Oxygen packing density, Inter ionic distance between Cd ions, Ag+ concentration,Field strength of Cd ions and Polaran radius Cd ions found and Metallization factor to decrease with increase in CdI2 composition.
500 1000 1500
1115 1030 964 748 673 620
In
te
ns
ity
(a
.u
.)
wave number (cm
-1)
CBT 05 CBT 10 CBT 15 CBT 20 CBT 25
[image:4.612.71.267.254.633.2]591
Fig. 2. FTIR spectra of all ABT samples
V. OPTICAL PROPERTIES
Analysis of optical absorption spectra is one of the most useful tools to find out the electronic structure of glassy materials [23].
The optical absorption coefficient (α), below and near the edge of each curve has been determined at different wavelengths using well-known equation (3)
(3)
where t is thickness of each sample, I0 and IT are intensities of the incident and transmitted beams, respectively. The relation between the optical band gap and optical absorption coefficient is expressed by the following well-known connection from which optical band gap of the materials was calculated [24, 25]
(4)
where Eg is optical band gap, B is (band tailing parameter) a constant and n indicates the type of optical transition, n=1/2 represents allowed direct, 2 represents allowed indirect, 1/3 represents forbidden direct and 3 represents forbidden indirect transitions and υ is the energy of incident photons. In direct allowed transitions the photons assist the electrons to move from valence band to conduction band in k-space. In the transition process, the total momentum and energy of the electron and photon system must be conserved [24, 26, 27]. But, indirect transitions involve the emission or absorption of a phonon to conserve momentum and the top of the valence band and the bottom of the conduction band take place at different wave vectors in the Brillion zone [24, 26, 27]. The optical band gap in oxide glasses is resolute from the position of the absorption edge. The absorption edge provides information about the width of the localized states, in the band gap which arises due to disorder in the glass matrix [24]. The optical band gap also provides information about the nature of glass structure and chemical bonds [24].
Tauc plots for direct allowed transitions ((αhυ)1/2 verses hυ), indirect allowed transitions ((αhυ)2
International Journal of Emerging Technology and Advanced Engineering
Website: www.ijetae.com (ISSN 2250-2459, ISO 9001:2008 Certified Journal, Volume 7, Issue 11, November 2017)
178
Accordingly equation (3) can be modified equation (5) as a function of wavelength as
( ) (5)
where is Plank’s constant, c is speed of the light and 𝜆𝑔
wavelength corresponding to the optical gap. Integrating Beer-Lambert’s law into the above equation (5), the absorbance (𝜆) can be expressed as
𝜆 𝜆 𝜆 𝜆𝑔 (6)
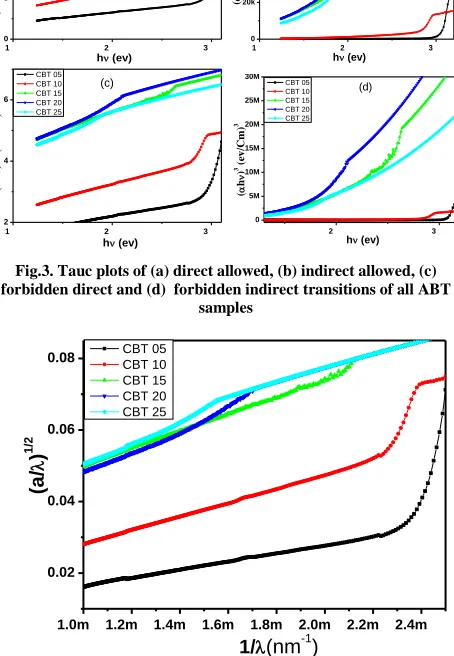
where D1= const ( )n-1d/2.303 and D2 is a constant and it takes into account the reflection of incident light lost. Assuming that the amount of fraction reflected or dispersed light is small. Using equation (5) optical band gap can be calculated from the absorbance spectrum fitting (ASF) method without the need of thickness (t) of the CBT glass samples. The value of optical band gap (Egasf) can be obtained by extrapolating the linear region of Figure 4 (A/𝜆)1/n versus (1/𝜆) curve at (A/𝜆)1/n = 0. The finest fit is observed for n = 2 and the value of band gap (Egasf), is calculated from the parameter 𝜆𝑔using the expression
(6)
The calculated Egasf from ASF method are listed in table 3 and these values are similar to the band gap (Egopt) obtained from tauc plots of (αhυ)1/2 versus (hυ). From the ASF method and Tauc’s plots in transmittance and absorption spectra, we can conclude that the transitions are direct and band gap is direct band gap for all CBT samples. In amorphous materials like glasses, the absorption coefficient α at the absorption edge is exponentially depends on the incident photon energy and obeys the Urbach law given below equation (7) [24, 26, 27].
(7)
where u is the Urbach energy and is interpreted as the width of the tail of the localized energy states in the optical band gap. The above relation can be expressed following equation (8)
ln (υ)= ( 𝜔/ u) − const. (8)
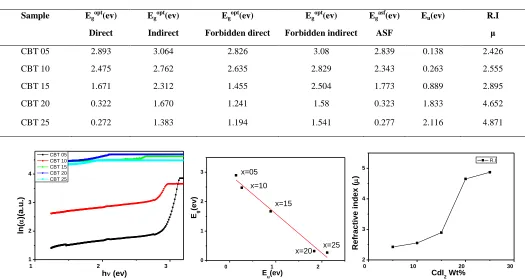
Figure 5 (a) shows the plots of logarithm of absorption coefficients (ln( )) versus photon energy ( υ) are called Urbach plots. The energy gap between localized tail states in the forbidden band gap is known as the Urbach energy (Eu). It provides a measure of disorder in the crystalline and glassy solids.
[image:5.612.324.562.295.476.2]The values of Eu were obtained from the reciprocal of slopes of linear regions of Urbach plots and are given in Table 3.
In CBT glass materials, structural disorder dominates and this could be due to the presence of structural defects like dangling bonds or non-bridging oxygen (NBO) atoms [24]. In present base glass network, increase in the Urbach energy value, and increases the concentration of NBO's. From the values of Eu it was observed that, there is an increase in the value of Urbach energy with increase in CdI2 content. This is due to increase of NBO’s with increase in the CdI2 and these results were supported by FTIR studies shown in figure 2.
1 2 3
0 5 10 15 ( h ) 1 /2 (e v /Cm) 1 /2
h (ev)
CBT 05 CBT 10 CBT 15 CBT 20 CBT 25 (a)
1 2 3
0 20k 40k 60k 80k ( h ) 2( (e v/Cm) 2)
h (ev)
CBT 05 CBT 10 CBT 15 CBT 20 CBT 25 (b)
1 2 3
2 4 6 ( h ) 1/ 3(e v/Cm) 1/ 3
h (ev)
CBT 05 CBT 10 CBT 15 CBT 20 CBT 25 (c) 2 3 0 5M 10M 15M 20M 25M 30M ( h ) 3(e v/Cm) 3
h (ev)
CBT 05 CBT 10 CBT 15 CBT 20 CBT 25 (d)
Fig.3. Tauc plots of (a) direct allowed, (b) indirect allowed, (c) forbidden direct and (d) forbidden indirect transitions of all ABT
samples
1.0m 1.2m 1.4m 1.6m 1.8m 2.0m 2.2m 2.4m
0.02 0.04 0.06 0.08 (a/ ) 1 /2
1/(nm-1)
[image:5.612.331.558.351.679.2]CBT 05 CBT 10 CBT 15 CBT 20 CBT 25
[image:5.612.342.553.514.683.2]International Journal of Emerging Technology and Advanced Engineering
Website: www.ijetae.com (ISSN 2250-2459, ISO 9001:2008 Certified Journal, Volume 7, Issue 11, November 2017)
179
The relation between Eg and Eu shown in Figure 5 (b), Eg values decrease with increasing Eu. There is a numerical relationship between Eg and Eu, which can be stated in following well-known equation [26, 27]
(9)
[image:6.612.44.569.241.521.2] [image:6.612.42.572.248.517.2]Where Ef is free energy of the glass system and it is a constant for this glass system that depends on local coordination. The value of Ef for the present glass system is 2.922 ev. The value of G is constant, the present glass system G is 1.331 and proportional to the second-order deformation potential.
Table 3
optical parameters of all ABT samples
Sample Egopt(ev) Egopt(ev) Egopt(ev) Egopt(ev) Egasf(ev) Eu(ev) R.I
Direct Indirect Forbidden direct Forbidden indirect ASF μ
CBT 05 2.893 3.064 2.826 3.08 2.839 0.138 2.426
CBT 10 2.475 2.762 2.635 2.829 2.343 0.263 2.555
CBT 15 1.671 2.312 1.455 2.504 1.773 0.889 2.895
CBT 20 0.322 1.670 1.241 1.58 0.323 1.833 4.652
CBT 25 0.272 1.383 1.194 1.541 0.277 2.116 4.871
1 2 3
1 2 3 4
ln
(
)(a
.u.)
h (ev)
CBT 05 CBT 10 CBT 15 CBT 20 CBT 25
0 1 2
0 1 2 3
Eg
(e
v
)
E
u(ev)
x=20 x=25
x=15 x=10 x=05
0 10 20 30
2 3 4 5
Re
fra
c
tiv
e
i
nde
x
(
)
CdI2 Wt%
R.I
Fig.5. (a)The Urbach plotsof all ABT samples. (b) The variations of Eg with Eu. (c) The variations of refractive index with composition.
G and Ef values of present glass system were obtained from the slope and intercept of lines in Figure 5 (b).
Refractive index (μ) of the CBT glass system were determined from optical band gap energy, using the formula proposed by Dimitrov and Sakka [24, 30 ]:
√ (10)
The refractive index values of the present glass samples increases with CdI2 composition shown in Fig. 5(c), the values are listed in Table 3 and the range of values from 2.426 to 4.871. However there are chances of creeping small error in the refractive index values owing to extrapolation (αhυ)1/2 versus (hυ) plots in estimating optical band gap.
VI. CONCLUSIONS
International Journal of Emerging Technology and Advanced Engineering
Website: www.ijetae.com (ISSN 2250-2459, ISO 9001:2008 Certified Journal, Volume 7, Issue 11, November 2017)
180
FTIR and Urbach energy results conclude that concentration of NBO’s increases with increasing CdI2 content. High value of Polarizability αe (>3) confirms the ionic nature of CBT glass samples.
REFERENCES
[1] E. Ramesh Kumar, P. Nageswar Rao, K. Rajani Kumari, B. Appa Rao, 2017, ‖ Effect of Former on Transport Properties, Current-Voltage Characteristics and Battery Performance Studies of Silver Based Fast Ion Conducting Glasses‖ IJETAE Volume 7, Issue 10, 94-98, October 2017.
[2] Magistris A (1993) In: Scrosati B, Magistris A, Mari CM, and Mariatto G, 1993, ‖Electrical conductivity studies of AgI–Ag2O– B2O3–TeO2 glasses‖ Proceedings of the Nato advanced research workshop on fast ion transport in solids. Kluwer Academic Publishers, Netherlands, p 213.
[3] Vandana Sharma, Supreet Pal Singh, Gurmel Singh Mudahar, Kulwant Singh Thind, 2012, ―Synthesis and Optical Characterization of Silver Doped Sodium Borate Glasses‖ New Journal of Glass and Ceramics,, 2, 133-137.
[4] M. Sharma, K. S. Thind, G. Sharma, V. Rajendran, K. Singh, A. V. Gayathri-Devi and S. Aravindan, 2006, ―Structural and Acoustic Investigations of Calcium Borate Glasses,‖ Physica Status Solidi (A), Vol. 203, No. 10, pp. 2356-2364. doi:10.1002/pssa.200622140 [5] M. Pal, B. Roy and M. Pal, 2006, ―Structural Characterization of
Borate Glasses Containing Zinc and Manganese Oxi- des,‖
International Journal of Modern Physics, Vol. 2, p. 1062. doi:10.4236/jmp.2011.29129
[6] Poonam Sharma, Dinesh Kumar Kanchan, Meenakshi Pant, Karan Pal Singh, 2010, ―Conductivity Studies in Proton Irradiated AgI-Ag2O-V2O5-TeO2 Super-Ionic Glass System‖ Materials Sciences and Applications, 1, 59-65 doi:10.4236/msa.2010.12011.
[7] E. Ramesh Kumar, K. Rajani Kumari, B. Appa Rao and G. Bhikshamaiah, 2014, ―Optical and Electrical Studies of Silver Boro Tellurite Glasses‖ International Journal of Scientific & Engineering Research, Volume 5, Issue 3, March-2014 ISSN 2229-5518 [8] L.R.P. Kassab, K. Ozga, D.M. da Silva, R. Miedziński, A. Ślęzak,
2010, ―Influence of gold nanoparticles on optically stimulated effects in TeO2–ZnO and GeO2–PbO amorphous thin films‖ Optics Communications 283 (2010) 3691–3694.
[9] Levasseur, M. Kbala, J. C. Brethous, J. M. Reau, P. Hangenmuller, and M. Couzi, 1979, ‖Investigation of AgI-Ag2SO4-TeO2 glasses and glass ceramics‖ Solid State Commun. 32 (1979) 839.
[10] Levasseur, J. C. Brethous, J. M. Reau, P. Hangenmuller,vand M. Couzi, 1980, ‖Synthesis and characterization of new solid electrolyte conductors of lithium ions‖ Solid State Ionics 1 (1980) 177.
[11] J. Ruiz-Fuertes, D. Errandonea, F. J. Manjón, D. Martínez-García, A. Segura, V.V. Ursaki, and I. M. Tiginyanu,2008 ―High-pressure effects on the optical-absorption edge of CdIn2S4CdIn2S4,
MgIn2S4MgIn2S4, MgIn2S4MnIn2S4 thiospinels‖ J. Appl. Phys. 103,
063710 (2008).
[12] E. Lefterova1, P. Angelov1, V. Ilcheva1, T. Petkova1, Y. Dimitriev 2004, Investigation of AgI-Ag2SO4-TeO2 glasses and glass ceramics,
Nanoscience & Nanotechnology, 4 eds. E. Balabanova, I. Dragieva, Heron Press, Sofia,
[13] S. Rada, M. Culea, E. Culea, 2008, ―Structure of TeO2 B2O3 glasses inferred from infrared spectroscopy and DFT calculations‖, Journal of Non-Crystalline Solids 354 (2008) 5491–5495.
[14] W.L. Konijnendijk, J.M. Stevels,1975, The structure of borate glasses studied by Raman scattering, J. Non-Cryst. Solids 18 (1975) 30.
[15] A. Bhargava, R.L. Snyder, R.A. Condrate, 1987, ―The Raman and infrared spectra of the glasses in the system BaO-TiO2-B2O3‖ Mater.
Res. Bull. 22 (1987) 1603.
[16] P. Pascuta, L. Pop, S. Rada, M. Bosca, E. Culea, 2008 ―The local structure of bismuth borate glasses doped with europium ions evidenced by FT-IR spectroscopy‖ J. Mater. Sci.: Mater. Electron. 19 (5) (2008) 424.
[17] G. Meunier, R. Dormoy and A. Levasseur, 1989 ―New positive-electrode materials for lithium thin film secondary batteries‖ Mater. Sci. Eng. B 3 (1989) p.19.
[18] M. Natarajan, C. N. R. Rao, 1970 ―Phase transitions in silver halides: silver iodide and its solid solutions with silver bromide‖ J. Chem. Soc. A (1970) 3087
[19] V. Kozhukharov, S. Nikolav, M. Marinov, T. Troev, ―Studies of glass structure in the TeO2 - Fe2O3 system‖ Mater. Res. Bull. 14
(1979) 735.
[20] M. Arnaudov, V. Dimitrov, Y. Dimitriev, L. Markova, ―Infrared-spectral investigation of tellurites‖ Mater. Res. Bull. 17 (1982) 1121. [21] S. Rada, E. Culea, V. Rus, M. Pica, M. Culea, ―The local structure of gadolinium vanado-tellurite glasses‖ J. Mater. Sci. 43 (2008) 3713. [22] B. Stuart, 2004 Infrared Spectroscopy: Fundamentals and
Applications John Wiley & Sons, Ltd,ISBNs: 0-470-85427-8 (HB); 0-470-85428-6 (PB)
[23] W.L. Konijnendijk, J.M. Stevels, 1975, ―The structure of borate glasses studied by Raman scattering‖ J. Non-Cryst. Solids 18 (1975) 307.
[24] Ramesh Boda, G. Srinivas, D. Komaraiah, B. Srinivas, Md. Shareefuddin, and R. Sayanna, 2016, ―Optical constants, single-oscillator modal and refractive index dispersion analysis of lithium zinc bismuth borate glasses doped with Eu3+ ions‖ AIP Conference Proceedings 1728, 020358 (2016); doi: 10.1063/1.4946409 [25] F. Yakuphanoglu, A. Cukurovalib, I. Yilmaz, 2004, ―
Determination and analysis of the dispersive optical constants of some organic thin films‖ Physica B 351 (2004) 53–58.
[26] Mujdat Caglar, Saliha Ilican, Yasemin Caglar, Yucel S¸ ahin, Fahrettin Yakuphanoglu, Deniz Hur, " A spectroelectrochemical study on single-oscillator model and optical constants of sulfonated polyaniline film‖ Spectrochimica. Acta Part A 71 (2008) 621–627. [27] F. Urbach, ―The Long-Wavelength Edge of Photographic
Sensitivity and of the Electronic Absorption of Solids‖ Phys. Rev. 92 (1953) 1324.
[28] A. Levasseur, J. C. Brethous, J. M. Reau, P. Hangenmuller and M. Couzi, 1980, Synthesis and characterization of new solid electrolyte conductors of lithium ions Solid State Ionics 1 (1980) 177-186. [29] Rajesh Parmar, R. S.Kundu, R.Punia,2 N.Kishore and
P.Aghamkar,2013, Fe2O3 Modified Physical, Structural and Optical