International Journal of Emerging Technology and Advanced Engineering
Website: www.ijetae.com (ISSN 2250-2459,ISO 9001:2008 Certified Journal, Volume 4, Issue 7, July 2014)
Recognition and Classification of Currency Notes using Discrete
Wavelet Transform
S. S. Sannakki
1, Pallavi J. Gunjale
21,2
Department of Computer Science and Engineering, Gogte Institute of Technology, Belgaum, Karnataka, India
Abstract— in this paper, our system propose to recognize
and classify the currency notes by using different steps starting from image acquisition, preprocessing, testing, training. Methodology used for feature extraction is Discrete Wavelet Transform (DWT) and approximate coefficient matrix of the currency image is derived. Statistical features are extracted using coefficient and stored in a vector. Extracted features are used to classify the currency note using Probabilistic Neural Network [1].
Index Terms—DWT, Probabilistic Neural Networks,
statistical features
I. INTRODUCTION
Recognition system has emerged as a „grand challenge' for computer vision, with the longer term aim of being able to achieve near human levels of recognition for tens of thousands of categories under a wide variety of conditions. It can be used in Banks, ATM machines etc. Our system is to recognize and classify any currency note from each other.
Pattern recognition is important field in computer vision and artificial intelligence. Automatic recognition of currency note is important in banking sectors, Automatic Teller Machines. By using ATM machine customer can access cash through debit card, credit cards etc. The current ATM machines are not fully automatic we need a human to place different currency note in different tray. To make it fully automatic good recognition system is required to identify each currency note from one another. Currency should be able to recognize from any direction. Currency can differ in size, color, texture. To recognize and classify currency notes it is important to extract features. In our system we are extracting statistical features to get correct accuracy [2][3].
II. PROPOSED ALGORITHM
A. Image Acquisition
In this step we scan images of different types of currency each (10, 20, 50,100 fig etc.) of good quality and bad quality with good clarity, i.e. with good brightness and contrast, for training as well as testing purpose using scanner.
B. Image Preprocessing
Image preprocessing is done on the images at the lower level where image data contains distortion and noise and enhances image for further processing. It does not increase image information content [4].
Our system first converts the original image into resized image with 0.5 scale then gray scale, and then uses edge as a factor to extract the region of interest from the given image. Edges are pixels where the intensity image function changes abruptly. Edge detectors are collection of local image pre-processing methods used to locate changes in the brightness function. Edges are the sign of lack of continuity, and ending. EDGE Find edges in intensity image. EDGE takes image as its input, and gives output a binary image of the same size, with 1's where the function finds edges in image and 0's elsewhere. Canny method is used for edge detection [14].
Preprocessing is done for enhancing the image and to remove noise and used for further processing. It includes
Image resizing –
Scanned image will be too big in size. In order to reduce the size image interpolation must be done. The image is resized
Image rotating –
Image is rotated by converting image to binary image and finding Region of Interest (ROI).
Edge Detection-
Here we extract the region of interest of the currency image. Because background elimination cannot be completely done in the preprocessing stage so further edge detection is carried out to get the exact region of interest by using inbuilt function edge ( ).By default, edge uses the canny method to detect edges. The canny method finds edges using the canny approximation to the derivative.
International Journal of Emerging Technology and Advanced Engineering
Website: www.ijetae.com (ISSN 2250-2459,ISO 9001:2008 Certified Journal, Volume 4, Issue 7, July 2014)
C. Apply DWT to decompose the image
In order to accurately extract the features for training we decompose the image two levels.
The images are decomposed into four sub-bands or sub-sampled, after applying DWT [9]. These sub-bands are labeled as LL1, LH1, HL1 and HH1. LH1, HL1 and HH1 sub-bands represent the finest scale wavelet coefficients, i.e., image details and the sub-band LL1 corresponds to the coarse level coefficients i.e., image approximation. To obtain the next coarse level of wavelet coefficients, the sub-band LL1 can be decomposed and sampled. Similarly, LL2 can be used for further decomposition. This process continues until the final scale. The transformed coefficients, image approximation and image details are exploited for texture analysis, discrimination and statistical feature extraction.
D. Feature Extraction
In pattern recognition and image processing, feature extraction is a special form of dimensionality reduction. Transforming the input data into the set of features is called feature extraction [9]. If the features extracted are carefully chosen, it is expected that the features set will perform the desired task using the reduced representation instead of the full size input.
For an image, a feature can be defined as the interest part of the image. These features play a fundamental role in classification. In image processing, image features usually include color, shape and texture features. In our system we are finding statistical features. Transformed coefficients are used to calculate statistical features. Mean, Standard deviation, skewness, kurtosis are the various features which are considered for the classification as per the application.
Following equations are used for calculating mean, standard deviation, skewness and kurtosis.
Mean= ∑
Standard Deviation = √∑ ( )
Skewness = √∑ | |
Kurtosis= √∑ ( )
E. Classification of currency
Training
The extracted features are then used to train the neural network. For this Probabilistic neural network has been used.
We use an inbuilt function provided by MATLAB that is “newpnn”. Newpnn function is used to design a new Probabilistic neural network.
Testing
[image:2.612.368.500.344.595.2]In the testing phase for the test currency the user is suppose to follow the same procedure till feature extraction to extract the features. We make use of a inbuilt function “sim” which compares the extracted features of the currency under test conditions to all the currency in the database, if the features are matched it displays the appropriate result to the user, else it displays it as “Unknown currency”.
Fig 1.Algorithm used for Recognition and classification of currency notes
III. RESULT ANALYSIS
In this section results for Image acquisition, preprocessing, feature extraction, training and testing are shown.
Image Acquisition
Preprocessing
Edge Detection
Apply DWT
International Journal of Emerging Technology and Advanced Engineering
Website: www.ijetae.com (ISSN 2250-2459,ISO 9001:2008 Certified Journal, Volume 4, Issue 7, July 2014)
A. Resizing image
Fig 2 shows the result of resized image with 0.5 scales
Fig 2 Resized image
B. Converting original image to binary image
Fig 3 shows the result of original image converted to binary image
Fig 3 Binary image
C. Image rotation
Fig 4 shows the image after rotation, this is done by finding region of interest. Rotation of the image is done clockwise or anticlockwise till the equal pixels on both the halves.
Fig 4 Image after rotation
D. Applying edge detection
Fig 5 shows the result after applying edge detection using canny method.
Fig 5 Image after applying Edge detection
E. Applying DWT to decompose image in to 1 level
Fig 6 shows result after applying Discrete Wavelet Transform to 1 level. Image is decomposed into 4 sub bands.
Fig 6 Decomposition of image to 1 level
F. Decomposing image to 2 level
Fig 7 shows the result of applying DWT to 2 level decomposition.
Fig 7 Decomposition of image to 2 level
G. Recognition and Classification of currency
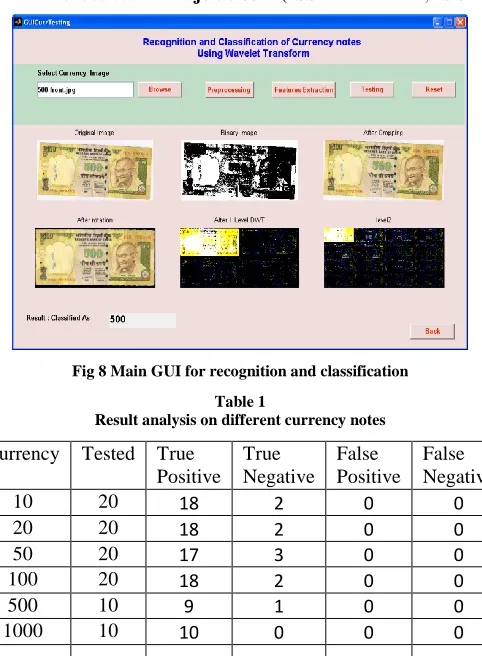
Fig 8 shows the main GUI used for recognition and classification of currency notes after training and testing. Original Resized Image with 0.5 scale
Binary Image
After rotation
International Journal of Emerging Technology and Advanced Engineering
[image:4.612.48.289.128.456.2]Website: www.ijetae.com (ISSN 2250-2459,ISO 9001:2008 Certified Journal, Volume 4, Issue 7, July 2014)
Fig 8 Main GUI for recognition and classification
Table 1
Result analysis on different currency notes
Currency Tested True Positive True Negative False Positive False Negative
10 20 18 2 0 0
20 20 18 2 0 0
50 20 17 3 0 0
100 20 18 2 0 0
500 10 9 1 0 0
1000 10 10 0 0 0
Total 100 90 10 0 4
IV. CONCLUSION
In this project work the area of Currency recognition is introduced. The system developed here is for currency recognition, the development of good classification methods and precise features is very important in order to run the system in real time. Therefore proposed approach which is based on PNN got a better results and recognition rate of 90.38%.
A PNN based classifier is adopted which uses the combination of various features to recognize and identify the currency. The results are encouraging and promise the development of a good machine vision system in the area of recognition and classification of currency.
In future we can increase accuracy by using other classification methods or by extracting other features.
Acknowledgment
We thank Visvesvaraya Technological University, Belgaum, and Karnataka, India for funding this project and providing a platform for research and development.
REFERENCES
[1] Amir Rajaei, Elham Dallalzadeh, Mohammad Imran, “Feature Extraction of Currency Notes: An Approach Based on Wavelet Transform”, Second International Conference on Advanced Computing & Communication Technologies,IEEE Explorer, 2012 [2] J. Geronimo, D, Phardin PM assopust, “Fractal Functions and Walvet
Expansions based on Several Scaling Functions,” Journal of approximation, 1994.
[3] Amol A. Shirsath, S.D. Bharkad,”Survey of Currency Recognition System Using Image Processing” International Journal of Computational Engineering Research,Vol, 03,July 2013
[4] Rubeena Mirza, Vinti Nanda “Paper Currency Verification System Based on Characteristic Extraction Using Image Processing” International Journal of Engineering and Advanced Technology, Volume-1, February 2012
[5] D.A.K.S. Gunartnal, N. D. Kodikara, and H. L. Premaratne, “ANN Based Currency Recognition System using Compressed Gray Scale and Application for Sri Lankan Currency Notes-SLCRec” World Academy of Science, Engineering and Technology Vol:21, September 2008
[6] Parminder Sing Reel, Gopal Krishan, Smarti Kotwal “Image Processing based Heuristic Analysis for Enhanced Currency Recognition” International Journal of Advancements in Technology, Vol 2, January 2011
[7] Rubeena Mirza, Vinti Nanda “Paper Currency Verification System Based on Characteristic Extraction Using Image Processing” International Journal of Engineering and Advanced Technology (IJEAT) ISSN: 2249 – 8958, Volume-1, Issue-3, February 2012 [8] Dipti Pawade Pranchal Chaudhari Harshada Sonkamble
“Comparative Study of Different Paper Currency and Coin Currency Recognition Method” International Journal of Computer Applications (0975 – 8887) Volume 66– No.23, March 2013
[9] Marcin Kociołek, Andrzej Materka, Michał Strzelecki, Piotr Szczypiński “Discrete Wavelet Transform – Derived features for digital image texture analysis” Proc. of International Conference on Signals and Electronic Systems, 18-21 September 2001.
[10] Vipin Kumar Jain Dr. Ritu Vijay “Indian Currency Denomination Identification Using Image Processing Technique” International Journal of Computer Science and Information Technologies, Vol. 4 (1), 2013
[11] Ms.Rumi Ghosh*, Mr Rakesh Khare “A Study on Diverse Recognition Techniques for Indian Currency Note” International Journal of Engineering science and Research Technology June, 2013. [12] Bhupendra Singh, Pankaj Badoni, Kuldeep Verma “Computer Vision based Currency Classification System” International Journal of Computer Applications Volume 16– No.4, February 2011.
[13] Wen-Tzeng Huang , Sun-Yen Tan , Yuan-Jen Chang , Chin-Hsing Chen “A Discrete Wavelet Transform Based Robust Watermarking for Copyright Protection” Recent Advances in Networking, VLSI and Signal Processing.
[14] Canny Edge Detection, March 23, 2009
[15] G.T. Shrivakshan , Dr.C. Chandrasekar “ A Comparison of various Edge Detection Techniques used in Image Processing” IJCSI International Journal of Computer Science Issues, Vol. 9, Issue 5, No 1, September 2012
International Journal of Emerging Technology and Advanced Engineering
Website: www.ijetae.com (ISSN 2250-2459,ISO 9001:2008 Certified Journal, Volume 4, Issue 7, July 2014)
[17] İbrahim Öz Cemil Öz Nejat Yumuşak “Image Compression using 2-D Multiple level Discrete Wavelet Transform (DWT)” Sakarya University, Faculty of Engineering, Department of Electrical & Electronics Engineering, Sakarya, Turkey
[18] Hanish Aggarwal1, Padam Kumar “Indian Currency Note Denomination Recognition in Color Images” International Journal on Advanced Computer Engineering and Communication Technology Vol-1.
[19] Raman Maini & Dr. Himanshu Aggarwal “Study and Comparison of Various Image Edge Detection Techniques” International Journal of Image Processing (IJIP), Volume (3) : Issue (1)