ISSN: 1992-8645 www.jatit.org E-ISSN: 1817-3195
451
FILTERED DISTANCE MATRIX FOR CONSTRUCTING
HIGH-THROUGHPUT MULTIPLE SEQUENCE ALIGNMENT
ON PROTEIN DATA
MUHANNAD A. ABU-HASHEM, NUR'AINI ABDUL RASHID, ROSNI ABDULLAH, ATHEER A. ABDULRAZZAQ AND AWSAN A. HASAN
Faculty of Information Technology, Middle East University Amman, Jordan
School of Computer Sciences, Universiti Sains Malaysia USM Pulau Pinang, Malaysia
Email: [email protected]; [email protected]; [email protected]; [email protected] ; [email protected]
ABSTRACT
Multiple sequence alignment (MSA) is a cornerstone process in computational biology and bioinformatics. Although numerous algorithms have been proposed for MSA, producing an efficient MSA with high accuracy remains a huge challenge. Progressive alignment method is broadly used for constructing MSA. It uses guide trees as an input to guide the alignment process. Pair-wise alignment plays a significant role in building the distance matrices where distance matrices are necessary for building the guide trees. Robust distance matrix leads to better MSA. In this research, we present Filtered Distance Matrix for building MSA (FDM-MSA) to construct MSA. FDM-MSA is divided into four phases: constructing the distance matrix, building the filtering system, building the guide tree, and constructing the MSA. HashTable-N-Gram-Hirschberg (HT-NGH) is used to build the distance matrix. Two sequence detectors are involved in building the filtering system: multi-domain detector and outlier detector. After filtering the distance matrix, Neighbor Joining and progressive alignment methods are employed to construct the guide tree and MSA. The experiments show that the FDM-MSA algorithm shows improved performance in both terms; time and accuracy. FDM-MSA algorithm obtains the best time performance over all competitive methods in most datasets, as well as obtains the highest Sum-of-Pairs Score on RV2 dataset of BAlibase dataset and the second best Total Column score on average.
Keywords: Multiple Sequence Alignment; Progressive Alignment; Guide Tree;
1. INTRODUCTION
MSA is a cornerstone process in bioinformatics because it is necessary for sequence analysis. MSA plays an essential role in identifying sequences and collecting information about them [1]. Representing and identifying sequence families are the most significant tasks of MSA. Indirectly, MSA helps in predict the structure and function of sequences by relating them to their closest similar families. It also builds the phylogenetic tree, which helps in constructing
the evolutionary history of species and in conducting evolution studies on molecules [2].
ISSN: 1992-8645 www.jatit.org E-ISSN: 1817-3195
452 progressive alignment [15, 16], probabilistic and statistics-based alignment [17-23], iterative alignment [24, 25], and alignment based on population-based metaheuristic methods [26-36]. Most computational methods in MSA research field are based on progressive alignment but they vary by the technique they use beside the progressive alignment method.
Despite the diversity of methods and the large number of algorithms that have been proposed to solve MSA, producing efficient MSAs with high accuracy remains a huge challenge [1, 6, 37]. Applying multiple protein sequence alignments on large datasets through progressive alignment also requires hours [38]. Faster algorithms are necessary because the biological sequence databases are growing rapidly ([39, 40]. Some methods have reached high accuracy, such as MSAprobs algorithm [1] with high execution time, while other methods have low execution time, such as Multiple Sequence Comparison by Log-Expectation (MUSCLE) [41, 42] and Clustal W [43], but suffer from low accuracy. Guide tree construction has an impact on MSA performance but it is time-consuming process, since construction the guide tree requires the time-consuming process of building the distance matrix. In short, the problems highlight the need for faster and more efficient MSA algorithms.
Moreover, guide tree has a significant role in guiding progressive alignment in the process of building MSA. Guide trees are used broadly in progressive alignment methods to guide the alignment process because the sequences are organized in the tree according to their resemblance score. Guide trees offer a pre-computed map that can be used as a compass to direct the progressive alignment.
Currently the MSA leading methods or the top performing algorithms in the protein MSA research field are Clustal-W [43], T-Coffee [44], MAFFT [45], MUSCLE [41, 42], ProbCons [46], Probalign [47], DIAlign-TX [48], and MSAProbs [1]. Also they are the most commonly used methods for comparing and
measuring the performance of new algorithms in the field.
MSA top performing methods are based on progressive alignment. Constructing MSA using progressive alignment method requires mainly three steps: (1) building the distance matrix, (2) building the guide tree, and (3) constructing the MSA progressively.
Even though all of the top performing methods use progressive alignment to build MSA, they vary by the techniques they use. For instance, to build the distance matrix, some methods use pair-wise alignment such as [1, 44] while others use approximate method such as [46, 47]. Furthermore to build the guide tree out of the pre-computed distance matrix, one of two different clustering methods is used: UPGMA [49] and NJ [50]. Also progressive alignment methods vary in the way of producing the alignment where some applied a refinement process such as [45, 47, 48] to the final step of progressive alignment in order to improve the alignment score, while others do not such as [43, 44] in order to avoid its overhead on execution time.
ISSN: 1992-8645 www.jatit.org E-ISSN: 1817-3195
453
2. PROBLEM DEFINITION
MSA is a process of aligning n DNA, RNA, or protein sequences where 2.
Say we have 'n' number of sequences ( 2), , , ..., and . The MSA of , , ..., and is a matrix , , where i is the number of sequences and j is the number of residues in each sequence.
3. MULTI-DOMAIN SEQUENCES
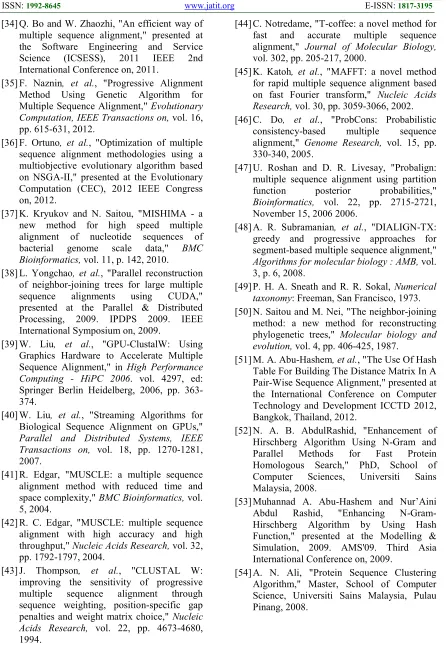
A multi-domain protein is a protein sequence that has two or more separate domains that may cause the merging of unrelated families in one cluster. The problem occurs when a transitive relationship between the sequences does not hold where (A ∈ B) ∩ (B ∈ C) (A ∈ C). Sequence X is considered as a multi-domain sequence for sequence 'a' and 'b' if sequence X is similar to sequence 'a' and sequence 'b', while sequence 'a' does not share a significant similarity to sequence 'b'. Figure 1 shows an example of a
multi-domain sequence
.
4. OUTLIER SEQUENCES
In clustering, outlier protein sequence is a noise sequence that does not belong to any cluster in the dataset. In other words, it is the sequence that does not belong to any family in the dataset and does not share a sufficient amount of similarity with any sequence in the dataset.
The definition clearly indicates that outlier sequences can bring the alignment down because it shares no similarity (or a very low amount of similarity) with other sequences. The effect of outlier sequences on MSA comes from the nature of constructing the MSA. MSA construction starts with aligning the two closest sequences, adding the next closest sequence to them, and so on. In this case, when we add the outlier sequence in the early stages of the alignment process, it will distort the alignment.
5. METHOD
FDM-MSA is a progressive alignment method to build multiple sequence alignment. Building MSA using FDM-MSA is done by: (i) building pair-wise alignment and constructing the distance matrix; (ii) filtering the distance matrix from outlier sequences which includes two different clustering methods: multi-domain sequences detector and outlier sequences detector; (iii) constructing the guide tree from the filtered distance matrix; (v) applying progressive alignment to the pre-computed guide tree and constructing the MSA.
5.1. Distance Matrix Construction
To calculate the distance between protein sequences, pair-wise alignment is performed. We use HT-NGH pair-wise alignment algorithm [51] to calculate the distance and construct the distance matrix. HT-NGH is an extension to the N-Gram-Hirschberg (NGH) [52] and Hashing-N-Gram-Hirschberg (H-NGH) [53] pair-wise
Sequence X
Sequence b
Domain 2 Domain 1
Domain 2
Domain 1
[image:3.612.132.442.261.385.2]Sequence a
ISSN: 1992-8645 www.jatit.org E-ISSN: 1817-3195
454 alignment methods; it uses the hash table capabilities to enhance the transformation phase.
Distance d is defined as the number of mismatches between the pair of sequences and over the length of the longest sequence between the compared sequences.
,
1
_ !",!#$% !",$% !#
(1)
Since the matrix is symmetric, all we need is
& #' (
of the total alignment. To avoid repeating
the same alignment, we put the alignment process into a continuous mode, where each sequence is compared with all other sequences once and then will not be considered for the alignment again.
5.2. Filtering System
The filtering system is proposed to identify the outlier sequences (i.e., sequences that do not belong to the family in the dataset). It inspired from a clustering method described in [54]. The filtering system includes two detectors: multi-domain detector and outlier detector. The input for the filtering system is a pre-computed distance matrix that produces a filtered distance matrix as an output. The first process in the filtering system is building the multi-domain detector depending on the pre-computed distance matrix. The main reason behind multi-domain detector process is to enhance the performance of the outlier detector by reducing the collision caused by multi-domain sequences. The second process is detecting the outlier sequences using the pre-computed distance matrix along with the list of multi-domain sequences produced by the multi-domain detector algorithm.
5.2.1.Multi-Domain Detector
Detecting multi-domain sequences is a pre-process of the outlier detection in order to avoid unnecessary links between the nodes. It would also avoid using multi-domain protein sequences as the core point during the clustering process. Building the multi-domain detector mainly
includes: constructing the directed score matrix and detecting the multi-domain sequences.
Building the Directed Score Matrix: indirect edges do not emphasize the real similarity between the sequences (i.e., the similarity from sequence A to sequence B is not necessarily the same as the similarity from sequence B to sequence A). Therefore, in order to detect the multi-domain protein sequences, the pre-computed symmetric distance matrix will be replaced by an asymmetric distance matrix using the equation applied in the method proposed by Eva Bolten in 2001 [55]. To convert the matrix to an asymmetric matrix, we assume to have a symmetric distance matrix W containing the sequences P and Q. The distance W(P,Q), which is the distance from P to Q, and the distance W(Q,P), which is the distance from Q to P, are calculated using the formula in Equation 2:
W P,Q
=
,-. /,0 1 22
,-. /,/
(
2
)
where raw(P,Q) is the distance value between P and Q taken from the distance matrix.
Detecting the multi-domain sequences: After building the directed distance matrix, the algorithm starts detecting multi-domain protein sequences by following the procedure proposed in GeneRAGE algorithm [56].
Let us assume we have an S group, which contains the sequences that have significant similarity to protein 'x' where W(x, S) > threshold and W(S, x) > threshold, and the threshold is set by the user. For each pair of sequences (a, b) in the group S, they should pass through the similarity test using the following IF condition:
IF
W(a, b) > threshold and W(b, a) > threshold
ISSN: 1992-8645 www.jatit.org E-ISSN: 1817-3195
455 'x' isn't a multi-domain sequence for 'a' and 'b'
ELSE
'x' is a candidate multi-domain sequence for two different domains 'a' and 'b'
After passing all possible pairs of sequences through the similarity condition, all possible multi-domain relations will be detected and stored in a list.
5.2.2.Outlier Detector
The main purpose of the outlier detector algorithm is to find the outer sequences from the dataset. To detect the outlier sequences, the algorithm combines two clustering methods: multi-domain detector algorithm and Shared Nearest Neighbor (SNN) [57] clustering algorithm. Inputs for the outlier detector algorithm are the pre-computed distance matrix and a list of multi-domain sequences, which, in turn, it produces a list of outlier sequences. To avoid clustering distortion caused by multi-domain points, the multi-multi-domain points are excluded from the point set until the process of identifying the points is done. Afterward, the points are attached to the closest cluster.
5.2.3.Filtering the distance matrix
Filtering the distance matrix is done by marking the sequences that share no similarity or very low similarity with the rest of the sequences in the matrix. To identify the sequences, we depend on the list of outlier sequences produced by the outlier detector. Separating the outlier sequences in the guide tree will assist building better MSAs by telling the aligner which sequences to focus on and which to ignore or avoid giving high attention.
5.3. Guide Tree Construction
NJ clustering method is used to build the guide tree. The input of NJ algorithm is the filtered distance matrix, where the output is a guide tree with n leaves (n is the number of sequences). To start the tree construction, NJ algorithm decomposes the sequences into a star-like tree with equal branch lengths. NJ method produces a correct guide tree if it receives exact distances [58]. Furthermore, even if minor errors occur in
the distances, NJ can still provide a correct guide tree [50].
5.4. MSA construction
To construct the MSA, progressive alignment method is used. Progressive alignment method requires a pre-computed guide tree as an input to build the alignment. The guide tree is used to direct the alignment process, starting from the closest pair of sequences and moving gradually toward the next closest sequence. Aligning the alignment or aligning a sequence to an alignment is done by using a consensus sequence of an alignment, and then the algorithm performs pair-wise alignment on the two sequences (the consensus sequence and the added sequence or the two consensus sequences). Given a guide tree with n leaves, progressive alignment requires (n -1) alignments to build MSA.
6. RESULTS
6.1. Measurements
To measure the results of FDM-MSA, two performance metrics are involved: execution time and accuracy. To measure and assess the accuracy of the proposed method, three factors were taken into consideration: benchmarks, score calculation methods, and comparative methods (MSA leading methods). All the time experiments were carried out on a PC with an Intel i7 quad-core 3.40 GHz processor and 6 GB RAM.
ISSN: 1992-8645 www.jatit.org E-ISSN: 1817-3195
456 groups. Finally, IRMbase dataset consists of 192 alignment groups divided equally into four reference sets: R1, R2, R3, and R4.
Sum-of-pairs score (SPS) is a method used to define the percentage of correctly aligned residue couple in a given alignment. SPS is calculated by dividing the correctly aligned residues pair-wisely (two residues at a time) in the multiple alignment produced by the target algorithm (test algorithm) over the total number of aligned residues in the reference alignment. Total column score (TC) or column score (CS) in some references is a method used to evaluate the percentage of correctly aligned columns of a given alignment. TC is calculated by dividing the number of correctly aligned columns in the alignment produced by the target algorithm (test algorithm) over the total aligned columns in the reference alignment.
To assess and evaluate the performance of FDM-MSA, the above accuracy measurements (benchmarks and scoring methods) are used and then the results of the FDM-MSA method are compared with the results of the most common, top performing, and leading algorithms of MSA. The algorithms used to compare and measure the accuracy of the proposed method are: Clustal-W version 1.8, T-Coffee version 8.99, MUSCLE version 3.8, MAFFT version 7.050b, Probalign version 1.4, ProbCons version 1.12, DIAlign-TX version 2.1, and MSAProbs version 0.9.7. The parameters and thresholds of filtering system's clustering methods are set according to the settings of the original methods (GeneRAGE and SNN) [54, 56, 57].
6.2. Time
This section discusses the time performance of FDM-MSA algorithm compared to the time performance of MSA leading methods. The time performance is measured by calculating the execution time of the comparative algorithms. Table 1, Table 2, Table 3, and Table 4 show the execution time of MSA leading methods and FDM-MSA on Balibase 3.0, IRMbase version 2.0, SABmark version 1.65 , and OXBENCH version 1.1 benchmark reference datasets. Experiments show that three algorithms earn the top time performance among all leading methods (MSA, Clustal-W, and MUSCLE). FDM-MSA reaches the best total execution time performance on Balibase and IRMbase benchmarks while it comes second for the rest of bench marks. Clustal-W and FDM-MSA methods take the lead in datasets with small amounts of sequences in the alignment file, while MUSCLE algorithm takes the lead with datasets that include alignment files with a high number of sequences. Also, FDM-MSA saves more time in the pair-wise alignment part compared with Clustal-W algorithm because the proposed method uses fast pair-wise alignment algorithm to build the distance matrix. Therefore, FDM-MSA is faster with the alignment files that contains high number of sequences.
Table 1 shows the execution time of the comparative methods on Balibase 3.0 benchmark reference datasets. The time experiment of FDM-MSA method shows an improvement in time performance over the leading methods on Balibase datasets. FDM-MSA reaches the lowest execution time in two reference datasets, RV4 and RV5, as well as the total execution time.
BaliBase
RV11 RV12 RV2
RV3
RV4
RV5
Total
FDM-MSA
30 46 312 439 163 97 1087Clustal-W
19 45 455 576 202 112 1409 [image:6.612.125.488.662.726.2]MUSCLE
31 46 262 299 352 117 1107ISSN: 1992-8645 www.jatit.org E-ISSN: 1817-3195
457
MAFFT
580 920 6924 6714 5043 3430 23611DIAlign-TX
50 100 1461 2039 581 307 4538TCoffee
1755 2491 29221 7423 1230 697 42817ProbCons
82 269 4623 7482 2749 1368 16573Probalign
47 200 3355 5101 1968 917 11588MSAProbs
82 286 5285 8182 2087 1382 17304Table 2 shows the execution time of the comparative methods on IRMbase benchmark reference datasets. FDM-MSA reaches the lowest execution time in two reference datasets, R3 and R4, as well as in total execution time. Nevertheless, two algorithms, Clustal-W and
FDM-MSA, clearly are competing for the top performance. The competition is a result of the different sequence lengths in each reference set, where the sequence length in R1 and R2 is shorter than that in R3 and R4.
IRMbase
R1
R2
R3
R4
Total
FDM-MSA
28 39 44 52 163Clustal-W
24 38 45 67 174MUSCLE
68 105 117 155 445MAFFT
1334 2328 2592 3844 10098DIAlign-TX
68 99 100 144 411TCoffee
1499 734 258 325 2816ProbCons
213 414 476 779 1882Probalign
126 269 327 547 1269MSAProbs
194 344 397 592 1527Table 3 shows the execution time of the comparative methods on SABmark benchmark datasets. FDM-MSA method comes in second place in the SUP group and third in the Twi group where Clustal-W leads. This finding
comes as a result of the low number of sequences to align in SABmark alignment files, where the average number of sequences in the alignment files is less than five sequences in both groups (SUP and Twi).
SABMARK
SUP
Twi
Total
FDM-MSA
57 24 81Clustal-W
51 16 67MUSCLE
69 22 91MAFFT
1537 512 2049 [image:7.612.96.524.71.185.2]DIAlign-TX
162 47 209 [image:7.612.142.474.341.494.2]Table 2: Execution time results on IRMbase [the bold values represent the shortest execution time (in seconds)]
[image:7.612.188.426.634.737.2]ISSN: 1992-8645 www.jatit.org E-ISSN: 1817-3195
458
TCoffee
1991 167 2158ProbCons
150 36 186Probalign
95 24 119MSAProbs
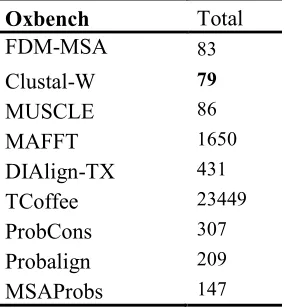
152 34 186Table 4 shows the execution time of the comparative methods on OXbench benchmark reference dataset. FDM-MSA method comes in second place in the dataset where Clustal-W gets the top time performance. This performance comes as a result of the low number of sequences to be aligned in OXbench alignment files, where the average number of sequences in the alignment files is less than nine sequences per
alignment file, while about three-fourth of the alignment files have less than seven sequences. In addition to the low number of sequences to be aligned, the sequences in OXbench datasets are also short (less than 300 residues in general), which is another advantage for Clustal-W algorithm to take the lead over MUSCLE and
FDM-MSA methods.
Oxbench
Total
FDM-MSA
83Clustal-W
79MUSCLE
86MAFFT
1650DIAlign-TX
431TCoffee
23449ProbCons
307Probalign
209MSAProbs
1476.3. Accuracy
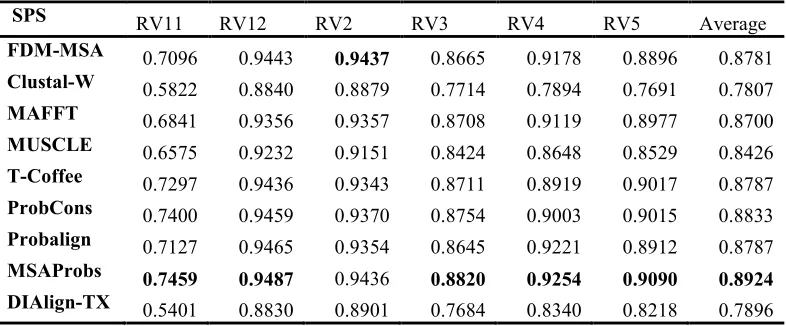
This section discusses the accuracy performance of FDM-MSA method compared to the performance of MSA leading methods. Table 5 and Table 6 show the sum of pairs score (SPS) and total column (TC) score of the comparative methods on Balibase 3.0 benchmark reference datasets. Experiments show that FDM-MSA method outperforms most of the leading methods on average, while it takes the lead with highest accuracy in some alignment files. The enhancement basically comes as a result of the combination of the pair-wise method and the filtering system. The proposed method shows improved results compared to those of other
leading methods on the files that contain multi-domain and outlier sequences.
[image:8.612.92.523.71.156.2]The results shown in Table 5 presents the average SPS score values for each Balibase’s reference set. FDM-MSA method reaches the highest performance over all leading methods in the RV2 reference dataset, while it comes in third, fourth, fifth, and sixth place for the rest of the Balibase reference datasets. FDM-MSA method outperforms all comparative methods in the RV2 reference dataset. This improvement comes as a result of the nature of the dataset and the nature of the FDM-MSA method. Since Balibase has a divergent orphan sequence [1], alignment files in these datasets may contain Table 4: Execution time results on OXbench [the bold values represent the shortest execution time (in
[image:8.612.237.379.349.503.2]ISSN: 1992-8645 www.jatit.org E-ISSN: 1817-3195
459 outlier sequences that can bring the alignment score down if they do not maintained correctly.
RV2 reference set also contains high divergent
orphan sequences [1]
SPS RV11 RV12 RV2 RV3 RV4 RV5 Average
FDM-MSA 0.7096 0.9443 0.9437 0.8665 0.9178 0.8896 0.8781 Clustal-W 0.5822 0.8840 0.8879 0.7714 0.7894 0.7691 0.7807 MAFFT 0.6841 0.9356 0.9357 0.8708 0.9119 0.8977 0.8700 MUSCLE 0.6575 0.9232 0.9151 0.8424 0.8648 0.8529 0.8426 T-Coffee 0.7297 0.9436 0.9343 0.8711 0.8919 0.9017 0.8787 ProbCons 0.7400 0.9459 0.9370 0.8754 0.9003 0.9015 0.8833 Probalign 0.7127 0.9465 0.9354 0.8645 0.9221 0.8912 0.8787 MSAProbs 0.7459 0.9487 0.9436 0.8820 0.9254 0.9090 0.8924 DIAlign-TX 0.5401 0.8830 0.8901 0.7684 0.8340 0.8218 0.7896
Table 6 shows the average TC score values for each Balibase reference set. The performance of FDM-MSA method is not stable compared to the comparative methods’ performance, where it comes in at second, third, fourth, and fifth place. The best performance that FDM-MSA method reaches is in RV2 and in the Average columns, where it comes in at second place. Mainly, this little drop in the performance compared with the SPS score comes as a result of TC scoring method behaviour. The TC score method
matches methods’ aligned file columns with a reference alignment columns, and it returns zero if there is any slight dissimilarity between the two columns (even if the mismatch is in one raw). Thus, to get a score equal to one, the two columns (the aligned file column and reference file column) should be identical, which is also difficult to obtain and it does not tell the real matching percentage (one mismatch means zero score).
TC RV11 RV12 RV2 RV3 RV4 RV5 Average
[image:9.612.111.504.174.337.2]FDM-MSA 0.5019 0.8631 0.5141 0.5696 0.6007 0.5646 0.6151 Clustal-W 0.3253 0.7559 0.3386 0.3817 0.3982 0.3650 0.4274 MAFFT 0.4754 0.8426 0.4891 0.6007 0.5861 0.5904 0.6048 MUSCLE 0.4332 0.8200 0.4222 0.4768 0.4532 0.4750 0.5134 T-Coffee 0.5143 0.8585 0.4874 0.5637 0.5424 0.6016 0.5947 ProbCons 0.5276 0.8682 0.5080 0.6005 0.5361 0.5952 0.6059 Probalign 0.4857 0.8677 0.4669 0.5972 0.6123 0.5436 0.5956 MSAProbs 0.5365 0.8746 0.5408 0.6342 0.6251 0.6143 0.6376 DIAlign-TX 0.3172 0.7600 0.3469 0.3992 0.4517 0.4567 0.4553
[image:9.612.111.504.530.686.2]Table 5: SPS score on Balibase (the bold values represent the highest score)
ISSN: 1992-8645 www.jatit.org E-ISSN: 1817-3195
460
7. CONCLUSION
In this paper we present FDM-MSA a progressive alignment method for high-throughput multiple protein SA construction. The pair-wise alignment method used in FDM-MSA method is a fast, robust, and recent method called HT-NGH. The filtering system is built using a combination of two clustering methods: GeneRAGE and SNN. The main purpose of the filtering system is to detect outlier sequences efficiently even if they get covered by multi-domain sequences. FDM-MSA method outperforms the comparative methods in many occasions in terms of time performance, while it comes in second or third place as its lowest performance. On the other hand, the accuracy results are not as good as the time performance improvement, though it reaches the best performance in RV2 as well as competes and takes a place among the highest accuracy algorithms. The improvement in time performance comes as a result of: using a fast distance matrix construction method and getting rid of the refinement process. The accuracy performance improvement comes as a result of using a robust distance matrix construction method and applying a filtering process to the distance matrix to detect the outlier sequences. Note that the fastest algorithms of MSA are among the lowest accuracy performance, and the most accurate algorithms are not among the fastest algorithms. Therefore, FDM-MSA method outperforms the most accurate algorithms in terms of execution time and competes with them in terms of accuracy performance.
In addition, the filtering system has an impact on the files that have multi-domain and outlier sequences. Thus, it does not have any effect on the accuracy score if all sequences belong to the same family (share significant similarity among each other). On the other hand, FDM-MSA method does not apply any iterative refinement at the end of the aligning process to save the execution time because it depends on building robust distance matrix and filtering the distance matrix for further robustness.
ACKNOWLEDGEMENT
This research is supported by UNIVERSITI SAINS MALAYSIA and has been funded by the Research University Cluster (RUC) grant titled by “Reconstruction of the Neural Microcircuitry or Reward-Controlled Learning in the Rat Hippocampus” (1001/PKOMP/8630022).
REFERENCES
[1] Y. Liu, et al., "MSAProbs: multiple sequence alignment based on pair hidden Markov models and partition function posterior probabilities," Bioinformatics, vol. 26, pp. 1958-1964, 2010.
[2] W. Pirovano and J. Heringa, "Multiple Sequence Alignment," in Bioinformatics. vol. 452, J. Keith, Ed., ed: Humana Press, 2008, pp. 143-161.
[3] R. C. Edgar and S. Batzoglou, "Multiple sequence alignment," Current opinion in structural biology, vol. 16, pp. 368-373, 2006.
[4] D. A. Morrison, "Multiple sequence alignment for phylogenetic purposes," Australian Systematic Botany, vol. 19, pp. 479-539, 2006.
[5] C. Kemena and C. Notredame, "Upcoming challenges for multiple sequence alignment methods in the high-throughput era," Bioinformatics, vol. 25, pp. 2455-2465, 2009. [6] M. Jeevitesh, et al., "Higher accuracy protein Multiple Sequence Alignment by Stochastic Algorithm," 2010.
[7] J.-M. Richer, et al., "A new dynamic programming algorithm for multiple sequence alignment," in Combinatorial Optimization and Applications, ed: Springer, 2007, pp. 52-61.
[8] L. Wang and T. Jiang, "On the complexity of multiple sequence alignment," Journal of computational biology, vol. 1, pp. 337-348, 1994.
[9] H. T. Rausch, "Dissecting Multiple Sequence Alignment Methods," 2010.
ISSN: 1992-8645 www.jatit.org E-ISSN: 1817-3195
461 [11] R. Thomsen, et al., "A clustal alignment
improver using evolutionary algorithms," presented at the Evolutionary Computation, 2002. CEC'02. Proceedings of the 2002 Congress on, 2002.
[12] E. Corel, et al., "A min-cut algorithm for the consistency problem in multiple sequence alignment," Bioinformatics, vol. 26, pp. 1015-1021, 2010.
[13] I. Wohlers, et al., "Algorithm engineering for optimal alignment of protein structure distance matrices," Optimization Letters, vol. 5, pp. 421-433, 2011.
[14] K. R. Sharma, Bioinformatics: Sequence alignment and markov models: McGraw-Hill, 2009.
[15] P. Hogeweg and B. Hesper, "The alignment of sets of sequences and the construction of phyletic trees: an integrated method," Journal of molecular evolution, vol. 20, pp. 175-186, 1984.
[16] D. F. Feng and R. F. Doolittle, "Progressive sequence alignment as a prerequisitetto correct phylogenetic trees," Journal of molecular evolution, vol. 25, pp. 351-360, 1987.
[17] J. S. Liu, et al., "Bayesian models for multiple local sequence alignment and Gibbs sampling strategies," Journal of the American Statistical Association, vol. 90, pp. 1156-1170, 1995.
[18] T. K. Rasmussen and T. Krink, "Improved Hidden Markov Model training for multiple sequence alignment by a particle swarm optimization—evolutionary algorithm hybrid," Biosystems, vol. 72, pp. 5-17, 2003. [19] J. Pei and N. V. Grishin, "MUMMALS:
multiple sequence alignment improved by using hidden Markov models with local structural information," Nucleic Acids Research, vol. 34, pp. 4364-4374, 2006. [20] R. K. Bradley, et al., "Fast statistical
alignment," PLoS computational biology, vol. 5, p. e1000392, 2009.
[21] X. Deng and J. Cheng, "MSACompro: protein multiple sequence alignment using predicted secondary structure, solvent accessibility, and residue-residue contacts," BMC bioinformatics, vol. 12, p. 472, 2011. [22] K. S. M. T. Hossain, et al., "Improved
Multiple Sequence Alignments Using Coupled Pattern Mining," Computational Biology and Bioinformatics, IEEE/ACM
Transactions on, vol. 10, pp. 1098-1112, 2013.
[23] J. Sun, et al., "Multiple Sequence Alignment with Hidden Markov Models Learned by Random Drift Particle Swarm Optimization," Computational Biology and Bioinformatics, IEEE/ACM Transactions on, vol. PP, pp. 1-1, 2013.
[24] M. Berger and P. J. Munson, "A novel randomized iterative strategy for aligning multiple protein sequences," Computer applications in the biosciences: CABIOS, vol. 7, pp. 479-484, 1991.
[25] G. J. Barton and M. J. Sternberg, "A strategy for the rapid multiple alignment of protein sequences: Confidence levels from tertiary structure comparisons," Journal of molecular biology, vol. 198, pp. 327-337, 1987.
[26] J. Kim, et al., "Multiple Sequence Alignment Using Simulated Annealing," Computer Applications in the Biosciences, vol. 10, pp. 419-426, Jul 1994.
[27] C. Notredame and D. G. Higgins, "SAGA: Sequence alignment by genetic algorithm," Nucleic acids research, vol. 24, pp. 1515-1524, Apr 15 1996.
[28] J. Moss and C. G. Johnson, "An ant colony algorithm for multiple sequence alignment in bioinformatics," Artificial Neural Nets and Genetic Algorithms, Proceedings, pp. 182-186, 2003.
[29] T. Riaz, et al., "A TABU SEARCH ALGORITHM FOR POST-PROCESSING MULTIPLE SEQUENCE ALIGNMENT," Journal of Bioinformatics & Computational Biology, vol. 3, pp. 145-156, 2005.
[30] C. A. Lightner, "A Tabu Search Approach to Multiple Sequence Alignment," Ph.D, 2008. [31] L. Hai-Xia, et al., "Multiple Sequence
Alignment Based on a Binary Particle Swarm Optimization Algorithm," presented at the Proceedings of the 2009 Fifth International Conference on Natural Computation - Volume 03, 2009.
[32] X. J. Lei, et al., "Multiple Sequence Alignment Based on Chaotic PSO," Computational Intelligence and Intelligent Systems, vol. 51, pp. 351-360, 2009.
ISSN: 1992-8645 www.jatit.org E-ISSN: 1817-3195
462 [34] Q. Bo and W. Zhaozhi, "An efficient way of
multiple sequence alignment," presented at the Software Engineering and Service Science (ICSESS), 2011 IEEE 2nd International Conference on, 2011.
[35] F. Naznin, et al., "Progressive Alignment Method Using Genetic Algorithm for Multiple Sequence Alignment," Evolutionary Computation, IEEE Transactions on, vol. 16, pp. 615-631, 2012.
[36] F. Ortuno, et al., "Optimization of multiple sequence alignment methodologies using a multiobjective evolutionary algorithm based on NSGA-II," presented at the Evolutionary Computation (CEC), 2012 IEEE Congress on, 2012.
[37] K. Kryukov and N. Saitou, "MISHIMA - a new method for high speed multiple alignment of nucleotide sequences of bacterial genome scale data," BMC Bioinformatics, vol. 11, p. 142, 2010. [38] L. Yongchao, et al., "Parallel reconstruction
of neighbor-joining trees for large multiple sequence alignments using CUDA," presented at the Parallel & Distributed Processing, 2009. IPDPS 2009. IEEE International Symposium on, 2009.
[39] W. Liu, et al., "GPU-ClustalW: Using Graphics Hardware to Accelerate Multiple Sequence Alignment," in High Performance Computing - HiPC 2006. vol. 4297, ed: Springer Berlin Heidelberg, 2006, pp. 363-374.
[40] W. Liu, et al., "Streaming Algorithms for Biological Sequence Alignment on GPUs," Parallel and Distributed Systems, IEEE Transactions on, vol. 18, pp. 1270-1281, 2007.
[41] R. Edgar, "MUSCLE: a multiple sequence alignment method with reduced time and space complexity," BMC Bioinformatics, vol. 5, 2004.
[42] R. C. Edgar, "MUSCLE: multiple sequence alignment with high accuracy and high throughput," Nucleic Acids Research, vol. 32, pp. 1792-1797, 2004.
[43] J. Thompson, et al., "CLUSTAL W: improving the sensitivity of progressive multiple sequence alignment through sequence weighting, position-specific gap penalties and weight matrix choice," Nucleic Acids Research, vol. 22, pp. 4673-4680, 1994.
[44] C. Notredame, "T-coffee: a novel method for fast and accurate multiple sequence alignment," Journal of Molecular Biology, vol. 302, pp. 205-217, 2000.
[45] K. Katoh, et al., "MAFFT: a novel method for rapid multiple sequence alignment based on fast Fourier transform," Nucleic Acids Research, vol. 30, pp. 3059-3066, 2002. [46] C. Do, et al., "ProbCons: Probabilistic
consistency-based multiple sequence alignment," Genome Research, vol. 15, pp. 330-340, 2005.
[47] U. Roshan and D. R. Livesay, "Probalign: multiple sequence alignment using partition function posterior probabilities," Bioinformatics, vol. 22, pp. 2715-2721, November 15, 2006 2006.
[48] A. R. Subramanian, et al., "DIALIGN-TX: greedy and progressive approaches for segment-based multiple sequence alignment," Algorithms for molecular biology : AMB, vol. 3, p. 6, 2008.
[49] P. H. A. Sneath and R. R. Sokal, Numerical taxonomy: Freeman, San Francisco, 1973. [50] N. Saitou and M. Nei, "The neighbor-joining
method: a new method for reconstructing phylogenetic trees," Molecular biology and evolution, vol. 4, pp. 406-425, 1987.
[image:12.612.89.535.76.726.2][51] M. A. Abu-Hashem, et al., "The Use Of Hash Table For Building The Distance Matrix In A Pair-Wise Sequence Alignment," presented at the International Conference on Computer Technology and Development ICCTD 2012, Bangkok, Thailand, 2012.
[52] N. A. B. AbdulRashid, "Enhancement of Hirschberg Algorithm Using N-Gram and Parallel Methods for Fast Protein Homologous Search," PhD, School of Computer Sciences, Universiti Sains Malaysia, 2008.
[53] Muhannad A. Abu-Hashem and Nur’Aini Abdul Rashid, "Enhancing N-Gram-Hirschberg Algorithm by Using Hash Function," presented at the Modelling & Simulation, 2009. AMS'09. Third Asia International Conference on, 2009.
ISSN: 1992-8645 www.jatit.org E-ISSN: 1817-3195
463 [55] E. Bolten, et al., "Clustering protein
sequences—structure prediction by transitive homology," Bioinformatics, vol. 17, pp. 935-941, 2001.
[56] A. J. Enright and C. A. Ouzounis, "GeneRAGE: a robust algorithm for sequence clustering and domain detection," Bioinformatics, vol. 16, pp. 451-457, 2000. [57] L. Ertöz, et al., "Finding clusters of different
sizes, shapes, and densities in noisy, high dimensional data," presented at the SIAM international conference on data mining, 2003.
![Table 1: Execution time results on Balibase [the bold values represent the shortest execution time (in seconds)]](https://thumb-us.123doks.com/thumbv2/123dok_us/8908991.958285/6.612.125.488.662.726/table-execution-results-balibase-represent-shortest-execution-seconds.webp)
![Table 2: Execution time results on IRMbase [the bold values represent the shortest execution time (in seconds)]](https://thumb-us.123doks.com/thumbv2/123dok_us/8908991.958285/7.612.142.474.341.494/table-execution-results-irmbase-represent-shortest-execution-seconds.webp)