ISSN: 1992-8645 www.jatit.org E-ISSN: 1817-3195
OPTIMIZING COMMUNICATION AND COOLING COSTS IN
HPC DATA CENTER
1PROF. FADI FOUZ
,
2SHADI ALRAHAL1
Affiliation, Department of Computer Science College of Computing and Information Technology King Abdul-Aziz University
2
Affiliation, Department of Computer Science College of Computing and Information Technology King Abdul-Aziz University
E-mail: [email protected], 2 [email protected]
ABSTRACT
Decreasing communication among nodes is an important factor to achieve high performance in the data centers. All proposed allocation approaches (contiguous and discontiguous) targeted the nodes itself that are included in a data center. In this paper, we targeted the job itself to decrease the communication through proposing an algorithm that schedules the jobs according to their sizes called same_job_same_size (SJSS). Running these heavy jobs needs a high cooling cost to avoid point of faultier, caused by heat generated by active servers, since executing these jobs takes very long times. A hybrid allocation approach (CBS) is proposed to distribute these jobs over cold spots relying on heat recirculation factor (HRF) to decrease the cooling costs. Our proposed approach hits the best values, comparing to some other approaches, under terms of usage system and saving cooling costs where it achieved 14% of saving power consumption.
Keywords: Air Circulation, Communication Jump Message, Contiguous Allocation ,Cold Spots, Cooling Cost, Discontiguous Allocation, Hot Spot.
1. INTRODUCTION
Facing the high speed development in the computer world in addition to need a high performance to deal with high complex problems, many data centers with super computers are existed.
These data centers contain a thousands of processors located next to each other to maintain problems of a high level of complexity to achieve high performance computation (HPC). Such high complex problems, like Weather forecasting, climate researches, oil and gas mining, and detonation of nuclear weapons and nuclear fusion researches simulations, need the nodes inside data center to be active (i.e., running) for a long periods of time that may exceed days or weeks. [1] provides a description about components included in applications that need HPC, performance information related to such applications, and trying to combine these two aspects.
Communication processing among these nodes or even among threads of such applications, has a great effect on the performance due to exchanging data and messages where collision must be avoided when using message passing interface (MPI), for an
example. Therefore, the main recent aim for researches is to target the enhancing communication, during execution time, where the locations of selected nodes can directly affect the insensitive-computation-based applications performance[2, 3, 4, 5, 6]. As a bright proof, leung and others, showed that communication paths intersection has an important factor on execution time for jobs where this time could be doubled [3]. To enhance the output, collision of bandwidth conducted by communication paths intersection could be avoided through assigning jobs threads to those nodes that are located near each other [3, 7, 8].
ISSN: 1992-8645 www.jatit.org E-ISSN: 1817-3195
produced by the first category [8, 5, 11].From another point of view, other approaches took in account service level agreements (SLA [12]) to match the constraints of response time, as enhancing the performance [13].
However, the whole presented approached mentioned above ignored the size of jobs itself assigned to the nodes. In other words, scheduling jobs that have the same size or near to it in a same queue, and assigning them to the contiguous/ discontiguous nodes will improve the whole performance since we avoid fragmentation as it is described in the next section.
Because of processors in a data center may require to be active for a long time, power consumption is considered a major factor in data centers due to its need to be cold enough to avoid failure in processors. A report done in 2010 illustrates that electric power consumption increased to 56% during the range 2005 to 2010 [14]. This means that for every dollar spend for designing a data center, another dollar in front of it is spend foe cooling. The final aim of the proposed approaches to maintain this problem is to make computer room air conditioner (CRAC) as high as possible in the limitations of avoiding processors failure. To end the aim mentioned above, some proposed approaches relay on exploiting the nodes that have high recirculation contribution in the data center so that they target their entrance temperatures to be minimized [15, 16].
Other approaches focus on the servers itself so that the voltage or frequency related to the server will be modified according to the server state (active/idle), or focusing on the chassis of conditioner to be turned on/off according to the active/idle servers standing in front of it [17, 18]. In addition, different proposed approaches maintain cooling cost problem with taking in account free cooling [19] (i.e., exploiting climate temperature of outside), preventing frequent hotspots under greedy term [13], and distributing workload over physical machines that have higher fan speeds to achieve power consumption load balancing [20].
However, all approaches presented above ignored dealing with distribution hot/cold spots generated by cold air recirculation efficiently to decrease the cooling cost in data centers.
Because of the inverse proportionality between achieving high performance in data center, through enhancing connecting among active nodes, and decreasing the cooling consumption as high as possible, the statement of problem related to this
paper can be presented through the following question: how to enhance performance of a data center and save the cooling power at the same time? In this paper we presented two approaches to deal with the previous problem taking in account the size of jobs assigned to the processors in the data center with selecting contiguous nodes according to the distributed cold spots due to air recirculation to achieve our aim. The selected HPC data center includes high connecting with jobs to be performed using distributed systems and parallel computing paradigms. So, the contribution of this paper is listed as follows:
• A (same_job_size_scheduler, ), processors allocation approach depends on scheduler algorithm is proposed taking in account the size of jobs. This approach aims to schedule the jobs according to its sizes so that the jobs with almost a same sizes will be selected to run together on contiguous nodes.
• A hypird contiguous/discontiguous cooling cost approach is proposed (colder_spot_based approach, ) to select nodes according to the cold spots distribution so that the heavy jobs will be assigned to the nodes that located in the colder spots.
• Experimental evaluation is done to show a
proof against our claim.
The remainder of this paper is organized through presenting related work in section II, followed by data structure description within section III. Section IV provides our proposed system model. In section V we described the simulation, and finally we concluded in section VI.
2. RELATEDWORK
Many approaches has been developed that aim to enhance/decrease both data centers' performance, through enhancing connecting among processors/servers during running tasks, and data centers' cooling power respectively. In this section we will show these proposed approaches in the both aspects.
2.1 Enhancing Data Center Communication Strategies
ISSN: 1992-8645 www.jatit.org E-ISSN: 1817-3195
only discuss two of them in some details.
First, contiguous job allocation. [3] explains resources allocation to achieve processor locality for parallel tasks in super computers where these tasks are scheduled firstly, then assigned to group of processors to get highest output. To decrease communication costs and averting band width contention caused by tasks intersection while executing, it depends on one-dimensional allocation strategy (i.e., linear form). Look ahead approach is presented in [7] to deal with task allocation in a mesh-connected parallel processors when we have an extensive contacts. The key idea is to have a whole look over the mesh so that a new job will be passed to a detection phase after it has been selected by a scheduler. So, if we have a one sub-mesh, the job will be directly assigned to it, otherwise allocation heuristic algorithm will choose the suitable sub-mesh. In their research [9], surbramani and others tried to decrease communication costs, in the network that deals with communication insensitive jobs, caused by exchanging messages passing the switches, by allocating jobs to those nodes located in the same switch getting short communication hops. To avoid internal fragmentation and assigning sub-mesh to an accurate arriving task, [10] depended on sliding the frames in a vertical and horizontal form to deal with arbitrary sub-mesh size (this is called buddy strategy).
Another approach concerns about the applications or jobs itself, can be involved under this category [21].This research addressed the features of applications running on processors to achieve high performance where a system model is designed to help programmers to correlate these features with each other to enhance communication and the whole performance.
Second category is discontinuous job allocation. [8] illustrates that using contiguous allocation leads to less usage of the system. It uses MC 1×1 algorithm which links each free processor with a score referring to its allocation quality. The enhancement that is done here is searching about the processors that have lowest score, to be allocated, using carve-based strategy depending on Hilbert curve. Mache and others tried to present a solution, in their work [5], for message-passing bottleneck problem caused by using discontinuous job allocation because of resultant fragmentation. They proposed a strategy called MC allocation strategy that aims to find a cluster of idle nodes that are as integrated as possible to be assigned to a job.
To proof their claim, a comparison with block-based strategy is made. A rectangle form will be used to find the compact cluster or moving to sides to form as square as possible if rectangle form fails. In order to improve communication and increase system performance, [11] proposed TRB and LT-DC algorithms. The objective of TRB algorithm is to keep free nodes in the middle of the mesh, to minimize the external fragmentation, depending on calculating the suitable size of the sub-mesh for a new task, as a first step, then finding the suitable place to this task to trigger the second algorithm. Task migration process will be maintained by LT-DC algorithm to assign the sub-mesh, selected from the previous algorithm, to the task.
2.2 Decreasing Data Center Cooling Cost Because of huge increasing in cooling costs of data centers, many approaches are proposed to decrease this costs in the range of keep running servers in the safe case preventing the failure case.
[19] showed that free cooling could be exploited to decrease cooling costs in a data center. Besides to this it provided a reducing horizon control approach to allow dynamic control over switching between free and electrical cooling. The aim of this approach is to prevent frequent cooling mode transitions so that free cooling mode will be expanded over active servers rather than idle ones. To make cooling management of data center more clear, Taliver and others [18] provided simulation, using mercury, to show the data center layout temperatures. The components of their system are solver where computes temperatures using finite-element analysis, monitor samples the utilization of the components of the machine on which it is running and reports that information to the solver. Using hot air recirculation in a homogeneous data center, [16] presented a heuristic model to decrease the heat recirculation factor (HRF) so that tasks will be distributed/assigned over nodes whose entrances are more colder than the others. The key idea behind HRF [17] is distributing power proportionally to generated heat to the recirculated heat . A small HRF value indicates a strong recirculation contributor. It is clear that their aim was to maximize the total heat recirculation.
ISSN: 1992-8645 www.jatit.org E-ISSN: 1817-3195
minimizing heat recirculation algorithm is proposed where it exploits that hot air, going out the servers, needs many meters to reach the entrance of another server. During this trip the previous algorithm tries to recirculate this hot air before reaching to another server. Then, proposed zone based discretization algorithm will select the servers to be assigned to a job according to the places that has good recirculation (i.e., the distance between the places will be as long as possible). [17] targets both information technology equipment and conditioning power usage, in the data center, to decrease the cooling cost. For the first aspect, the authors selected an optimal temperature value for supplying the cold air depending on power dissipation term. For the second aspect, they based on server consolidation term (i.e., the incoming job will be assigned to the minimum active servers in the data center while other servers will be turned off), this is achieved by suitable modification of voltage/frequency related to each server.
Both [13, 23] used greedy term to enhance consumption of cooling power. This term refers to making only conditioning chassis that have maximum occupancy factor (i.e., maximum number of servers standing in front of chassis) to be turned on, and no new chassis will be turned on. So, the probability of making these chassis turn off is higher when a job with low workload is coming. Depending on cooling fan model CFM, Ayoub and others provided a new approach in this field [20]. Their approach consists of two phases. First, publishing phase which means publishing virtual machines VMs over physical machines PMs to achieve power density balancing and minimizing both sockets temperatures and fan speed. Second, refinement phase which aims to decrease the cooling costs depending on focusing the workload on a small set of fans ( that have the highest speed ), this is achieved by mixing more hot workload with the sockets linking to these fans.
.
3. DATACENTERDESCRIPTION
In this section we will describe the data center structure we trend to deal with. As it is shown in figure 1, four rows are involved within this data center, each row is divided into five racks, four nodes are located in each rack, ten servers are arranged in each node, and each server has two processors. The cold air is generated by CRAC unit and coming from the floor. For the racks, it is arranged so that the entrances are in front of each other and exits are the same where hot air is
[image:4.612.325.510.105.227.2]located. As a result, cold and hot corridors will be formed.
Figure 1: . Data center structure.
4. PROPOSED SYSTEM MODEL
In this section we presented our proposed approaches that deal with both allocation processors and cooling costs. We will start to describe the data center from tours-based network topology, followed by proposed algorithm that allow to avoid fragmentation depending on jobs sizes, then we will present thermal data center model with corresponding proposed approach to decrease the cooling cost.
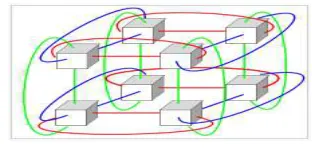
[image:4.612.338.494.544.627.2]4.1 Data Center Connecting Network Topology A torus communication is a network topology for linking the processors contained in nodes in a parallel computer model. It can be presented as a mesh where nodes are arranged in an array of N = 2, 3, or more dimensions, with processors connected to their nearest ones. The lattice has the topology of an N dimensional torus and each node has 2N connections [24]. Since number of supercomputers on the TOP500 list use three-dimensional torus networks, we will use this model. Figure below illustrates this topology.
Figure 2 : Used network topology (torus).
ISSN: 1992-8645 www.jatit.org E-ISSN: 1817-3195
Discontiguous processors allocation approaches lead to external fragmentation. This is because of roaring in nodes itself (i.e., assigning additional nodes that what is needed for an executing job in a data center).
In the light of previous facts, our proposed approach try to decrease both internal and external fragmentation in a data center.
[image:5.612.315.521.74.216.2]4.2 Proposed Allocation Approach (SJSS) in this paper, a same_job_size_scheduler (SJSS) algorithm is proposed. To explain how this algorithm works, we will provide the following scenario: given four jobs arranged in the following table. It describes the numbers of nodes assigned to these jobs comparing the actual needed nodes number. We can notice that we have 8 extra nodes and our aim is to exploit these extra nodes.
Table 1 : Jobs description.
Job name
Actual needed Nodes Number
Assigned nodes Number
Additional nodes Number
A 5 7 2
B 7 9 2
C 9 11 2
D 12 14 2
Sum 33 41 8
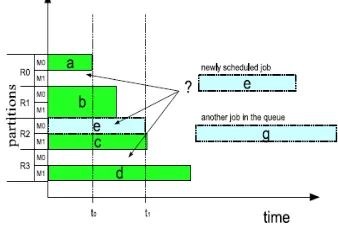
[image:5.612.90.300.320.440.2]Now, if we have incoming job E, we can distinguish between two cases. I) if the size equals to 8, then our allocator will assign it to the additional node number. II) if the size equal to 7 or 6, then our allocator will assign it these node also, where SJSS algorithm previously scheduled the jobs based on its sizes. Figure 3 illustrates this ides.
Figure 3: Scheduling jobs according its sizes.
Note that we can join others small jobs to match one big job size and occupy the extra nodes as it is shown below.
Figure : Joining jobs.
Thus, the corresponding algorithm will
be as shown in figure 5. After deciding
how to schedule the jobs, job distribution
will be done over cold spot created due to
air recirculation inside data center. This
leads to describe the data center layout and
how to model hot and cold spots.
4.3 Cooping System Model
[image:5.612.316.521.444.606.2]The layout of a data center will be presented in a three dimensions as it is shown below, where length, width, and height are presented by , , and axis respectively. A node will be located in position . The data center cool system is represented by figure 5.
Figure 5: Our proposed allocation algorithm.
(1) Where,
The thermal map of the data center is represented as follows:
[image:5.612.116.285.556.670.2]ISSN: 1992-8645 www.jatit.org E-ISSN: 1817-3195
where,
A node can be represented through,
(3) where,
Given a job, it will be represented as follows:
Where,
Our final aim is to make power consumption as low as possible. To end this, we will address power consumption from mathematical point of view followed by cold and hot spots created by recirculation phenomena besides the heat recirculation factor (HRF) related to it.
For power consumption, let refers to power consumption related to a node i. Then, the total power consumption related to all nosed is given by:
(5) The cooling power costs is given as [26]:
(6)
Where,
Based on [21], this coefficient is given by:
Note that (T) here refers to temperature of the supplied cold air. So, as high (T) as high in saving power consumption.
Based on (5,4) equations, we can define the total power consumed in the data center as follows:
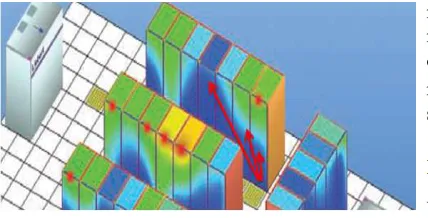
(7) For air circulation phenomena, it is caused for some reasons. In the data center, two main reasons lead to air recirculation. First, if no more cold air is coming from the floor, then the server will absorb the air from other resources, where it will be not cold enough due to passing some distances, like sides and the data center roof. Second, if conditioning unite cannot push the hot air out because of obstacles in front of cold air stream, thus
cold air will be mixed with hot air to generate this phenomena. The figure 6 shows real recirculation phenomena.
Figure 6 : Data center layout.
Figure 7: Real circulation phenomena.
Because of changing in air flow, caused by recirculation, clod and hot spots will be generated. We can formulate the heat carried by air flow as:
(8)
Where,
Because of air heat changing during passing the nodes, the formula below computes the relationship between power consumption in a node and input/output heat.
(9)
In other words, power consumption in a node
will cause air flow to pass within the given node to face power increasing in , and the temperature will be increased from to .
The air recirculation can be expressed through the following matrix:
(10)
ISSN: 1992-8645 www.jatit.org E-ISSN: 1817-3195
and re_cold to enter the neighboring node . As it is mentioned previously, hear recirculation factor is given by:
Where,
It is noticed that as increased (i.e., setting the temperature of the conditioning unite as high as
possible), will be decreased.
Thus
will be increased. As a result, HRF will be decreased. After modeling the cooling system, we will be ready to present our proposed approach to decrease the cooling cost in the data center.
4.4 Proposed Cooling Cost Approach
A hypird contiguous / discontiguous cooling cost (colder_spot_based ) approach is proposed to decrease the cooling cost of the data center described above. The key idea behind this approach is that after scheduling jobs according to their size by , will distribute the heavy jobs over the cold spots and the ordinary jobs will be assigned to the nodes that locate near the boundaries of these cold spots. The figure 8 describes the scenario of our approach.
For first phase of CBS approach involved in the figure 8, we can explain it through mathematical point of view according to formulas included in cooling system model sub section. We obtained the temperatures of every node entrance/exit ( , ), and conditioner temperature ( ). Using
formula (8), we can obtain ( )
to calculate HRF (11). Relying on HRF values, we can define cold and hot spots where low HRF value means hot spot and high HRF value means cold spot. After determining the cold spots, we can obtain the nodes involved in each cold spot, where we used ( ) for all nodes included within a cold spot to construct a job so that the list of ( ) represents ( ) included in (4). By subtracting we can calculate the value of
temperature which represents ( ) that will be added to ( ) to save power consumption in (3) which in turn represents the final stage in CBS approach.
Figure 8: Flowchart of proposed CBS approach.
5. SIMULATION
We implemented a simulation using c# language programing that deals with the data structure described in section 3. The simulation takes the jobs information from a file where the most important information here is job size and number of needed nodes estimated by an expert.
For jobs, we choose jobs that can be distributed relying on parallel manner. In depth, we used watermarking idea to hide KAU logo in the frames of some videos so that each video will be divided into the three main frames ( I, B, and P frames). Since we choose long videos we had thousands of frames for each kind of frames. Thus, we can assign each group to a one node to achieve parallel jobs. Table 2 provide a description about jobs involved in the simulation.
Table 2 : Used jobs description.
Job name
Video length
I frames number
B frames number
P frames number
Total number
Carton_1 120 M 20114 64057 30586 114757 Carton_2 100 M 18456 56481 22777 97714 Carton_3 14 M 3487 5777 4416 13680
Animal_4 22 M 5359 8549 7589 21497
Animal_5 88 M 21489 35550 28949 85988
Animal_6 45 M 8678 25421 9877 43971
Animal_7 70 M 17589 30939 19872 68400
ISSN: 1992-8645 www.jatit.org E-ISSN: 1817-3195
that, will select the free processors to be assigned to the jobs according to cold spots, where cold spots are previously defined according to HRF. To illustrates the temperatures distribution over the data center, we generated two figures, using Maltab, to show the distribution of cold and hot air in the data center followed by cold and hot spots. Figure 10 and 11 illustrate it respectively.
[image:8.612.316.542.195.309.2]The distribution of jobs will be according cold spots as it is shown in figure 11 which illustrates our general proposed idea, briefly.
[image:8.612.109.289.383.559.2]Figure 9: Temperatures distribution according HRF.
Figure 10: Cold and hot spots distribution.
Figure. 11. Our general proposed idea.
6. EVALUATION AND EXPERIMENTAL
RESULTS DISCUSSION
In this section, we made a comparison among approaches in [13, 8], and our proposed approach. To simplify the running methodology used in the approaches involved in comparison according to used nodes, we presented the figure below.
Figure 12 : Approaches used in comparison.
We used the seven jobs described above and run them separately on GPU, where we calculated the power consumption related to each active node and total cooling power consumed for each job that are presented in table 4 below.
6.1 Used Measurement with Communication Performance
For evaluating the first part (optimizing communication), we depend on calculating the number of active nodes under using during the period of scheduling (i.e., applying SJSS) utilizing LOC measurement [27] (loss of capacity) to quantify the fragmentation. In general, the performance of jobs suffer from LOC because of both waiting time to be under execution or idle nodes resultant due to parallel execution of the three kinds of frames during job execution. To explain it,
Given that denotes to the number of nodes included in the all cold spot to be assigned to a jobs, refers to the number of scheduled jobs ( note, it can be used at a one job level since we have many kinds of frames), that happens at the moment of receiving a new job. For ( ), refers to the number of idle nodes between scheduling and . then,
[image:8.612.100.314.599.708.2]
ISSN: 1992-8645 www.jatit.org E-ISSN: 1817-3195
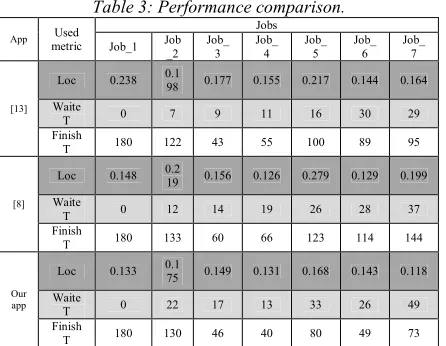
[image:9.612.316.522.187.475.2]In addition to the previous measurement, we used waiting time and finish time which needs execution time measurement. The table below shows our results.
Table 3: Performance comparison.
App Used
metric
Jobs Job_1 Job
_2 Job_
3 Job_
4 Job_
5 Job_
6 Job_
7
[13]
Loc 0.238 0.1
98 0.177 0.155 0.217 0.144 0.164 Waite
T 0 7 9 11 16 30 29 Finish
T 180 122 43 55 100 89 95
[8]
Loc 0.148 0.2
19 0.156 0.126 0.279 0.129 0.199 Waite
T 0 12 14 19 26 28 37 Finish
T 180 133 60 66 123 114 144
Our app
Loc 0.133 0.1
75 0.149 0.131 0.168 0.143 0.118 Waite
T 0 22 17 13 33 26 49 Finish
T 180 130 46 40 80 49 73
From table 3, under LOC measurement the range of LOC for cooling aware approach is between [0.144–0.238 ] which means that the range of idle or dissipated nodes is between [14.4 % - 23.8 %] and 19.1 % in average. This is because fragmentation done in cooling aware approach where it depends on contiguous allocation. Regarding to the curve allocation approach, the external fragmentation will be decreased according to LOC measurement which achieves the range between [12.6% – 21.9 %] dissipated nodes and 17.1 % in average. Using our SJSS algorithm included in our proposed approach, LOC values achieved the best rang within [11.8 % –17.5] in average of 14.65 % dissipated nodes. The reason behind this is that the previous approaches did not take in consideration scheduling incoming jobs under the same size. Figure 12 and 13 illustrates the results under waiting and finishing time respectively.
With a deep look on both figure 13 and figure 14 we can infer, although cooling aware and curve allocation approaches achieved (14.75 and 19.14) minute in average time against 22.85 for our propose approach, but the total performance, under finishing time, of our approach acts better where we achieved 85, 42 against 97.71 and 117.14 for cooling aware and curve allocation approaches respectively. This is because that our approach add another scheduling relate to the jobs themselves
where the other approaches uses only one scheduling for allocation, but because of decreasing number of idle nods, our total performance is better due to another parts of a job will be execute using the active nodes which are idle in the other approaches. Notice, in figure 13, that no waiting time is spend for the first job where no previous jobs are locate, thus no need for scheduling, while in figure 14 the first job in all approaches hits full values.
Figure 13 :Waiting time cost for jobs.
Figure 14 :Finish time cost for jobs.
6.2 Cooling Cost Performance
For cooling power, we defined the power consumption for each node according to equation (9). Using equation (5), we defined the power consumption related to cold spots involved in the data center, according to the seven jobs, then we obtained the cooling costs relying on equation (6). The table below provides the values according to the utilized jobs.
[image:9.612.85.308.188.361.2]ISSN: 1992-8645 www.jatit.org E-ISSN: 1817-3195
Table 4: Cooling costs for the jobs.
Job number
Job_1 6.784 67.84 10 Job_2 5.998 47.904 8 Job_3 3.4738 6.9476 2
Job_4 3.9 19.5 5
Job_5 4.231 29.617 7
Job_6 4.02 16.08 4
Job_7 3.87 23.22 6
Sum 42
Comparing to the approaches that are proposed in [13] and [17] our proposed approach achieved the best value under the save of power consumption where they achieved 8% and 13%. Comparing with free cooling approach [19], our approach has less value where free cooling approach achieves 25.7%. This is because free cooling approach depends on exploiting the nature (i.e., climate circumstances) where the temperatures are likely low all over the year.
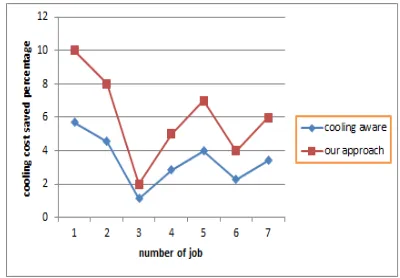
[image:10.612.89.304.73.234.2]Under the system usage term, we calculated the percentage of active nodes that are involved in our approach by the following formula (100 – number of idle nodes, which applied on table 3) and used the corresponding values for comparison with [13]. For [13], we calculated the cooling cost saving through multiplying its achieved value in saving of power (8%) by our achieved values of . The following curves illustrate the cooling power saved for the jobs and the number of active nodes according to the jobs, respectively , for our approach and that proposed in [13].
Figure. 15. cooling cost saved under system usage term.
It is clear that our approach achieved better performance against cooling aware. This is because cooling aware approach did not take in account the cold spots where the heavy jobs, in our approach,
are distributed on the coldest spots according to HRF.
Naturally in figure 16, according to LOC measurement our approach achieved higher performance. This is because the number of idle nodes is less against that involved in cooling aware approach.
Figure. 16.number of active nodes under system usage term.
7. CONCLUSION
We proposed an approach that aims to optimize the communication in a data center focusing on the size of the job itself and decreasing the cooling costs at the same time. For the first aspect, the final aim of proposed SJSS algorithm is to schedule the incoming jobs according to their sizes to avoid fragmentation and thus decreasing the jumps of messages will be naturally decreased. For the second aspect, we proposed a hybrid approach (CBS) that aims to distribute the jobs according to the cold spots generated by air circulation based on the values of HRF. We saved 14% of cooling power consumption comparing to other approaches.
REFRENCES:
[1] Keahey, Katarzyna, Peter Beckman, and James Ahrens. "Ligature: Component architecture for high performance applications." International Journal of High Performance Computing Applications 14.4 (2000): 347-356.
[2] Greenberg, Albert, et al. "VL2: a scalable and flexible data center network."ACM SIGCOMM computer communication review. Vol. 39. No. 4. ACM, 2009.
[image:10.612.98.298.517.656.2]ISSN: 1992-8645 www.jatit.org E-ISSN: 1817-3195
Proceedings. 2002 IEEE International Conference on. IEEE, 2002.
[4] Bruck, Jehoshua, et al. "Efficient algorithms for all-to-all communications in multiport message-passing systems." Parallel and Distributed Systems, IEEE Transactions on 8.11 (1997): 1143-1156.
[5] Mache, Jens, Virginia Lo, and Kurt Windisch. "Minimizing message-passing contention in fragmentation-free processor allocation." Proc. 10th Intern. Conf. Parallel and Distributed Computing Systems. 1997.
[6] Bender, Michael A., et al. "Communication-aware processor allocation for supercomputers: Finding point sets of small average distance." Algorithmica50.2 (2008): 279-298. [7] Bhattacharya, Sourav, and Wei-Tek Tsai.
"Lookahead processor allocation in
mesh-connected massively parallel
multicomputer." Parallel Processing Symposium, 1994. Proceedings., Eighth International. IEEE, 1994.
[8] Walker, Peter, D. Bunde, and V. Leung. "Faster high-quality processor allocation." Proc. 11th LCI Intern. Conf. High-Performance Clustered Computing. 2010. [9] Subramani, Vijay, et al. "Selective buddy
allocation for scheduling parallel jobs on clusters." Cluster Computing, 2002. Proceedings. 2002 IEEE International Conference on. IEEE, 2002.
[10] Chuang, Po-Jen, and Nian-FengTzeng. "An efficient submesh allocation strategy for mesh computer systems." Distributed Computing Systems, 1991., 11th International Conference on. IEEE, 1991.
[11] Reza, Akram, and MahnazRafie. "Performance Improvement in Multiprocessors using Two Row Boundary Allocation Method and Online
Dynamic Compaction
Algorithm." International Journal of Computer Applications 123.1 (2015).
[12] Wu, Linlin, and RajkumarBuyya. "Service level agreement (sla) in utility computing systems." IGI Global (2012).
[13] Sansottera, Andrea, and Paolo Cremonesi. "Cooling-aware workload placement with performance constraints." Performance Evaluation 68.11 (2011): 1232-1246.
[14] Koomey, Jonathan. "Growth in data center electricity use 2005 to 2010." A report by Analytical Press, completed at the request of The New York Times(2011).
[15] Moore, Justin D., et al. "Making Scheduling" Cool": Temperature-Aware Workload
Placement in Data Centers." USENIX annual technical conference, General Track. 2005. [16] Tang, Qinghui, Sandeep Kumar S. Gupta, and
GeorgiosVarsamopoulos. "Energy-efficient thermal-aware task scheduling for homogeneous high-performance computing data centers: A cyber-physical approach." Parallel and Distributed Systems, IEEE Transactions on 19.11 (2008): 1458-1472.
[17] Pakbaznia, Ehsan, and MassoudPedram. "Minimizing data center cooling and server power costs." Proceedings of the 2009 ACM/IEEE international symposium on Low power electronics and design. ACM, 2009. [18] Heath, Taliver, et al. "Mercury and freon:
temperature emulation and management for server systems." ACM SIGARCH Computer Architecture News. Vol. 34. No. 5. ACM, 2006.
[19] Kim, Jungsoo, Martino Ruggiero, and David Atienza. "Free cooling-aware dynamic power management for green datacenters." High Performance Computing and Simulation (HPCS), 2012 International Conference on. IEEE, 2012.
[20] Ayoub, Raid, ShervinSharifi, and TajanaSimunicRosing. "Gentlecool: Cooling aware proactive workload scheduling in multi-machine systems." Proceedings of the Conference on Design, Automation and Test in Europe. European Design and Automation Association, 2010.
[21] Keahey, Katarzyna, Peter Beckman, and James Ahrens. "Ligature: Component architecture for high performance applications." International Journal of High Performance Computing Applications 14.4 (2000): 347-356.
[22] Tang, Qinghui, Sandeep KS Gupta, and GeorgiosVarsamopoulos. "Thermal-aware task scheduling for data centers through minimizing heat recirculation."Cluster Computing, 2007 IEEE International Conference on. IEEE, 2007. [23] Pakbaznia, Ehsan, Mohammad Ghasemazar, and MassoudPedram. "Temperature-aware dynamic resource provisioning in a power-optimized datacenter." Proceedings of the Conference on Design, Automation and Test in Europe. European Design and Automation Association, 2010.
ISSN: 1992-8645 www.jatit.org E-ISSN: 1817-3195
[25] Johnstone, Mark S., and Paul R. Wilson. "The
memory fragmentation problem:
solved?." ACM SIGPLAN Notices. Vol. 34. No. 3. ACM, 1998.
[26] Moore, Justin D., et al. "Making Scheduling" Cool": Temperature-Aware Workload Placement in Data Centers." USENIX annual technical conference, General Track. 2005. [27] Y. Zhang, H. Franke, J. Moreira, and A.