WRL
Technical Note TN-57
Power Evaluation of
Itsy Version 2.3
tion in 1982. Our focus is information technology that is relevant to the technical strategy of the Corporation, and that has the potential to open new business opportunities. Research at WRL includes Internet protocol design and implementation, tools for binary optimization, hardware and software mechanisms to support scalable shared memory, graphics VLSI ICs, handheld computing, and more. Our tradition at WRL is to test our ideas by extensive software or hardware prototyping.
We publish the results of our work in a variety of journals, conferences, research reports, and technical notes. This document is a technical note. We use this form for rapid distribution of technical material. Usually this represents research in progress. Research reports are normally accounts of completed research and may include material from earlier technical notes.
You can retrieve research reports and technical notes via the World Wide Web at:
http://www.research.compaq.com/wrl/
You can request printed copies of research reports and technical notes, when available, by mailing your order to us at:
Technical Report Distribution
Compaq Western Research Laboratory 250 University Avenue
Palo Alto, California 94301 USA
You can also request reports and notes via electronic mail. For detailed instructions, put the word ‘‘Help’’ in the Subject line of your message, and mail it to:
Marc A. Viredaz Deborah A. Wallach
October 2000
Abstract
The Itsy pocket computer is a flexible research platform developed at Compaq Computer Corporation’s
Western Research Laboratory (WRL). The goal of this project is to enable hardware and software research in
handheld computing. Several versions of the Itsy system were designed and built. This document evaluates the power consumption of Itsy version 2.3.
Acknowledgements
Contents
Acknowledgements iv
Contents v
List of Figures vi
List of Tables vi
1 Introduction 1
2 Methodology 1
2.1 Experimental setup . . . 1
2.1.1 Average power . . . 2
2.1.2 Battery lifetime . . . 3
2.2 Errors in the average power measurements . . . 3
2.2.1 Hardware instrumentation errors . . . 4
2.2.2 Averaging error . . . 5
2.2.3 Software instrumentation error . . . 5
2.2.4 Combined average power error . . . 6
2.3 Errors in the battery lifetime measurements . . . 6
2.3.1 Timing error . . . 6
2.3.2 Software initialization error . . . 6
2.3.3 Software instrumentation error . . . 7
2.3.4 Combined battery lifetime error . . . 7
2.4 Experiment-to-experiment differences . . . 7
2.4.1 Base-level average power and average battery lifetime . . . 8
3 Benchmarks 8
4 Results 10
5 Conclusion 13
References 13
A List of symbols 14
B Average power approximation 15
C Multimeter configuration 16
List of Figures
1 Experimental setup for Itsy v2.3 power measurements . . . 1
2 Experiment timings . . . 3
List of Tables
1 Benchmark parameters . . . 92 Average power and average battery lifetime over all base-level experiments . . . 10
3 Comparison between sets of experiments . . . 12
4 Benchmark results : deep sleep . . . 17
5 Benchmark results : sleep . . . 18
6 Benchmark results : sleep, daughter-card (DC) . . . 18
7 Benchmark results : idle, 59 MHz, low voltage (LV) . . . 18
8 Benchmark results : idle, 59 MHz . . . 18
9 Benchmark results : idle, 133 MHz . . . 19
10 Benchmark results : idle, 206 MHz . . . 19
11 Benchmark results : WAV, 59 MHz . . . 19
12 Benchmark results : WAV, 206 MHz . . . 20
13 Benchmark results : DECtalk, 74 MHz, low voltage (LV) . . . 20
14 Benchmark results : DECtalk, 74 MHz . . . 20
15 Benchmark results : DECtalk, 206 MHz . . . 21
16 Benchmark results : dictation, daughter-card (DC), 206 MHz . . . 21
1
Introduction
The aim of the Itsy project is to develop flexible research platforms for pocket computing. Several revisions of Itsy version 1 were built between 1997 and 1999 [Vir98a, Vir98b]. Itsy version 2 is the result of a major redesign started in 1999. Of the version 2 Itsy units, Itsy v2.0 refers to the first mother-board
printed-circuit board (PCB) design, while Itsy v2.1 corresponds to an Itsy v2.0 modified to fix its bugs. A total of
five Itsy v2.0/v2.1 units have been built. Similarly, Itsy v2.2 refers to the next revision of the PCB, while Itsy v2.3 refers to a bug-fixed Itsy v2.2. Slightly more than 25 Itsy v2.2/v2.3 units have been built. Finally, the next revision, known as Itsy v2.4, is currently being manufactured. The Itsy v2 hardware and software have been described elsewhere [Bar00] and will not be presented in this document.
The purpose of this study is to accurately measure the battery lifetime of Itsy v2.3 under different loads, while continuously monitoring the power consumption. Since the power consumption of Itsy v2.4 in sleep mode has been improved, the sleep-mode results presented here should not be considered relevant to Itsy v2.4. All other results should be applicable to Itsy v2.4, as it is not expected that the power consumption will change significantly in idle and run modes.
2
Methodology
This section introduces the experimental setup used to measure the average power consumption and battery lifetime. An error analysis for this setup is then presented.
2.1 Experimental setup
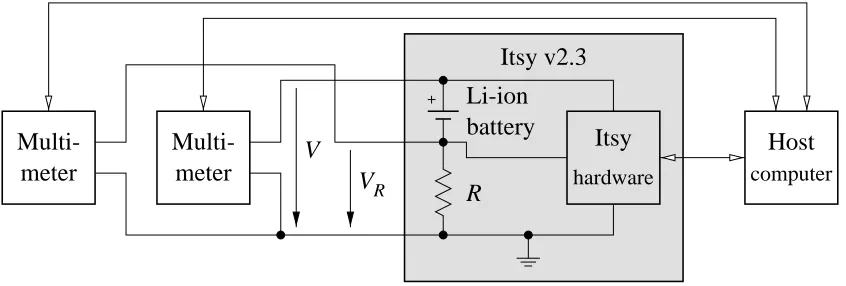
Figure 1 shows the experimental setup used for power measurements. The Itsy v2 system uses a 4.1 V prismatic Lithium-ion battery of size 48 mm×30 mm×6 mm, which is rated at 640 mA·h.
In series with the battery is a precision sense resistorR= 0.1Ω[IRC99] used by Itsy’s battery monitor [Dal00]. It can also be used by an external instrument, as in this study. Two external HP 34401A multimeters [HP96b, HP96a] monitor the battery voltage (V) and the voltage drop across the sense resistor (VR). Both the Itsy and the multimeters are connected to a host computer through RS-232 links.
Multi-meter
V
V
R
Host
computer
Li-ion
battery
R
Multi-
Itsy
hardware
meter
[image:7.612.96.519.521.664.2]Itsy v2.3
Both sides of the sense resistor are connected to the rest of the Itsy hardware. Since the connection on the negative pole of the battery is attached to both a high-impedance input and a filter capacitor, its leakage current is negligible (around 10 nA), but the voltageVRis subject to the battery monitor’s RC filter, whose time constant is 4.7 ms.
The setup used for sleep-mode experiments is exactly as shown in Figure 1. For all other experiments, a power supply is connected to the battery charging circuit through a relay. Another relay is used to reset the Itsy. By controlling both relays, the host computer can independently run a series of experiments, recharging the battery between experiments.1Since both relays are open during the actual experiments, this additional setup will not be further considered.
2.1.1 Average power
In this document, the term integration refers to a single voltage measurement made by a multimeter.2Both instruments are configured to performN integrations while calculating the average voltage and keeping track of the minimum and maximum values. Once theseN integrations have been completed, the valuesVavg, a, Vmin, a,Vmax, a,VRavg, a,VRmin, a, andVRmax, aare down-loaded to the host computer. This collection of val-ues is referred to as an acquisition. The host computer also records the start and end timeststart, aandtend, a of each acquisitiona.
The integration time has been chosen astint= 60 Hz0.2 = 3.33 ms. The multimeters are configured to form a 3.33 ms zero adjustment before each 3.33 ms integration. This zero adjustment — an integration per-formed with the input disconnected — allows the instrument to compensate for any charge accumulations or other forms of internal drift. Therefore, the approximate duration of an acquisition is :
tacq, a = tstart, a+1−tstart, a ≈ 2·N ·tint (1)
The number of integrations has been empirically chosen asN = 4150 for run-mode experiments, and as N = 42000 for sleep-mode and idle-mode experiments, to result in acquisition times of tacq, a≈30 s and tacq, a≈5 min., respectively. The values predicted by Equation (1) are 7 % – 8 % smaller than these figures, due to up-load and down-load time and the internal overhead of the multimeters.
From Ohm’s law, the battery currentIis equal toVR/R, allowing the average, minimum, and maximum currentsIavg, a,Imin, a, andImax, ato be calculated. Thus, for each acquisitiona, an approximationPeavg, aof
the average powerPavg, ais :
e
Pavg, a = Vavg, a·Iavg, a (2)
while upper and lower bounds on the power are :
Plow bnd, a = Vmin, a·Imin, a (3) Pup bnd, a = Vmax, a·Imax, a (4)
1
Unlike other experiments, which are performed under the Linux operating system, sleep-mode experiments run directly on the hardware and must be manually started.
2
4 a = 5 a = M–2 a = M–1 a = M a = M+1 a = M+2
System start
Char. Char. Char.
6
a =
Char. Char.
a = 2
Benchmark start tacq,1 tres System failure
tres/ 2
a =
start,1
t
start, +1
t M –
0
batt
t tinit
[image:9.612.71.541.111.208.2]a = 1 a = 3 a =
Figure 2: Experiment timings.
Finally, the average powerPavgover the battery lifetime is the weighted mean of all the acquisitions :
Pavg = M
X
a=1
tacq, a·Pavg, a
M
X
a=1 tacq, a
= M
X
a=1
tacq, a·Pavg, a
tstart, M+1−tstart,1 ≈ M
X
a=1
tacq, a·Peavg, a
tstart, M+1−tstart,1
(5)
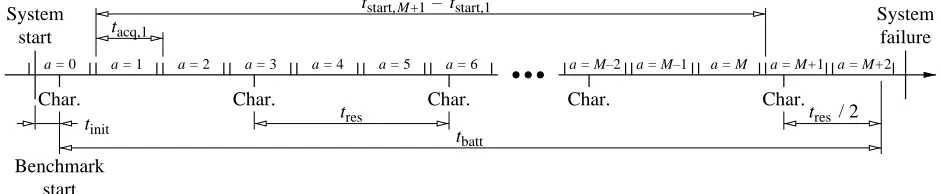
whereM is the number of “meaningful” acquisitions. Because of the experiment initialization overhead, the first acquisition, referred to asa= 0, is discarded. Since the battery lifetime does usually not correspond to an integer number of acquisitions, only acquisitions that are guaranteed to be completely within the battery lifetime are kept. This is illustrated in Figure 2.
2.1.2 Battery lifetime
At regular intervalstres, the Itsy sends a string of two characters (i.e., a character followed by a new line) to the host computer. The experiment is considered finished when the characters are no longer received by the host, the Itsy has entered sleep mode due to a battery fault, or the Itsy has crashed.3
The resolution interval tres represents a tradeoff between the overhead to send characters (see Sec-tion 2.2.3) and the resoluSec-tion to which the battery lifetime is measured (see SecSec-tion 2.3.1). It is chosen separately for each experiment. In order to make the associated error symmetric, the battery lifetimetbattis defined as the time between the beginning of the benchmark and the last string of characters sent plus half of the resolution time (i.e.,tres/2), as shown in Figure 2.
2.2 Errors in the average power measurements
The goal of this section is to find an upper bound on the error εPavg on the average power Pavg. In the
following analysis, all errors are expressed as relative errors, represented by the symbolε. When absolute errors are needed, the relative error is simply multiplied by its associated value. This section considers only possible errors made during a particular experiment on a particular unit. Measurement-to-measurement and system-to-system differences are discussed in Section 2.4. All potentially important sources of errors are analyzed and the significant terms are kept in the final combined errorεPavg.
3
2.2.1 Hardware instrumentation errors
The tolerance of the sense resistorRisεR= 1 % [IRC99]. The PCB has been routed such that the test points are connected directly to the resistor’s pad, opposite the main current path, to avoid measuring any voltage drop due to the resistivity of the main-current traces.
Although the multimeters are set on auto-range (see Appendix C), the 10 V range is always used to measure the battery voltageV and the 100 mV range is always used to measure the sense resistor voltageVR. According to the user’s manual [HP96b], the relative errors on these measurements are :
εV = 50µV
V + 0.0035 % (6)
εVR =
3.5µV VR
+ 0.0050 % (7)
Because the absolute error of an average is the average of the individual absolute errors, it can easily be seen that the same formulae also apply to the relative errors for the average voltages :
εVavg, a = 1 N ·
N
X
i=1
50µV
Vi + 0.0035 %
·Vi
Vavg, a
=
50µV + 0.0035 %· 1 N ·
N
X
i=1 Vi
Vavg, a
= 50µV Vavg, a
+ 0.0035 % (8)
similarly :
εVRavg, a =
3.5µV VRavg, a
+ 0.0050 % (9)
In practice, the battery-voltage errorεVavg, a is negligible, since it is always smaller than 0.006 %. On the other hand, the resistor-voltage error εVRavg, a is important at low power, particularly in deep-sleep mode, where it is around 2.5 %.
It can be seen that the value of the sense resistor is a compromise between accuracy at low currents and wasted power at high currents. It would have been possible to change the value of the sense resistor depending on the benchmark (i.e., use a higher resistance for low-power benchmarks). However, for the sake of simplicity, it was considered preferable to keep the resistor provided by the Itsy hardware.
Current leakages through the multimeters are negligible, since the input impedance of the multimeters, as configured (see Appendix C), is greater than 10 GΩfor the 100 mV to 10 V ranges [HP96b].
2.2.2 Averaging error
As mentioned in Section 2.1.1, only an approximationPeavg, a of the average powerPavg, acan be calculated
for each acquisitiona. However, it is possible to find an upper bound on the difference between these two figures. It can be shown (see Appendix B) that :
e
Pavg, a = Pavg, a+ N−1
X
i=1
N
X
j=i+1
(Vi−Vj)·(Ij−Ii)
N2 (10)
Since the double summation in Equation (10) hasN ·(N −1)/2 terms, this difference can be bounded by :
Peavg, a−Pavg, a ≤
N −1
2·N ·(Vmax, a−Vmin, a)·(Imax, a−Imin, a) (11) Therefore, the relative error of using the approximationPeavg, a instead of the average power Pavg, a is at
most :
εavg, a = 1
e
Pavg, a
·N−1
2·N ·(Vmax, a−Vmin, a)·(Imax, a−Imin, a) (12) 2.2.3 Software instrumentation error
As mentioned in Section 2.1.2, a string of two characters is sent at regular intervalstres. Experiments have shown that the host computer does not always receive the first characters correctly if the bit rate is too high. Therefore, the highest speed at which no character is ever lost is used : 19200 bit/s (8-bit data, no parity, 1 start bit, 1 stop bit). Hence, the time to send the string of characters is : 2·19200(8+2) = 1.04 ms.
In the sleep-mode experiments, the processor must exit sleep mode, re-initialize the hardware, send the string of characters, and re-enter sleep mode. According to the StrongARM SA-1100 manual [Int99] it takes approximately 160 ms to exit sleep mode (10 ms for the power to ramp up and 150 ms for the oscillator to stabilize) and 150µs to enter it. The initialization software then takes about 1 ms. Thus, approximately 160 ms is required for the complete operation.4
Differential measurements on a single system have shown that the additional energy to execute this operation is about 13 – 14 mJ, which has been rounded toEchar= 20 mJ to account for possible variations.5 In deep-sleep mode, the hardware initialization takes more time and power and the cost to send a string of character has been measured at about 23 mJ, rounded to Echar= 30 mJ. For idle-mode and run-mode experiments, similar differential measurements under the Linux operating system have shown that the cost of sending this string of characters is 40 – 65 mJ, rounded toEchar= 80 mJ. The relative error on the average powerPavgdue to this instrumentation is equal to :
εchar, Pavg =
1 Pavg ·
t
batt tres
−1
·Echar
tstart, M+1−tstart,1
(13)
4Actual measurements on a single system have shown about 156.4 ms to exit sleep mode and 158.6 ms for the complete
opera-tion.
5
It should be stressed that this overhead is always conservative, since it increases the power consumed during the experiment.
2.2.4 Combined average power error
The final step of the error analysis is to combine all sources of errors. Ignoring second-order effects, the rel-ative error of a product is the sum of the individual relrel-ative errors. Likewise, when the error on a given value comes from several sources, the relative errors should be added. Therefore, based on the sense resistor’s tolerance and on Equations (8), (9), and (12), the error on the average powerPeavg, a for each acquisitiona
is :
ε
e
Pavg, a ≈ εR+εVavg, a +εVRavg, a+εavg, a (14) The next step is to find the error on the weighted average of all Peavg, a terms (note that the absolute error
of a weighted average is the weighted average of the individual absolute errors). Finally, the result of Equation (13) must be added to calculate the total error on the average powerPavg:
εPavg ≈
1 Pavg ·
M
X
a=1
tacq, a·ε
e
Pavg, a·Peavg, a tstart, M+1−tstart,1
+εchar, Pavg (15)
2.3 Errors in the battery lifetime measurements
This section presents a similar error analysis, aimed at finding an upper bound on the error εtbatt on the
battery lifetimetbatt.
2.3.1 Timing error
As mentioned in Section 2.1.2, the resolution at which the battery lifetimetbattis measured is the intervaltres between strings of characters sent to the host computer. The corresponding relative error is therefore :
εres = 1 tbatt ·
tres
2 (16)
Given that the resolution intervaltresis between 90 s and 1 hour, the precision of the host computer’s clock is negligible.
2.3.2 Software initialization error
(see Section 2.1.2). The energy spent during the initialization can be bounded by measuring or estimat-ing an upper bound on the initialization timetinit and multiplying it by the power upper bound of the first acquisition (Pup bnd,0). Thus, the relative error due to the initialization overhead is :
εinit = 1 tbatt ·
tinit·Pup bnd,0 Pavg
(17)
2.3.3 Software instrumentation error
The fact that a string of characters is sent at regular intervals to the host computer (see Section 2.1.2) also introduces an error on the battery lifetimetbatt. This error is derived in a similar way as the corresponding error on the average power (see Section 2.2.3). In the case of the battery lifetime, the duration to be consid-ered istbattrather thantstart, M+1−tstart,1. Therefore, one more character string is sent, as shown in Figure 2. Note that the first character string is already accounted by the initialization errorεinit(see Section 2.3.2), and should not be counted. Therefore, the relative error on the battery lifetimetbattdue to this instrumentation is equal to :
εchar, tbatt =
1 tbatt ·
t
batt tres
·Echar
Pavg
(18)
2.3.4 Combined battery lifetime error
The combined error on the battery lifetimetbattis simply the sum of Equations (16), (17), and (18) :
εtbatt ≈ εinit+εres+εchar, tbatt (19)
2.4 Experiment-to-experiment differences
The analysis presented in Sections 2.2 and 2.3 evaluates the error on a single experiment. However, the result of similar experiments will differ among different units and even among measurements using the same unit. These differences could be evaluated by statistical analysis. However, since only slightly more than 25 Itsy v2.3 units have been built, and because of the length of time required to execute the complete benchmark suite (about 7 weeks, including battery recharging), only a small number of experiments (i.e., as many as possible given the available time and test equipment) have been run and a formal statistical analysis has not been conducted.
Regarding measurement-to-measurement differences (on the same unit), one important factor is battery aging. In order to minimize this influence, all batteries used in this study had never been used before.6 Therefore, the results presented here are relevant for new batteries. Battery lifetime is expected to decrease as the battery is being used. Based on the manufacturer’s data, prismatic Lithium-ion cells typically retain 70 % – 90 % of their initial capacity after 500 low-current charge/discharge cycles.
The benchmark suite was executed twice on one of the Itsy-battery pairs to get an idea of measurement-to-measurement differences. This provided a hint of the impact of aging from a new battery to a slightly used battery (11 full charge/discharge cycles). No experiments were performed using older batteries.
2.4.1 Base-level average power and average battery lifetime
Section 4 presents the reported average power Pavgbase and average battery lifetime tbasebatt, over all base-level experiments. These are simply the arithmetic means of the average powerPavgand battery lifetimetbasebatt for the corresponding set of experiments. Their respective relative errors have been conservatively calculated to include all of the individual error ranges :
εPbase avg =
1
Pavgbase ·max
Pavgbase−min x
1−εPx
avg
·Pavgx , max x
1 +εPx
avg
·Pavgx −Pavgbase (20)
εtbase batt =
1
tbasebatt ·max
tbasebatt −min x
1−εtx
batt
·txbatt, max x
1 +εtx
batt
·txbatt−tbasebatt (21)
wherexis the experiment index.
3
Benchmarks
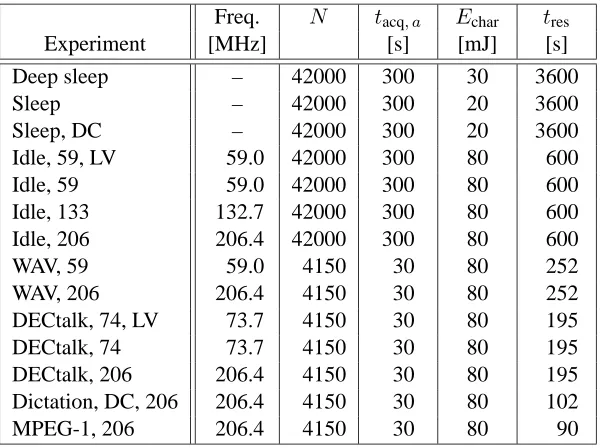
This section describes the workload used for the power experiments. All benchmarks were executed on an Itsy without a daughter-card, except when otherwise specified. All idle-mode and run-mode experiments were run under the Linux operating system, with the serial interfaces (USB, RS-232, infrared, etc.) disabled, the audio disabled when unused, and the other I/O devices (LCD, touch screen, etc.) left enabled. This con-figuration simulates a system as typically used when not connected to a host computer. In all experiments, the RS-232 interface is only enabled during the short period of time when the processor sends a string of characters (see Section 2.1.2). Table 1 shows the parameters used for all benchmarks.
The following benchmarks were used :
Deep sleep
In this benchmark, the processor is in sleep mode with the oscillator disabled [Int99], the DRAM is unpowered, the flash memory is in standby mode, and all I/O devices (serial interfaces, LCD, audio, etc.) are disabled. When the processor exits sleep mode to send a string of characters, it is clocked at 206.4 MHz.
Sleep
In this benchmark, the processor is in sleep mode with the oscillator disabled [Int99], the DRAM
6
Freq. N tacq, a Echar tres
Experiment [MHz] [s] [mJ] [s]
Deep sleep – 42000 300 30 3600
Sleep – 42000 300 20 3600
Sleep, DC – 42000 300 20 3600
Idle, 59, LV 59.0 42000 300 80 600
Idle, 59 59.0 42000 300 80 600
Idle, 133 132.7 42000 300 80 600 Idle, 206 206.4 42000 300 80 600
WAV, 59 59.0 4150 30 80 252
WAV, 206 206.4 4150 30 80 252
DECtalk, 74, LV 73.7 4150 30 80 195
DECtalk, 74 73.7 4150 30 80 195
DECtalk, 206 206.4 4150 30 80 195 Dictation, DC, 206 206.4 4150 30 80 102
[image:15.612.157.457.107.331.2]MPEG-1, 206 206.4 4150 30 80 90
Table 1: Benchmark parameters.
is in self-refresh mode, the flash memory is in standby mode, and all I/O devices (serial interfaces, LCD, audio, etc.) are disabled. When the processor exits sleep mode to send a string of charac-ters, it is clocked at 206.4 MHz. This benchmark is executed both on an Itsy alone and on an Itsy with a memory-extension daughter-card (DC) providing an additional 32 Mbyte of flash memory and 32 Mbyte of DRAM.
Idle
In this benchmark, the Itsy is running the Linux operating system without a workload. Therefore, the processor is mostly in idle mode. This benchmark is run at 59.0 MHz, 132.7 MHz, and 206.4 MHz. At 59.0 MHz, it is executed both at the standard core voltage of 1.5 V and at a low voltage (LV) of 1.23 V.
WAV
In this benchmark, the Itsy is playing an audio file in WAV format, using a simple program specially written for Itsy. The file played is the audio track to the video file used in the MPEG experiment. The built-in speaker is used and the audio volume is set to the maximum possible (the speaker dissipates about 135 mW). This benchmark is run at 59.0 MHz and 206.4 MHz.
DECtalk
Num. Idle Pavgbase εPbase
avg t
base
batt εtbase batt
Experiment exp. time [mW] [h] ([days])
Deep sleep 3 – 5.41 9.2 % 429.5 (17.9) 1.5 %
Sleep 3 – 8.39 4.0 % 279.0 (11.6) 0.90 %
Sleep, DC 3 – 11.6 2.9 % 203.0 (8.5) 1.5 %
Idle, 59, LV 5 95 % 55.6 5.7 % 41.5 2.1 %
Idle, 59 5 95 % 69.4 6.5 % 33.3 3.4 %
Idle, 133 5 95 % 82.4 7.5 % 28.0 3.0 %
Idle, 206 5 95 % 100 7.5 % 23.0 2.3 %
WAV, 59 5 83 % 280 3.2 % 7.92 2.9 %
WAV, 206 5 93 % 311 3.7 % 7.08 3.0 %
DECtalk, 74, LV 5 <1 % 354 3.0 % 6.24 3.2 %
DECtalk, 74 5 <1 % 397 3.0 % 5.53 3.6 %
DECtalk, 206 5 53 % 397 4.4 % 5.50 3.4 %
Dictation, DC, 206 5 <1 % 738 3.8 % 2.83 4.7 %
[image:16.612.108.505.108.335.2]MPEG-1, 206 5 16 % 822 7.7 % 2.51 5.3 %
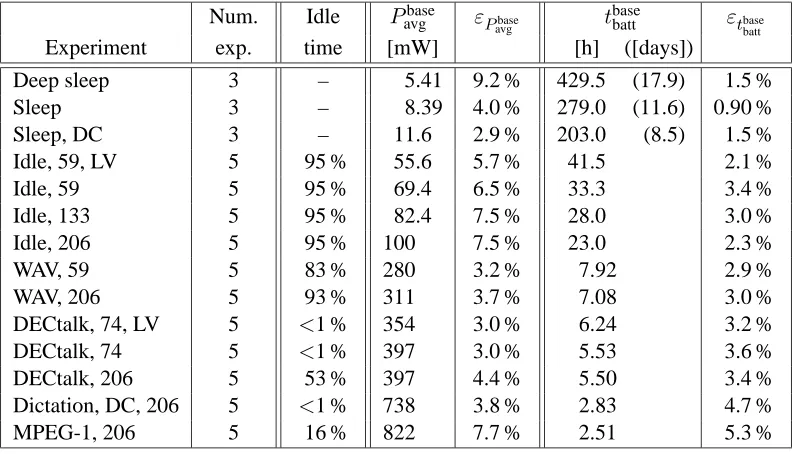
Table 2: Average power and average battery lifetime over all base-level experiments.
Dictation
In this benchmark, the Itsy is performing continuous-speech recognition (i.e., the translation of dicta-tion) on a prerecorded input file, using the Dragon NaturallySpeaking engine. The recognition engine runs about 2.4 times slower than real time. This benchmark is run at 206.4 MHz. This benchmark is executed on an Itsy with a memory-extension daughter-card (DC), providing an additional 32 Mbyte of flash memory and 32 Mbyte of DRAM.
MPEG-1
In this benchmark, the Itsy is playing a video file in MPEG-1 format, using a modified version of the open-sourceeasympegprogram andmpeg liblibraries. The audio is produced by playing an audio WAV file in a synchronized fashion, using the same program the WAV experiments use. The built-in speaker is used and the audio volume is set to the maximum (the speaker dissipates about 130 mW). This benchmark is run at 206.4 MHz.
4
Results
The first set of experiments was performed with new batteries. Sleep-mode experiments were run on 3 units while all other experiments were run on 5 units. The data from these experiments define a base-level set of results. A couple of variations were also tried. This section presents a summary and analysis of the results. The detailed average powerPavgand battery lifetimetbattnumbers for all experiments are reported in Appendix D.
average powerPbase
avg and the average battery lifetimetbasebatt over all base-level experiments (i.e., the first set of experiments on all Itsy units). The second column of Table 2 specifies how many experiments were used to calculate the average. The third column shows the idle time, as reported by the Linux operating system, for the corresponding benchmark. This number is not very precisely measured, but is presented to give a better sense of the corresponding workload.
As expected, putting the system into sleep mode dissipates the least power. Even with the significant delay required to exit sleep mode, it is clearly advantageous to put the system in sleep mode whenever possible. When the system is not in sleep mode, the clock frequency and core voltage greatly affect the power consumption, even when the system is mostly idle (as in the idle experiments).
The power of playing a WAV file in real time decreases significantly with the clock frequency. In this case, there is only a small amount of computation to be performed per time unit and the system is mostly idle. Therefore the gain from reduced clock frequency is almost the same as in idle mode. In fact about 2/3 of the power difference between the WAV benchmark and idle mode is used by the speaker. On the other hand, the DECtalk benchmark, which is also a real-time application, does not benefit from reducing the clock frequency. In this case the reduced power while computing at a low frequency is, at least partially, offset by the fact that there is no longer any idle time. Other factors, such as the energy cost of memory accesses, also play an important role. Ideally, this cost should be constant ; however, since memory-access timings are implemented as a multiple of the clock period and conservatively rounded up, memory accesses are less efficient (i.e., they last longer and, hence, use more energy) when the Itsy is running at a low frequency.
The Dictation experiment, a continuous speech recognizer, really stretches the Itsy’s capabilities. Be-cause the recognizer runs about 2.4 times slower than real time, and the battery lasts only 2.8 h, an Itsy can only support slightly more than an hour of actual dictation. The last benchmark, 16 frame-per-second MPEG-1 video with sound, is the most power hungry. Even at this high rate, the battery lasts for 2.5 h.
The global errors εPbase
avg and εtbasebatt reported in Table 2 are significantly higher than the individual
er-rorsεPavgandεtbattpresented in Appendix D. This is due to the way the global errors are calculated — defined
by Equations (20) and (21) — and reflects system-to-system differences.
The power errorεPavg for deep sleep is much higher than all other errors (see Tables 2 and 4). There are
two reasons for this. First, the voltage drop across the sense resistor is low with respect to the lowest range of the multimeter. Therefore, the corresponding errorεVRavg, a, given by see Equation (9), is around 2.5 %, which is higher than in all other cases. However, the most important term comes from the averaging er-rorεavg, a, derived in Equation (12). This error comes from the loose upper bound on the difference between the average powerPavg, aand its approximationPeavg, a, and is directly proportional to the difference between
the maximum and minimum battery currentsImax, aandImin, a. Each time that the Itsy exits sleep mode to send a string of characters, it re-powers its DRAM, resulting in a large current spike. For each acquisition taken while this is happening, the error termεavg, a rises to about 50 %, although the average powerPeavg, a
is hardly affected. For all other acquisitions, this term is about four orders of magnitude smaller. If these acquisitions are discarded, the combined errorεPavg on the average powerPavgdrops to about 3.6 % – 3.7 %,
which is probably much closer to the real error than the figures reported in Table 4 (although this can not be proven without redesigning the experiment). The same problem also applies to the sleep and idle bench-marks. The sleep errors are affected to a much smaller extent (the errorεPavg would drop by about 0.2 %).
1st& 2ndsets of exp. w/ & w/o batt. faults Experiment ∆Pavg ∆tbatt ∆Pavg ∆tbatt Idle, 59, LV 0.0 % 1.6 % −0.1 % −0.4 % Idle, 59 0.2 % 1.0 % 0.1 % −0.5 % Idle, 133 0.3 % 1.2 % 0.1 % −0.6 % Idle, 206 −0.1 % 1.5 % −0.3 % −0.0 %
WAV, 59 0.2 % 1.8 % 0.2 % −2.6 %
[image:18.612.152.462.107.288.2]WAV, 206 0.1 % 2.9 % 0.2 % −1.9 % DECtalk, 74, LV 0.0 % 2.6 % 0.0 % −1.7 % DECtalk, 74 −0.0 % 2.9 % −0.0 % −2.0 % DECtalk, 206 0.1 % 2.9 % 0.4 % −2.9 % Dictation, DC, 206 −0.2 % 2.0 % −0.2 % −2.0 % MPEG-1, 206 0.1 % 2.9 % 0.1 % −3.9 %
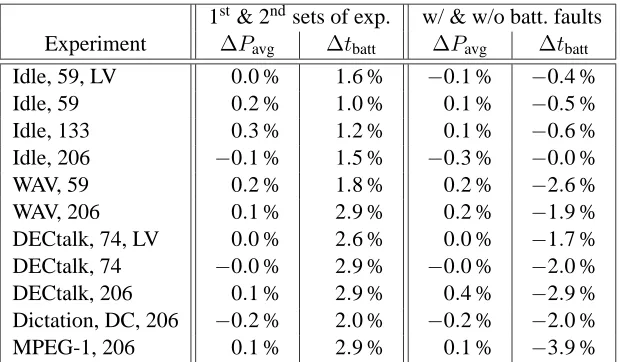
Table 3: Comparison between sets of experiments. The second and third columns present the differences between the first and second sets of experiments using Itsy no. 17 and battery no. 43. The fourth and fifth columns present the differences between the first set of experiments using Itsy no. 17 (battery faults enabled) and the set of experiments using Itsy no. 17 with the battery-fault mechanism disabled. All ratios are relative to the first set of experiments on Itsy no. 17.
hence, characters are sent more often.7
It is interesting to compare the two sets of experiments performed with the same Itsy-battery pair (Itsy no. 17 and battery no. 43). The values of the average powerPavg are very similar, with discrepancies of at most 0.3 %, as shown in Table 3 (the raw data is in Appendix D). This shows that the repeatability of the chosen methodology is fairly good. On the other hand, the values of the battery lifetimetbatt are always significantly lower in the second run by 1.0 %- 2.9 %. This shows that battery aging is an important factor, even with fairly new batteries.
Another two sets of experiments to compare are those performed with the same Itsy unit, once unmod-ified (the first set of experiments on Itsy no. 17, battery no. 43) and once with the hardware battery-fault mechanism disabled (Itsy no. 17, battery no. 41). In this case, these two sets were executed with different batteries to avoid discrepancies due to battery aging. However, battery-to-battery differences might have slightly affected the results. As shown in Table 3, the differences in the average powerPavg are again very small (less than 0.4 %). As expected, the battery lifetimetbattis always longer with battery faults disabled. However, in idle mode, the less than 0.6 % increase in lifetime is not significant. In run mode, a more im-portant increase of 1.7 % to 3.9 % is seen. This discrepancy can be explained by short-duration peaks of power which will result in a battery fault slightly before the battery is really exhausted. It should be stressed that operating without some (hardware or software) mechanism to detect a low battery is not an acceptable solution, since it is possible — and has been observed — that a process may die because of a power-related malfunction, leaving the rest of the system running for several more minutes. However, the rather low increase in battery lifetime shows that the Itsy’s battery-fault mechanism was well engineered.
7
5
Conclusion
To fulfill the Itsy project goals, sufficient processing power and memory capacity were needed to run next-generation applications and user interfaces, as well as sufficient battery lifetime to allow running realistic user interface experiments. This study shows that the power requirements of the Itsy version 2.3 meets these goals for a wide variety of scenarios.
The results presented in Section 4 show that the relationship between clock frequency and power is not intuitive and must be measured. This in turn implies that a good handheld system should have a way to assess its own power consumption, as the Itsy does. It is probably not necessary to have precise measurements. In fact, absolute measurements might not even be necessary : relative measurements might suffice. However, it is important not to forget that the goal of managing power on a battery-powered system is to reduce energy
consumption not power consumption. For all real-time applications (like most of the benchmarks used in
this study), both are equivalent, since their duration is by definition constant. This is not the case for other types of applications.
References
[Bar00] Joel F. Bartlett, Lawrence S. Brakmo, Keith I. Farkas, William R. Hamburgen, Timothy Mann, Marc A. Viredaz, Carl A. Waldspurger, and Deborah A. Wallach. The Itsy Pocket Computer. Research report 2000/6, WRL, Compaq, Palo Alto, CA (USA), October 2000.
[Dal00] Dallas Semiconductor, Dallas, TX (USA). DS2437 : Smart Battery Monitor, July 2000.
[HP96a] Hewlett-Packard. HP 34401A Multimeter : Service Guide, 4th edition, February 1996. Manual no. 34401-90013.
[HP96b] Hewlett-Packard. HP 34401A Multimeter : User’s Guide, 4th edition, February 1996. Manual no. 34401-90004.
[Int99] Intel. IntelR StrongARMR SA-1100 Microprocessor : Developer’s Manual, August 1999.
Docu-ment no. 278088-004.
[IRC99] IRC, Corpus Christi, TX (USA). Low Value Flat Chip Resistor : LRC/LRF Series, May 1999.
[Vir98a] Marc A. Viredaz. The Itsy Pocket Computer Version 1.5 : User’s Manual. Technical note TN-54, WRL, Compaq, Palo Alto, CA (USA), July 1998. Revision 1.0.
A
List of symbols
a Acquisition index.
Echar Additional energy required to send a string of two characters. I Battery current.
Iavg, a Average battery current during the acquisitiona. Ii,Ij Battery current during the multimeter integrationi,j. Imax, a Maximum battery current during the acquisitiona. Imin, a Minimum battery current during the acquisitiona.
M Number of acquisitions used to computePavg(i.e., “meaningful” acquisitions). N Number of multimeter integrations per acquisition.
Pavg,Pavgx Average battery power during an experiment, and during the experimentx. Pavg, a Average battery power during the acquisitiona.
e
Pavg, a Approximation of the average battery power during the acquisitiona. Pavgbase Average battery power over all base-level experiments.
Plow bnd Lower bound on the battery power during an experiment. Plow bnd, a Lower bound on the battery power during the acquisitiona. Pup bnd Upper bound on the battery power during an experiment. Pup bnd, a Upper bound on the battery power during the acquisitiona. R Resistance of the sense resistor.
tacq, a Duration of the acquisitiona(until the start of the acquisitiona+ 1). tbatt,txbatt Battery lifetime for an experiment, and for the experimentx.
tbase
batt Average battery lifetime over all base-level experiments. tend, a End time of the acquisitiona.
tinit Experiment initialization time. tint Duration of a multimeter integration. tres Resolution interval used to measuretbatt. tstart, a Start time of the acquisitiona.
V Battery voltage.
Vavg, a Average battery voltage during the acquisitiona. Vi,Vj Battery voltage during the multimeter integrationi,j. Vmax, a Maximum battery voltage during the acquisitiona. Vmin, a Minimum battery voltage during the acquisitiona. VR Voltage drop across the sense resistor.
VRavg, a Average voltage drop across the sense resistor during the acquisitiona. VR, i,VR, j Voltage drop across the sense resistor during the multimeter integrationi,j. VRmax, a Maximum voltage drop across the sense resistor during the acquisitiona. VRmin, a Minimum voltage drop across the sense resistor during the acquisitiona. x Experiment index.
εavg, a Relative error due to the use of the approximationPeavg, ainstead ofPavg, a.
εchar,X Relative error on symbol X (Pavgortbatt) due to the character strings sent at regular intervals. εinit Relative error ontbattdue to the initialization overhead.
B
Average power approximation
This appendix presents the development of the approximationPeavg, a of the average powerPavg, a, which is
used to establish Equation (10) :
e
Pavg, a = N X i=1 Vi N · N X j=1 Ij N = N X i=1 N X j=1 Vi·Ij
N2 =
N
X
i=1 Vi·Ii
N2 +
N X i=1 N X
j=1,j6=i Vi·Ij
N2 = N X i=1 Vi·Ii
N2 +(N −1)· N
X
i=1 Vi·Ii
N2 −(N−1)· N
X
i=1 Vi·Ii
N2 +
N X i=1 N X
j=1,j6=i Vi·Ij
N2
= N· N
X
i=1 Vi·Ii
N2 +
N
X
i=1
−(N −1)·Vi·Ii+
N
X
j=1,j6=i Vi·Ij
N2 = N X i=1 Vi·Ii
N + N X i=1 N X
j=1,j6=i
Vi·(Ij−Ii)
N2
= Pavg, a+ N X i=1 N X
j=1,j>i
Vi·(Ij−Ii)
+ N X i=1 N X
j=1,j<i
Vi·(Ij−Ii)
N2
= Pavg, a+ N X i=1 N X
j=1,j>i
Vi·(Ij−Ii)
+ N X i=1 N X
j=1,j>i
Vj·(Ii−Ij)
N2
= Pavg, a+ N X i=1 N X
j=1,j>i
Vi·(Ij−Ii)
− N X i=1 N X
j=1,j>i
Vj·(Ij−Ii)
N2
= Pavg, a+ N X i=1 N X
j=1,j>i
(Vi−Vj)·(Ij−Ii)
N2
= Pavg, a+ N−1 X i=1 N X
j=i+1
(Vi−Vj)·(Ij−Ii)
C
Multimeter configuration
The following listings are the commands used to configure the HP 34401A multimeters [HP96b]. The initial number selects the multimeter (0 forV and 1 forVR). The rest of the line is the actual command sent to the instrument, in Standard Commands for Programmable Instruments (SCPI) format. Commands are sent in listing order. The initialization section is sent once at the beginning of the experiment, while the acquisition section is sent for each acquisition.
Run-mode experiments Sleep-mode and idle-mode experiments
Initialization Initialization
0 SYSTEM :REMOTE 1 SYSTEM :REMOTE 0 *RST
1 *RST 0 *CLS 1 *CLS
0 DISPLAY :TEXT "ITSY TEST : V" 1 DISPLAY :TEXT "ITSY TEST : I" 0 SYSTEM :BEEPER :STATE OFF 1 SYSTEM :BEEPER :STATE OFF 0 *IDN ?
1 *IDN ?
0 SYSTEM :VERSION ? 0 FUNCTION "VOLTAGE :DC" 1 SYSTEM :VERSION ? 1 FUNCTION "VOLTAGE :DC" 0 VOLTAGE :DC :RANGE :AUTO ON 1 VOLTAGE :DC :RANGE :AUTO ON 0 VOLTAGE :DC :NPLCYCLES 0.2 1 VOLTAGE :DC :NPLCYCLES 0.2 0 ZERO :AUTO ON
1 ZERO :AUTO ON
0 INPUT :IMPEDANCE :AUTO ON 1 INPUT :IMPEDANCE :AUTO ON 0 CALCULATE :FUNCTION AVERAGE 1 CALCULATE :FUNCTION AVERAGE 0 DATA :FEED RDG_STORE, "" 1 DATA :FEED RDG_STORE, "" 0 TRIGGER :SOURCE IMMEDIATE 1 TRIGGER :SOURCE IMMEDIATE 0 TRIGGER :DELAY MINIMUM 1 TRIGGER :DELAY MINIMUM 0 TRIGGER :COUNT 1 1 TRIGGER :COUNT 1 0 SAMPLE :COUNT 4150 1 SAMPLE :COUNT 4150
0 SYSTEM :REMOTE 1 SYSTEM :REMOTE 0 *RST
1 *RST 0 *CLS 1 *CLS
0 DISPLAY :TEXT "ITSY TEST : V" 1 DISPLAY :TEXT "ITSY TEST : I" 0 SYSTEM :BEEPER :STATE OFF 1 SYSTEM :BEEPER :STATE OFF 0 *IDN ?
1 *IDN ?
0 SYSTEM :VERSION ? 0 FUNCTION "VOLTAGE :DC" 1 SYSTEM :VERSION ? 1 FUNCTION "VOLTAGE :DC" 0 VOLTAGE :DC :RANGE :AUTO ON 1 VOLTAGE :DC :RANGE :AUTO ON 0 VOLTAGE :DC :NPLCYCLES 0.2 1 VOLTAGE :DC :NPLCYCLES 0.2 0 ZERO :AUTO ON
1 ZERO :AUTO ON
0 INPUT :IMPEDANCE :AUTO ON 1 INPUT :IMPEDANCE :AUTO ON 0 CALCULATE :FUNCTION AVERAGE 1 CALCULATE :FUNCTION AVERAGE 0 DATA :FEED RDG_STORE, "" 1 DATA :FEED RDG_STORE, "" 0 TRIGGER :SOURCE IMMEDIATE 1 TRIGGER :SOURCE IMMEDIATE 0 TRIGGER :DELAY MINIMUM 1 TRIGGER :DELAY MINIMUM 0 TRIGGER :COUNT 1 1 TRIGGER :COUNT 1 0 SAMPLE :COUNT 42000 1 SAMPLE :COUNT 42000
Acquisition Acquisition
0 CALCULATE :STATE ON 1 CALCULATE :STATE ON
0 INITIATE ; CALCULATE :AVERAGE :AVERAGE ? 1 INITIATE ; CALCULATE :AVERAGE :AVERAGE ? 0 CALCULATE :AVERAGE :MINIMUM ?
0 CALCULATE :AVERAGE :MAXIMUM ? 0 CALCULATE :STATE OFF
1 CALCULATE :AVERAGE :MINIMUM ? 1 CALCULATE :AVERAGE :MAXIMUM ? 1 CALCULATE :STATE OFF
0 CALCULATE :STATE ON 1 CALCULATE :STATE ON
0 INITIATE ; CALCULATE :AVERAGE :AVERAGE ? 1 INITIATE ; CALCULATE :AVERAGE :AVERAGE ? 0 CALCULATE :AVERAGE :MINIMUM ?
0 CALCULATE :AVERAGE :MAXIMUM ? 0 CALCULATE :STATE OFF
D
Complete results
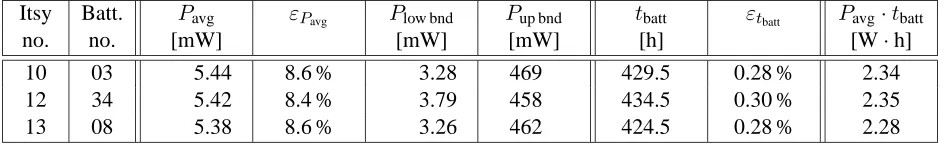
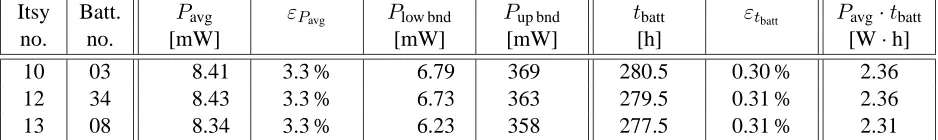
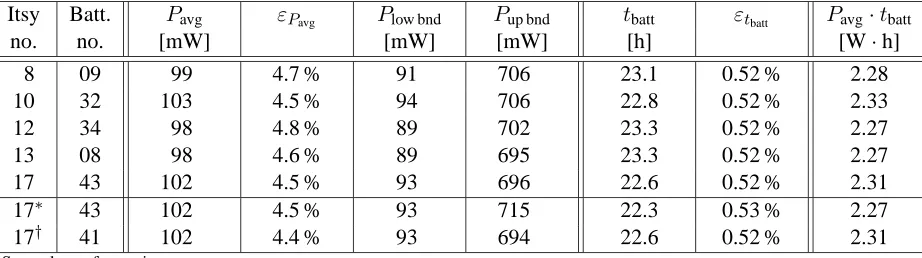
This appendix presents the average power Pavg, its lower and upper boundsPlow bnd andPup bnd, and the battery lifetimetbatt for all experiments. The productPavg·tbatt, representing the battery capacity, is also shown. This value is comparable to the manufacturer’s rating of 640 mA·h. As expected, low-power experiments (i.e., sleep-mode and idle-mode benchmarks) make a better use of the battery capacity than high-power experiments (i.e., run-mode benchmarks).
The sleep-mode benchmarks were always executed in the following order :
1. Deep sleep.
2. Sleep.
3. Sleep, daughter-card (DC).
Similarly, the idle-mode and run-mode benchmarks were always executed in the following order :
1. MPEG-1, 206 MHz.
2. DECtalk, 74 MHz, low voltage (LV).
3. DECtalk, 74 MHz.
4. DECtalk, 206 MHz.
5. WAV, 59 MHz.
6. WAV, 206 MHz.
7. Idle, 59 MHz, low voltage (LV).
8. Idle, 59 MHz.
9. Idle, 133 MHz.
10. Idle, 206 MHz.
11. Dictation, daughter-card (DC), 206 MHz.
There are only two Itsy-battery pairs on which both sets of benchmarks were run. On Itsy no. 12 and battery no. 34, the sleep-mode benchmarks were executed before the idle-mode and run-mode benchmarks, while the opposite is true on Itsy no. 13 and battery no. 08.
Itsy Batt. Pavg εPavg Plow bnd Pup bnd tbatt εtbatt Pavg·tbatt
no. no. [mW] [mW] [mW] [h] [W·h]
10 03 5.44 8.6 % 3.28 469 429.5 0.28 % 2.34
12 34 5.42 8.4 % 3.79 458 434.5 0.30 % 2.35
[image:23.612.71.543.598.670.2]13 08 5.38 8.6 % 3.26 462 424.5 0.28 % 2.28
Itsy Batt. Pavg εPavg Plow bnd Pup bnd tbatt εtbatt Pavg·tbatt
no. no. [mW] [mW] [mW] [h] [W·h]
10 03 8.41 3.3 % 6.79 369 280.5 0.30 % 2.36
12 34 8.43 3.3 % 6.73 363 279.5 0.31 % 2.36
[image:24.612.72.541.115.185.2]13 08 8.34 3.3 % 6.23 358 277.5 0.31 % 2.31
Table 5: Benchmark results : sleep.
Itsy Batt. Pavg εPavg Plow bnd Pup bnd tbatt εtbatt Pavg·tbatt
no. no. [mW] [mW] [mW] [h] [W·h]
10 03 11.6 2.8 % 9.92 441 203.5 0.37 % 2.35
12 34 11.6 2.8 % 9.80 439 204.5 0.36 % 2.36
[image:24.612.72.542.225.299.2]13 08 11.6 2.8 % 9.89 433 201.5 0.65 % 2.33
Table 6: Benchmark results : sleep, daughter-card (DC).
Itsy Batt. Pavg εPavg Plow bnd Pup bnd tbatt εtbatt Pavg·tbatt
no. no. [mW] [mW] [mW] [h] [W·h]
8 09 55.7 3.2 % 49.6 376 41.3 0.45 % 2.30
10 32 56.9 3.2 % 51.1 380 41.1 0.45 % 2.34
12 34 54.4 3.3 % 48.6 372 42.0 0.46 % 2.28
13 08 54.2 3.2 % 48.5 366 42.1 0.46 % 2.28
17 43 56.9 3.2 % 50.7 371 40.8 0.45 % 2.32
17∗ 43 56.9 3.2 % 51.4 372 40.1 0.46 % 2.28
17† 41 57.0 3.1 % 49.4 372 41.0 0.45 % 2.33
∗Second set of experiments. †Battery-fault mechanism disabled.
Table 7: Benchmark results : idle, 59 MHz, low voltage (LV).
Itsy Batt. Pavg εPavg Plow bnd Pup bnd tbatt εtbatt Pavg·tbatt
no. no. [mW] [mW] [mW] [h] [W·h]
8 09 69.0 3.0 % 62.4 416 33.3 0.46 % 2.30
10 32 71.6 3.0 % 63.9 416 32.8 0.45 % 2.35
12 34 67.2 3.2 % 60.5 408 34.0 0.46 % 2.28
13 08 67.5 3.0 % 60.5 402 34.0 0.46 % 2.29
17 43 71.8 2.9 % 65.3 410 32.3 0.46 % 2.32
17∗ 43 71.7 3.0 % 64.2 409 32.0 0.46 % 2.29
17† 41 71.8 3.0 % 63.9 409 32.5 0.45 % 2.33
∗Second set of experiments. †Battery-fault mechanism disabled.
[image:24.612.72.543.337.466.2] [image:24.612.71.545.519.650.2]Itsy Batt. Pavg εPavg Plow bnd Pup bnd tbatt εtbatt Pavg·tbatt
no. no. [mW] [mW] [mW] [h] [W·h]
8 09 81.5 4.6 % 74.5 601 28.1 0.48 % 2.29
10 32 84.8 4.4 % 77.1 598 27.6 0.48 % 2.34
12 34 80.2 4.7 % 72.4 592 28.4 0.48 % 2.28
13 08 80.7 4.5 % 72.6 585 28.4 0.48 % 2.29
17 43 84.9 4.4 % 77.0 591 27.3 0.48 % 2.32
17∗ 43 84.7 4.5 % 77.4 589 26.9 0.49 % 2.28
17† 41 84.8 4.4 % 75.3 592 27.4 0.48 % 2.33
[image:25.612.71.542.119.251.2]∗Second set of experiments. †Battery-fault mechanism disabled.
Table 9: Benchmark results : idle, 133 MHz.
Itsy Batt. Pavg εPavg Plow bnd Pup bnd tbatt εtbatt Pavg·tbatt
no. no. [mW] [mW] [mW] [h] [W·h]
8 09 99 4.7 % 91 706 23.1 0.52 % 2.28
10 32 103 4.5 % 94 706 22.8 0.52 % 2.33
12 34 98 4.8 % 89 702 23.3 0.52 % 2.27
13 08 98 4.6 % 89 695 23.3 0.52 % 2.27
17 43 102 4.5 % 93 696 22.6 0.52 % 2.31
17∗ 43 102 4.5 % 93 715 22.3 0.53 % 2.27
17† 41 102 4.4 % 93 694 22.6 0.52 % 2.31
[image:25.612.77.538.317.446.2]∗Second set of experiments. †Battery-fault mechanism disabled.
Table 10: Benchmark results : idle, 206 MHz.
Itsy Batt. Pavg εPavg Plow bnd Pup bnd tbatt εtbatt Pavg·tbatt
no. no. [mW] [mW] [mW] [h] [W·h]
8 09 283 2.0 % 147 656 7.82 0.58 % 2.21
10 32 280 2.0 % 148 667 8.10 0.56 % 2.27
12 34 276 2.0 % 143 678 7.82 0.58 % 2.16
13 08 279 2.0 % 144 661 7.89 0.58 % 2.20
17 43 281 2.0 % 148 649 7.96 0.57 % 2.23
17∗ 43 280 2.0 % 147 662 7.82 0.58 % 2.19
17† 41 280 2.0 % 135 650 8.17 0.56 % 2.29
∗Second set of experiments. †Battery-fault mechanism disabled.
[image:25.612.77.538.513.641.2]Itsy Batt. Pavg εPavg Plow bnd Pup bnd tbatt εtbatt Pavg·tbatt
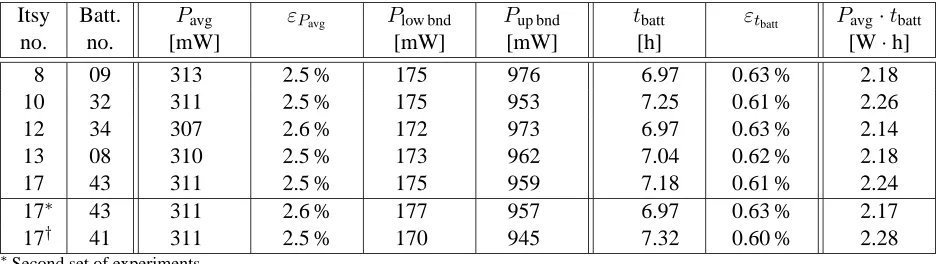
no. no. [mW] [mW] [mW] [h] [W·h]
8 09 313 2.5 % 175 976 6.97 0.63 % 2.18
10 32 311 2.5 % 175 953 7.25 0.61 % 2.26
12 34 307 2.6 % 172 973 6.97 0.63 % 2.14
13 08 310 2.5 % 173 962 7.04 0.62 % 2.18
17 43 311 2.5 % 175 959 7.18 0.61 % 2.24
17∗ 43 311 2.6 % 177 957 6.97 0.63 % 2.17
17† 41 311 2.5 % 170 945 7.32 0.60 % 2.28
[image:26.612.72.541.120.252.2]∗Second set of experiments. †Battery-fault mechanism disabled.
Table 12: Benchmark results : WAV, 206 MHz.
Itsy Batt. Pavg εPavg Plow bnd Pup bnd tbatt εtbatt Pavg·tbatt
no. no. [mW] [mW] [mW] [h] [W·h]
8 09 357 1.6 % 110 609 6.19 0.57 % 2.21
10 32 356 1.6 % 109 581 6.35 0.56 % 2.26
12 34 352 1.6 % 107 590 6.08 0.58 % 2.14
13 08 349 1.6 % 105 579 6.29 0.57 % 2.19
17 43 355 1.6 % 108 572 6.29 0.56 % 2.23
17∗ 43 355 1.6 % 110 577 6.13 0.58 % 2.17
17† 41 355 1.6 % 108 601 6.40 0.56 % 2.27
[image:26.612.71.541.315.448.2]∗Second set of experiments. †Battery-fault mechanism disabled.
Table 13: Benchmark results : DECtalk, 74 MHz, low voltage (LV).
Itsy Batt. Pavg εPavg Plow bnd Pup bnd tbatt εtbatt Pavg·tbatt
no. no. [mW] [mW] [mW] [h] [W·h]
8 09 400 1.5 % 124 647 5.47 0.62 % 2.19
10 32 400 1.5 % 123 653 5.64 0.60 % 2.26
12 34 395 1.5 % 120 648 5.37 0.63 % 2.12
13 08 391 1.5 % 120 632 5.58 0.61 % 2.18
17 43 398 1.5 % 125 641 5.58 0.61 % 2.22
17∗ 43 398 1.5 % 126 613 5.42 0.62 % 2.16
17† 41 398 1.5 % 124 626 5.69 0.60 % 2.27
∗Second set of experiments. †Battery-fault mechanism disabled.
[image:26.612.77.539.513.643.2]Itsy Batt. Pavg εPavg Plow bnd Pup bnd tbatt εtbatt Pavg·tbatt
no. no. [mW] [mW] [mW] [h] [W·h]
8 09 399 2.7 % 149 929 5.45 0.63 % 2.17
10 32 401 2.7 % 150 923 5.56 0.61 % 2.23
12 34 398 2.9 % 145 938 5.34 0.64 % 2.13
13 08 390 2.7 % 145 922 5.56 0.62 % 2.17
17 43 398 2.7 % 149 914 5.56 0.62 % 2.21
17∗ 43 398 2.8 % 151 954 5.40 0.63 % 2.15
17† 41 396 2.7 % 147 916 5.72 0.60 % 2.27
[image:27.612.71.543.119.251.2]∗Second set of experiments. †Battery-fault mechanism disabled.
Table 15: Benchmark results : DECtalk, 206 MHz.
Itsy Batt. Pavg εPavg Plow bnd Pup bnd tbatt εtbatt Pavg·tbatt
no. no. [mW] [mW] [mW] [h] [W·h]
8 09 735 2.8 % 98 1210 2.86 0.64 % 2.10
10 32 738 2.7 % 101 1210 2.92 0.63 % 2.15
12 34 745 2.8 % 95 1220 2.72 0.66 % 2.03
13 08 737 2.8 % 97 1190 2.81 0.65 % 2.07
17 43 737 2.8 % 102 1210 2.86 0.64 % 2.11
17∗ 43 738 2.8 % 101 1220 2.80 0.65 % 2.07
17† 41 739 2.8 % 100 1220 2.92 0.63 % 2.16
[image:27.612.71.541.315.448.2]∗Second set of experiments. †Battery-fault mechanism disabled.
Table 16: Benchmark results : dictation, daughter-card (DC), 206 MHz.
Itsy Batt. Pavg εPavg Plow bnd Pup bnd tbatt εtbatt Pavg·tbatt
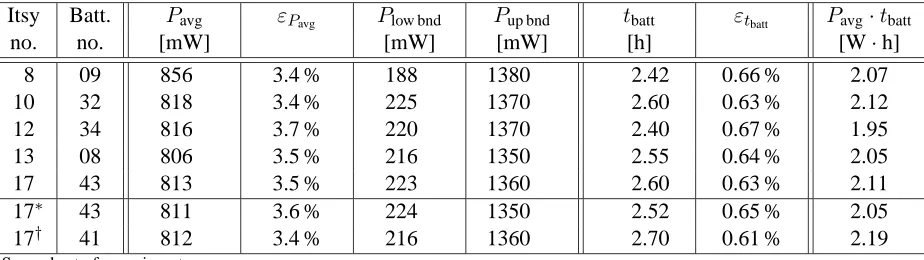
no. no. [mW] [mW] [mW] [h] [W·h]
8 09 856 3.4 % 188 1380 2.42 0.66 % 2.07
10 32 818 3.4 % 225 1370 2.60 0.63 % 2.12
12 34 816 3.7 % 220 1370 2.40 0.67 % 1.95
13 08 806 3.5 % 216 1350 2.55 0.64 % 2.05
17 43 813 3.5 % 223 1360 2.60 0.63 % 2.11
17∗ 43 811 3.6 % 224 1350 2.52 0.65 % 2.05
17† 41 812 3.4 % 216 1360 2.70 0.61 % 2.19
∗Second set of experiments. †Battery-fault mechanism disabled.
[image:27.612.77.539.513.643.2]