ISSN: 1992-8645 www.jatit.org E-ISSN: 1817-3195
INFLUENCES OF PARTS OF TREE ON PROPAGATION PATH
LOSSES FOR WSN DEPLOYMENT IN GREENHOUSE
ENVIRONMENTS
1
AUDA RAHEEMAH, 2NASEER SABRI, 3M.S.SALIM, 2PHAKLEN EHKAN, 4R. KAMARUDDIN, 2R. BADLISHAH AHMAD, 4M.N. JAAFAR, 2S. A. ALJUNID,
4M. H. CHEMAT
1, 2
School of Computer and Communication Engineering, University Malaysia Perlis (UniMAP)
1,3
Ministry Of Higher Education & Scientific Research Of Iraq, 1Al-Muthanna University, 3AlNahrain University
4
School of Bioprocess Engineering, University Malaysia Perlis (UniMAP) E-Mail: [email protected]
ABSTRACT
Radio waves Frequency (RF) propagating in vegetation environments usually facing much higher path loss than in environments those without vegetation. Therefore, well known of the propagation path loss through the vegetation area is critical for communication and sensing of Wireless sensor network (WSN) in such environments. Furthermore, the well known of the elevation of the antenna of the sensor nodes is very important for accurate measurement of the path losses in such environment. This paper presents the impact of each part of trees on WSN signal propagation inside the mango tree greenhouse to elect the appropriate elevation of the antennas. The empirical results show that the foliage affects is high and thus communication losses is higher while lowest losses obtained when nodes located within trunk elevation or less. Thus, the optimum antennas elevation must be within trunk level so that the reliable and higher network connectivity can be achieved.
Keywords: Path Loss, RF Propagation, Vegetation models, Wireless Sensor Network,
1. INTRODUCTION
Wireless sensor network applications are growing exponentially and one of the most promising applications is the precision agriculture (PA). PA is one of the interesting domains where WSNs could be exploited, for example, by observing the micro-climate within a field so that, ultimately, plant-specific farming can be realized. Agricultural application relies on the use of a new era of WSN to endorse monitoring and controlling management of a field based on site conditions (Naseer et al., 2011 ). WSNs offer a great flexibility when deploying new systems and when updating existing systems (Serodio et al., 2001 ).
Currently, the most promising of WSN technology in agricultural field is ZigBee (Zigbee., 2006, Camili et al., 2007). This protocol has been widely adopted by WSN developer’s community; it relies on the IEEE 802.15.4 standard (Lu et al., 2004 ). ZigBee technology is a low rate, low cost, low power consumption wireless node protocol aiming to remote and automation application systems. ZigBee is expected to provide low power and cost connectivity for nodes that need a long operation of battery of several years with low data
rate. The IEEE-ZigBee are expected to transmit over 10-75 meters based on the RF power output, consumption for a specific application in the environment and operates in the unlicensed RF worldwide 2.4 GHz with a 250 Kbps data rate. To determine the behavior of electromagnetic waves, a precise model of propagation must be adopted. However models normally used in wireless communication might not be precise describe the wireless sensor network. WSN nodes are spatially located, usually near the earth's surface, thus may induce absence of main ray between sender-receiver nodes, which is known of no line of sight (NLOS) status occur, although WSN nodes have spatially short distance distribution. Therefore, WSN propagation waves may face obstacle like trees, fence, building and dense foliage (Sabri et al., 2013).
ISSN: 1992-8645 www.jatit.org E-ISSN: 1817-3195 thus limit either the usable range or maximum data
rate of a wireless system. Therefore, well known of the propagation mechanisms through vegetation environments is critical for communication and sensing in such environments(Sabri et al., 2013).
Most of the published work in WSN adopts one of two simplistic path loss models: free space path loss (FSPL) and Two-Ray path (2-Ray) loss models (Otero et al., 2012), (Otero et al., 2009). Both of these models are based on simplistic approaches and are considered to be very optimistic in near ground propagation scenarios as the case in various outdoor applications of WSN
Otero et al., 2012).
Many researchers have studied the influences of foliage on attenuation (Karaliopoulos and Pavlidou., 1999), (Rogers et al., 2002), (Meng et al., 2009), (Vougioukas et al., 2013) and other researchers' studies the effects of tree canopies and trunks of tree on the RF propagation (Meng et al., 2010) , (Schubert et al., 2010). This work is part of a larger effort to determine the effects of parts of trees (leaves, branches, twigs, trunk and top of the tree) on the propagation path loss and confirm that the theoretical models (FSPL and 2-ray models) used to predict by the path loss is inaccurate to predict by the path loss in such environments.
2. BACKGROUND STUDY
2.1 Free Space (FSPL) Propagation Model The free space propagation model is used to predict received signal strength when the transmitter and receiver have a clear, unobstructed line of sight path between them (assumes the influence of the earth's surface to be entirely absent) (Rapport, 2002). The received power (PR) is given by the Friis Equation (Rapport, 2002) which represented by (1).
Where Pt, Pr are the transmitted and received power. Gut, Gr are the transmitter and receiver antenna gain respectively, and λ is the wavelength. The path loss is often expressed as a function of frequency (f), distance (d), and a scaling constant that contains all other factors of the formula. Equation (2) shows a free-space path loss in decibels (dB):
PLFSPL= - 27.56 + 20 log10(d) + 20 Log10(f)
(2)
Where f is the operating frequency (MHz) and d is the distance between transmitter and receiver antennas (meter).
2.2 Ground reflection (2-Ray) model
Ray tracing is a method that uses a geometric approach, and examines what paths the wireless radio signal takes from transmitter to receiver as if each path was a ray of light (possibly reflecting off surfaces). Ray-tracing predictions are good when detailed information about the area is available. But the predicted results may not be applicable to other locations, thus making these models site-specific. The received signal strength at a distance, d is predicted by (3) (Rapport, 2002) ,
Where ht and hr are the transmitter and receiver antenna heights, respectively. Path loss can be calculated by (4).
PL2-Ray = 40 Log10(d)-20 Log10 (ht) - Log10(hr)
(4)
3. MATERIALS AND METHODOLOGY
In order to determine the effects of leaves, twigs ,trunks and canopy of trees on the propagation behavior in a protected environment, the experiment was performed in a mango greenhouse located in Perlis in the north of Malaysia. The nodes used in this work consist of two modules of
Jennic wireless nodes (Sabri et al., 2012, Auda
Raheemah et al., 2015), one acts as coordinates (Receiver node) and the other acts as an end device (transmitter node) as shown in Figure-1. The output power of the device (Pt) is 0 dBm, the receiver sensitivity is -95 dBm, and the operation frequency is 2.425 GHz. It uses Omni-directional antenna. One wireless node was fixed (the coordinator node) and the other one was placed strategically along the plantation (the end-device). At each point, the coordinator requests a RSSI (Received Signal Strength Indicator) packet for the end-device. The data are collected and saved into a database for further analysis.The mango greenhouse composed of three lanes with 13 plants of Mango trees in each row. RF Transmitter module (Tx) is positioned in front of the first tree
in the row and at seven various heights of 0.5 m, 1.0 m, 1.5m, 2m, 2.5m, 3m and 3.5 m. The transceiver module (Rx) was located at the same
heights (i.e. Tx=Rx) for each individual tree.
(1)
ISSN: 1992-8645 www.jatit.org E-ISSN: 1817-3195 Received signal strength (RSS) is computed and
[image:3.612.112.530.543.705.2]used as an indicator for the propagation performance, RSSI yields a measure of the strength of the received signal power in dBm. To approximate the RSSI value within the receiver module, a 500 packets were transmitted by the transmitter at an RF data rate of 250 kbps. The receiving node was connected to a laptop, where all the RSSI readings were recorded directly. The mean value of all the RSSI measurements was reported in laptop and then used to calculate the total path loss.
Figure 1: Photography of WSN experimental set-up
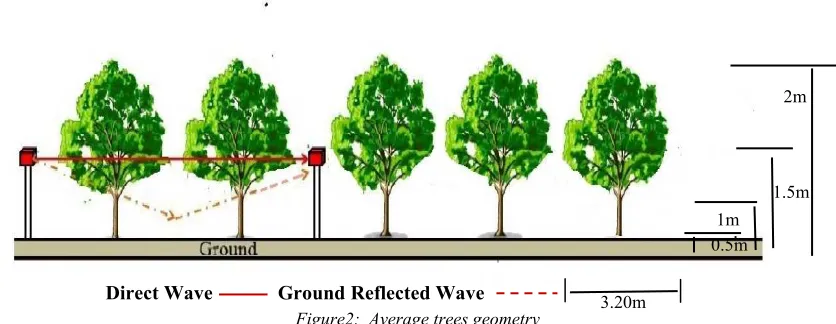
Direct Wave Ground Reflected Wave
2m
1.5m
1m 0.5m
ISSN: 1992-8645 www.jatit.org E-ISSN: 1817-3195
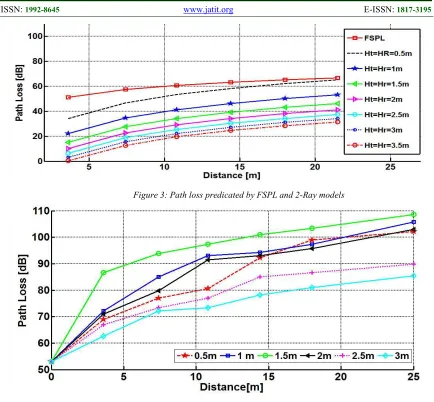
Figure 3: Path loss predicated by FSPL and 2-Ray models
Figure 4: Empirical Path Loss Measurements In Row Of Trees
Figure 5: Empirical Path Loss Measurements Without Vegetation Between Two
[image:4.612.155.499.491.680.2]ISSN: 1992-8645 www.jatit.org E-ISSN: 1817-3195 4. RESULTS AND DISCUSSION
The mean geometry of a row of trees inside mango greenhouse shown in Figure-2 where Tx
places in front of the first tree and at seven different heights (0.5m, 1m,1.5m, 2m, 2.5m, 3m, 3.5m). The Rx was placed at each individual tree at
the same heights.
Figure 3 illustrates the values of path losses those predicted by the most known theoretical models (FSPL and 2-Ray). Theoritical the values of path losses are degraded as the heights of transceivers increases. Although that the results shown in Figure-4 shows different values of path losses for each height of transceivers, this true due to present of vegetation within a propagation path.
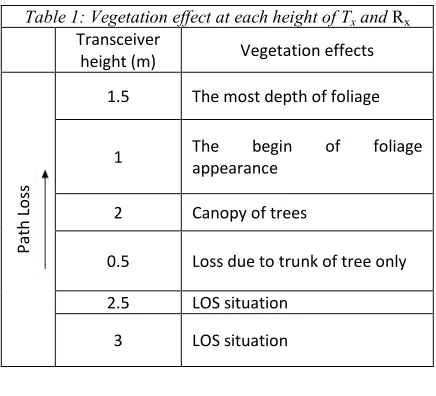
From Figure 4, the results show that the total path losses for heights between (0.5m – 2m) is increased in general due to vegetative existence. Contrarily, with the height above 2m and less 3.5m, the line of sight (LOS) situation almost exist and signal propagate with less attenuation. At 1.5m height of transceivers shows greatest path loss attenuation due to deepest vegetation depth found. Table 1 summaries the empirical path loss for different transceivers height in decreasing order with explain the reason of loss for each height. Figure-5 shows the plot of empirical measurements at various hights of trancivers between two lanes of trees with different distance (without vegetation).
5. CONCLUSIONS
This paper has presented RSS measurements inside the mango greenhouse and a comparison between the path loss that predicted by the most
known theoretical models (FSPL and 2-Ray) and path loss obtain by the actual measurements. This study shows the inaccurate of these models to predicting by the path losses in such environment.
The main aim of the study was to determine the effects of each part of trees on the signal strength received to pick the best elevation for antennas in greenhouse environment.
The results explain that the path loss induced by leaves of trees is the most path loss followed by the path losses due to canopy tree and lastly the path losses due to trunk of trees. Therefore, the best elevation of antennas where the nodes location are in trunk level.
REFERENCES
[1] Alsayyari, A., Kostanic, I., Otero, C., Almeer, M., & Rukieh, K. (2014). An empirical path loss model for wireless sensor network deployment in a sand terrain environment. In Internet of Things (WF-IoT), 2014 IEEE
World Forum on. IEEE, pp. 218-223.
[2] C. E. Otero, I. Kostanic and L. D. Otero. (2009). Development of a Simulator for Stochastic Deployment of Wireless Sensor Networks. Journal of Networks, 4(8), pp. 754-762.
[3] C. E. Otero, I. Kostanic, A. Peter, A. Ejnioui and L. D. Otero. (2012). Intelligent System for
Predicting Wireless Sensor Network
Performance in On - Demand Deployments.
In Open Systems (ICOS), 2012 IEEE
Conference on. IEEE, pp. 1-6.
[4] C. Serodio, J. B. Cunha, R. Morais, C. Couto, and J. Monteiro. (2001). A networked platform for agricultural management systems. Computers and Electronics in
Agriculture, 31(1), pp. 75–90.
[5] Camilli, C. E. Cugnasca, A. M. Saraiva, A. R. Hirakawa, and P. L. Correa. (2007). From wireless sensors to field mapping: Anatomy of an application for precision agriculture.
Computers and Electronics in Agriculture,
58(1), pp. 25–36.
[6] Lu, G., Krishnamachari, B., Raghavendra, C. S. (2004). Performance evaluation of the IEEE 802.15. 4 MAC for low-rate low-power wireless networks. In Performance,
Computing, and Communications, 2004
International Conference on IEEE, pp.
701-706.
[image:5.612.86.304.468.666.2][7] Karaliopoulos, M. S. and F. N. Pavlidou. (1999). Modelling the land mobile satellite
Table 1: Vegetation effect at each height of Tx and Rx
Transceiver
height (m) Vegetation effects
P a th L o ss
1.5 The most depth of foliage
1 The begin of foliage
appearance
2 Canopy of trees
0.5 Loss due to trunk of tree only
2.5 LOS situation
ISSN: 1992-8645 www.jatit.org E-ISSN: 1817-3195 channel: A review. IEEE Electron. Commun.
Eng. J., 11(5), pp.235-248.
[8] Meng, Y. S., Y. H. Lee, and B. C. Ng. (2009). Study of propagation loss prediction in forest environment. Progress In
Electromagnetics Research B(17),
pp.117-133.
[9] Meng, Yu Song, Yee Hui Lee, and Boon
Chong Ng.(2010). Path loss modeling for near-ground VHF radio-wave propagation through forests with tree-canopy reflection
effect. Progress In Electromagnetics Research
M(12), pp. 131-141.
[10]Naseer Sabri, S.A. Aljunid M.F. Malek, A.M. Badlishah, M.S. Salim, R. kamaruddin.(2011). Wireless Sensor Actor Networks.In Wireless Technology and Applications (ISWTA), 2011
IEEE Symposium on IEEE, pp. 90-95.
[11]Rogers, N. C., A. Seville, J. Richter, D. Ndzi, N. Savage, R. Caldeirinha, A. Shukla, M. O. Al-Nuaimi, K. H. Craig, E. Vi-lar, and J. Austin, (2002). A generic model of 1- 60 GHz radio propa- gation through vegetation. Tech.
Report, Radio communications Agency.UK
[12]Sabri, N., Aljunid, S.A., Ahmad, R.B., Malek, M.F.A., Kamaruddin, R., Salim, M.S. (2012). Wireless sensor network wave propagation in vegetation: Review and simulation. In
Antennas and Propagation Conference
(LAPC), 2012 Loughborough, on IEEE,
pp.1-4.
[13]Auda Raheemah , Naseer Sabri, Phaklen Ehkan, M.S.Salim, Omar Khaldoon A. (2015). Natural Grass Path Loss Modeling Based On Wireless Sensor Network Deployment. Journal of Theoretical and Applied Information Technology, Vol.(78). No.(3), pp. 406-414.
[14]Sabri, N., Aljunid, S. A., Salim, M. S., Kamaruddin, R., Ahmad, R. B., & Malek, M. F. (2013). Path Loss Analysis of WSN Wave Propagation in Vegetation. Journal of Physics (IOP), 423(1), pp.1-9.
[15]Schubert, F. M., Fleury, B. H., Robertson, P., Prieto-Cerdeirai, R., Steingass, A. & Lehner, A. (2010). Modeling of multipath propagation components caused by trees and forests. In Antennas and Propagation (EuCAP), 2010
Proceedings of the Fourth European
Conference on. IEEE,pp. 1-5 .
[16]Vougioukas, S Anastassiu, H. T., Regen, C., & Zude, M. (2013). Influence of foliage on radio path losses (PLs) for wireless sensor
network (WSN) planning in
orchards. Biosystems Engineering, 114(4), pp. 454-465.
[17]T. Rappaport. (2002). Wireless Communications: Principles and Practice. 2nd
ed., Upper Saddle River, N.J., Prentice Hall,
pp.69-74.
[18]ZigBee Alliance, ZigBee Specification, v1.0,