ISSN: 1992-8645 www.jatit.org E-ISSN: 1817-3195
SIMULATION OF THE APPLICATION ON WAVELET
FILTER IN STATIC SYNCHRONOUS COMPENSATOR
1REN GUOCAN, 2WANG SONGLIANG, 3SHAO HUA
1Ningbo City College of Vocational Technology
ABSTRACT
Reactive power balance of power system is important. Static synchronous compensator (STATCOM) based on invert technology is a new dynamic reactive power compensation, and has many advantages compared with static var compensator, so STATCOM has vast market prospect. New technology can improve the performance of static synchronous compensator, and in this paper wavelet filter is applied in STATCOM to filter the harmonics of load current, and the active portion and reactive portion of the fundamental current are calculated by dq transformer, and the reference signal of output current is calculated by dq reverse transformer using the reactive portion and the output of PI controller which controls the DC voltage, and PWM tracking control technology is employed. The simulation results indicate that the application effect is good.
Keywords: Wavelet Filter, Reactive Power Compensation, STATCOM, Simulation
1. INTRODUCTION
Reactive power in power grid is the basic reason of the deviation power system voltage from the nominal value. When the voltage deviation gets big, the electrical equipment performance would be deteriorated, which may not only lead to the low operating efficiency of equipment, but also the damage caused by the overvoltage or over current. Big voltage deviation is the thread to the power system’s stability and influences the system’s economical operation. It’s the necessary and sufficient way to ensure every node voltage of power system in normal levels that the power system has plenty of reactive power sources and essential voltage regulation method is used. The SVC and STATCOM have dynamic reactive compensation properties in many kinds of reactive power sources. Compared with SVC, the STATCOM has many superior performances, such as fast governing speed, wide running range, and can greatly reduce the harmonics in the current compensation when the PWM control technique and so on are used. Besides, both the bulk and the weight of the device are decreased because the reactor and capacitor used in STATCOM are far smaller than these in SVC.
Japan and the USA respectively developed a set of 80Mvar and 100Mvar STATCOM device adopted GTO thruster in 1991 and 1994. Both the devices were successfully put into commercial operation. [1]The STATCOM device, of which
unit capacity is 8Mvar, was also put into operation in 1998 made by Siemens of Germany. In China, the STATCOM device of ±20 Mvar was run in
Chaoyan transformer substation of Henan Power Company in 1999, and in 2005 the STATCOM device of ±50Mvar was installed in Huangdu Xijiao transformer substation, which was used to improve the voltage stability of 220 kV bus and inhibit the bus voltage surge. [2-3]
In this paper, the wavelet filtering is applied in STATCOM, which filters the harmonics in voltage and current, and gets the fundamental voltage and current. Simultaneously, the active portion and reactive portion of the fundamental current are calculated by dq transformer, and the tracking control technology is employed to control the output current of STATCOM, using reactive portion of the fundamental current as reference signal. The output current tracks the reference signal and the source current don’t contain fundamental reactive current.
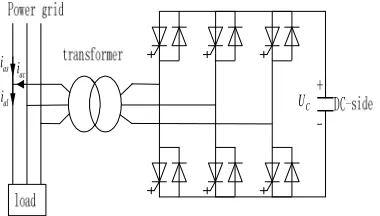
2. THE STATCOM STRUCTURE & WORK
PRINCIPLE
ISSN: 1992-8645 www.jatit.org E-ISSN: 1817-3195
the inductance. In order to achieve dynamic reactive power compensation, the output voltage phase and amplitude of the AC-side of convert circuit can be controlled (or directly control the current of AC-side) to make the fundamental reactive current (
i
ac), which is in the convertercircuit, equal with the load fundamental reactive
current (
i
al), and there is no fundamental reactivecurrent in the source current (
i
as). More thyristorsused in series can improve the STATCOM capacity and the voltage grade, which can also be achieved through the multiple technology and multi-level technology.
al
i
as
i
ac
i
C
U
[image:2.612.323.478.216.336.2]_
Fig 1. The STATCOM With Voltage Converter Circuit
3. THE THEORY OF WAVELET FILTER
The formula of f (t) ∈L2(R) is launched following the space combination shown as formula 1, [4-5]
J J
j
j V
W R
L =
∑
⊕−∞ =
) (
2
(1)
Where J is an arbitrary scale. So, the
f
(t
)
can be written as) ( )
( )
(t d, , t c, , t
f jk
k k j k
j J
j k
k
j
ψ
∑
φ
∑ ∑
∞−∞ = −∞
= ∞
−∞ =
+ =
(2) The signal
f t
( )
is decomposed by 5-layer orthogonal wavelet shown as fig 2.If the signal fundamental frequency is 50Hz, according to Shannon's sampling theorem, the fundamental signal sampled 128 points per cycle can be analyzed to 64 harmonics (3200Hz). If the maximum frequency of
f t
( )
is 3200Hz, according to Fig 2, the band division on the wavelet decomposition is shown in Table 1, [1] where each decomposition of the signal or low frequency (ca) of the band is down into some low-frequency band (ca) and high frequency bandportion (cd), and the decomposition of the band is in accordance with the highest frequency that can be analyzed. The 128-point sampling is according to the band decomposition at the maximum frequency of 3200Hz. In Table 1, the voltage signal and current signal are 5-layer wavelet decomposition. If the voltage and current without DC and second harmonic, their low frequency (ca5) only contains base wave after the 5 layers of wavelet decomposition.
sig n al
c a1 c d 1
c a 2 cd 2
ca 3 c d 3
c a 4 c d4
[image:2.612.92.282.275.383.2]ca 5 cd 5
Fig 2. The Wavelet Decomposition Table 1. The Frequency Band And Harmonics Wavelet Frequency band Harmonics
cd1 1600Hz-3200Hz 32-64
cd2 800Hz-1600Hz 16-32
cd3 400Hz-800Hz 8-16
cd4 200Hz-400Hz 4-8
cd5 100Hz-200Hz 2-4
4. CONTROL OF STATCOM
Block diagram of fundamental reactive load current’s detection and power grid reference current’s generation is shown in Fig 3,where sine and cosine signal (sinωt, cosωt) are obtained,
which have the same frequency and power with the
power grid by pll.
i
al,i
blandi
cl are the loadcurrent, and the fundamental current (
i
af ,i
bfi
cf )ISSN: 1992-8645 www.jatit.org E-ISSN: 1817-3195 P I Q I af i bf i cf
i
al i bli
cl i arefi
brefi
crefi
a u Cref U C UFig 3. Block Diagram Of The Power Grid Reference Current’s Generation
sin( )
af m
i =I ω ϕt−
(3)
sin( 2 / 3 )
bf m
i =I ωt− π −ϕ
(4)
sin( 2 / 3 )
cf m
i =I ωt+ π −ϕ
(5)
The dq transformer of three-phase current is shown as follows, [1、6] so that the load fundamental current active component and reactive component can be obtained. In order to maintain
the DC bus voltage (
U
C ) stable, closed-loopcontrol of capacitor voltage is used; whose
controller is the PI regulator. ' P
I
Is assumed as the output of PI regulator,
− + − − − + − + − = ) 3 2 sin( ) 3 2 sin( ) sin( ) 3 2 cos( ) 3 2 cos( cos ) 3 2 sin( ) 3 2 sin( sin 3 2 ϕ π ω ϕ π ω ϕ ω π ω π ω ω π ω π ω ω t I t I t I t t t t t t I I m m m Q P =
ϕ
ϕ
sin cos m m I I (6)The reference signals (
i
aref 、i
brefandi
cref ) ofcurrent tracking controlling can be obtained through the dq inverse transformation. The value of d in dq inverse transformation is the PI regulator
output IP' , while the value of q is the reactive
component (IQ )of load current. Both of them are shown as follows.
+
+
−
−
=
Q p cref bref arefI
I
t
t
t
t
t
t
i
i
i
')
3
2
cos(
)
3
2
sin(
)
3
2
cos(
)
3
2
sin(
cos
sin
π
ω
π
ω
π
ω
π
ω
ω
ω
(7)L
i
Ci
Sl
i
ref
i
Fig 4. Tracking Control
The output current can be controlled in inverter circuit with PWM Tracking Control Technology. Its working principle is shown in Fig 4, where the
reference signal
i
ref (i
aref 、i
bref andi
cref ) canmake the output compensation current of inverter circuit have the same value 、phase and frequency with the load fundamental reactive current ,and there is no fundamental reactive current in power current.
5. THE SIMULATION
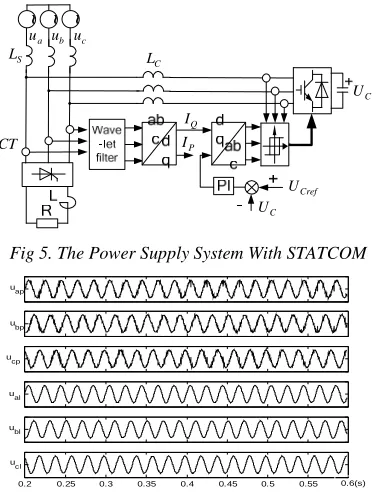
The power supply system with STATCOM is shown as Fig 5, where the three-phase power is symmetrical. The STATCOM and its control circuit are at the right part of the figure. At the left part, there are access point detection of voltage and current, the three-phase power and its load which is the three-phase full-controlled bridge rectifier circuit. The three-phase power supply is joined by the star-connecting and the equivalent inductance of the power is LS, while the equivalent resistance is not drawn. The current whose characteristic harmonic is 6k±1 (k=1, 2, 3,…), causing the supply point voltage distortion formed by the three-phase full-controlled bridge rectifier circuit. The STATCOM is the three-phase bridge voltage inverter circuit. It is connected to the access point through the inductor LC, whose effect is filtering. The three-phase voltage inverter circuit is controlled using the hysteresis current tracking control technology.
ISSN: 1992-8645 www.jatit.org E-ISSN: 1817-3195
simulation system is 5 and both the voltage and current are decomposed by 5-lay wavelet, and the fundamental voltage and current can be obtained by the low frequency part’s reconstruction.
The simulation results are shown in Fig 6、7、8 and 9. In the 4 figures, the control angle of the full-controlled rectifier bridge has been changed from 5° to 60° at 0.4s. Figure 6 shows the three-phase voltage (uap, ubp, ucp) of the public power supply point (PCC) and its wavelet filtered voltage (ual, ubl, ucl). Figure 7 shows the three-phase load current (ial, ibl, icl) and its wavelet filtered current (iaf, ibf, icf). These two figures indicate that the filter works well. Figure 8 shows the three-phase command current of STATCOM (iaref, ibref, icref) and its actual output three-phase current (iac, ibc, icc). Figure 9 shows the waveforms of three-phase supply voltage (uas, ubs, ucs) and current (ias, ibs, ics).Before 0.4s, the fundamental reactive current is very small, so it is the current generated by STATCOM. The supply current almost has no change compared with the load current. After 0.4s, both the fundamental reactive current and the current generated by STATCOM are big, and the supply current has great changes compared with the load current.
S
L
CT
C
L
P
I
Q
I
a
u ub uc
Cref
U
C
U
C
[image:4.612.166.517.43.694.2]U
Fig 5. The Power Supply System With STATCOM
u
al
uap
u
bp
u
cp
ubl
0.2 0.25 0.3 0.35 0.4 0.45 0.5 0.55 u
cl
0.6(s)
Fig 6. The Voltage Of The Public Power Supply Point (PCC) Before And After The Filtering
ial
ibl
icl
iaf
ibf
icf
0.2 0.25 0.3 0.35 0.4 0.45 0.5 0.55 0.6(s)
Fig 7. The Current Of The Load Before And After The Filtering
A-frame; B1-B4- spring leaf;
C-wave-guide-bridge; M-mass block
The axial elastic coefficient of the two-wave-guide-bridge is
l
Ebh
K
w=
(8)
where
E
is equivalent elastic modulus ofcladding and core of waveguide material;
b
iswidth of waveguide bridge;
h
is thickness ofwaveguide bridge;
l
is length of waveguide bridge.iaref
ibref
icref
iac
ibc
icc
0.2 0.25 0.3 0.35 0.4 0.45 0.5 0.55 0.6 (s)
Fig 8. The Command Current And Its Actual Output Current
uas
ias
ubs
ibs
ucs
0.2 0.25 0.3 0.35 0.4 0.45 0.5 0.55
ics
0.6(s)
[image:4.612.104.292.405.656.2]ISSN: 1992-8645 www.jatit.org E-ISSN: 1817-3195
The elastic coefficient of the four spring leaves is
3 '
' '
)
(
ˆ
l
h
b
E
K
p=
(9)
Where
Eˆ
is elastic modulus of spring leaf;'
b
is width of spring leaf; 'h
is thickness ofspring leaf;
l
' is length of spring leaf.The resonant frequency of mass-spring system of measuring probe is expressed as
m
K
f
yπ
2
1
0
=
,
K
y=
2
K
w+
4
K
P(10) The resonant frequencies of spring leaf is expressed as' ' 0
ˆ
l
h
E
K
f
P pρ
=
(11)
While, the resonant frequencies of wave-guide-bridge is expressed as
3 2
0
1
Ebh
Nl
K
f
f
w=
op+
w(12)
When wave-guide-bridge generate a uniform dynamic stress, the stress on FBG is associated with acceleration, expressed as
w y Z
l
K
m
a
=
ε
(13)
where
ε
Z is axial stress of FBG;a
isvibration acceleration;
m
is quality of massblock;
l
w is length of FBG.FBG 1 and FBG 2 are two fibers Bragg
gratings which have same center reflected
wavelength and are both
λ
b1 with no vibration signals. The reflectance spectrum is shown in Fig.10 (a).When vibration action is on mass block which is to act on wave-guide-bridge, grid pitch of fiber gratings on Waveguide Bridge is to be changed under uniform stress as shown in Fig.10 (b). And the result in change of reflected wavelength of
fiber gratings is
∆
λ
b11 . Suppose that compressivestress is generated on FBG1 and tensile stress on
FBG2corresponded regularly. Then, wavelengths
change of FBG1 and FBG 2 are expressed
respectively as
1 11 1 2
1{1 [(1 ) 12 11]}( ) 1
2
b b
neff
b Z b
n
P P T
λ λ λ
λ µ µ ε λ α
∆ = −
= − − − − + ∆ (14)
' 2 11 1
2
1{1 [(1 )12 11]} 1
2
b b
neff
b Z b
n
P P T
λ λ
λ
λ
µ
µ ε λ α
∆ = −
= − − − + ∆
(15)
where is lateral Poisson ratio;
P
11, P
12 arethe Pockel’s coefficients of the stress-optic tensor;
Z
ε
is axial stress (i.e., it’s “+” when compressivestress is applied and per contra “-”);
α
is thecoefficient of thermal expansion;
∆
T
is the temperature difference. Suppose the reflectedwavelength difference of FBG1 and FBG 2
is
∆
λ
, it can be expressed asZ neff
b
b P P
n
ε µ µ λ
λ ∆ λ ∆ λ
∆ [(1 ) ]}
2 1
{ 12 11
2 1 1 2
11= − = − − −
(16)
Given
] )
1 [( 2
1 12 11
2
P P n
K= − eff −µ −µ
, then
z b
K
λ
ε
λ
∆
=
2
1 , (17)ISSN: 1992-8645 www.jatit.org E-ISSN: 1817-3195
(b)
Fig 10.Reflectance spectrum of measuring acceleration probe: (a) No strain is applied to FBG1 and FBG2. (b) Strain is applied to FBG1 and FBG2. Expression (15) indicates that the reflected
wavelength difference of FBG1and FBG2,
∆
λ
is independent of temperature. In the light of expression (15), we can establish the relationship
of wavelength difference
∆
λ
and vibration accelerationa
.6. SIMULATION RESULTS
In this section two simulations are carried out for evaluating the performance of the FWNN with the proposed initialization procedure.
Example.1. In order to compare with other research the second order nonlinear dynamic plant in [18] is considered.
(18)
In that
(19)
Are one, two and
Tree step delayed outputs of the plant are current and one step delayed inputs of the plant. The current output of the plant depends on previous input and output signals. Here same as [18] only the current state of system and the control signal are fed into the FWNN as inputs.
The network is trained for 200 epochs with 1000 time steps in each epoch. The root-mean-square error (RMSE) used as a performance index is as follows where K is the number of training data which is distributed uniformly in [-1, 1] (here K=1000).
(20)
The clustering algorithm described in section III.A is used to determine the number of fuzzy rules and the initial parameters of the wavelets. By using that algorithm we construct the FWNN in section II with only two fuzzy rules. The number of parameters is reduced to N=18 and the RMSE obtained after training is 0.003
7.CONCLUSIONS
With the development of microelectronics technology, The DFACTS device, based on full-controlled devices and inverter technology, has been continuously improving its reliability and reducing its ongoing cost. So this device, such as STATCOM 、 APF, has broad application prospects. The wavelet filtering was applied in STATCOM while its simulation was done. The simulation results show that the application works well.
REFERENCE
[1] LIU Wen-hua ,SONG Qiang ,ZHANG Dong-jiang, etc. Equivalent Tests of Links of 50 MVA STATCOM [J]. Proceedings of the CSEE, 2006, 26(12):73-77.
[2] ZHENG Dong-run, QIAO Wei-dong, LIU W en-hua, etc. Field tests of 500Mvar STATCOM [J]. EastChinaElectric Power, 2007, 35(1):47-50.
[3] Weon-Ki Yoon, etc. Reactive Power Measurement Using the Wavelet Transform [J]. IEEE Transactions on Instrumentation and Measurement (S0018-9456), 2000, 49(2): 246-252.
[4] Reactive Power Measurement by Wavelet Transform and Hilbert Transform [J]. JOURNAL OF SYSTEM SIMULATION, 2005, 17(4):822-824.
[5] Li Z.Q., Zheng S.S., Hu Y., Tao Q.G., He W, Failure Modes-Based Multi-levels Optimization Design of Structures, IEIT Journal of Adaptive & Dynamic Computing,
2011(4), Oct 2011, pp:1-8.
DOI=10.5813/www.ieit-web.org/IJADC/2011. 4.1
)) 1 ( ), ( ), 3 ( ), 2 ( ), 1 ( ( )
(k =f yk− yk− yk− uk uk−
y
2 2 2 3
4 3 5 3 2 1 5 4 3 2 1
1
) 1 ( )
, , , , (
x x
x x x x x x x x x x x f
+ +
+ − =
) 3 ( ), 2 ( ), 1
(k − y k − y k −
y
) 1 (k− u
K k y k y RMSE
K
i
d
∑
=
+ − + = 1
2
ISSN: 1992-8645 www.jatit.org E-ISSN: 1817-3195
[6] M.P.Vani, Computer Aided Interactive Process of Teaching Statistics Methodology – III Evaluation Questionnaire for LearnersThrough statistical display using Bar chart, IEIT Journal of Adaptive & Dynamic Computing, 2011(4),
Oct 2011, pp:9-14.
DOI=10.5813/www.ieit-web.org/IJADC/20114 .2
[7] Lo. Yu-Lung, Jen-Fa Huang and Po-Hsun Sung et al: Intensity variation effects in fiber Bragg grating sensors scanned by a tunable filter, Meas.Sci.Technol.2000, pp.1456-1462. [8] C. S. Quang, W. J. Lee. "A TSK-Type
Neuro-Fuzzy network approach to system modeling problems," IEEE Trans. On Sys. Man and Cyberntic, Vol. 35, No. 4, 2005. [9] V. Topalov, G. L. Cascella, V. Giordano, F.
Cupertino, O. Kaynak, "Sliding mode Neuro-Adaptive control of electrical drives," IEEE Trans. Indust. Electron., V. 54, No. 1, pp. 671-679, 2007.