© 2017, IRJET | Impact Factor value: 5.181 | ISO 9001:2008 Certified Journal | Page 1125
Speech Enhancement using Compressive Sensing
K.Kiruthiga
1, J.Indra
21
PG Scholar,Dept. Of EIE, Kongu Engineering College, Tamilnadu,India
2
Assistant Professor (SLG),Dept. Of EIE, Kongu Engineering College, Tamilnadu, India
---***---
Abstract -
Speech enhancement is a technique which is usedto reduce the background noise present in the speech signal. The noises are additive noise, echo, reverberation and speaker interference. The aim of the proposed method is to reduce the background noise present in the speech signal by using compressive sensing. The goal of compressive sensing is to compress the speech signal at transmitter and decompress it at the receiver from far less samples than the nyquist rate. In this work, a speech signal is taken and then it is compressively sampled using a measurement matrix which in case is composed of randomly generated numbers. The output of the compressed sensing algorithm is the observation vector which is transmitted to the receiver. At the receiver section, signal is reconstructed from a significant small numbers of samples by using l1- minimization. MATLAB simulations are performed to compress the speech signal below the nyquist rate and to reconstruct it without losing any important information.
Key Words
:
Speech enhancement, Compressive sensing, DCT, l1 –minimization, Measurement matrix.1. INTRODUCTION
In recent years, various signal sampling schemes have been developed. However, such sampling methods are difficult to implement. So before sampling the signal it should have sufficient information about the reconstruction kernel. The emerging compressive sensing theory shows that an unevenly sampled discrete signal can be perfectly reconstructed by high probability of success by using different optimization techniques and by considering fewer random projections or measurements compared to the Nyquist standard. Amart Sulong et al proposed the compressive sensing method by combining randomized measurement matrix with the wiener filter to reduce the noisy speech signal and thereby producing high signal to noise ratio [1]. Joel A. Tropp et al demonstrated the theoretical and empirical work of Orthogonal Matching Pursuit (OMP) which is effective alternative to (BP) for signal recovery from random measurements [2]. Phu Ngoc Le et al proposed an improved soft – thresholding method for DCT speech enhancement [3]. Vahid Abolghasemi focused on proper estimation of measurement matrix for compressive sampling of the signal [4].
2. Compressive sensing
Compressive sensing involves recovering the speech signal from far less samples than the nyquist rate [8]. Fig.1 shows the basic block diagram of compressive sensing. Initially, the signal is sampled using nyquist rate, whereas with the help of compressive sensing the signal is sampled below the nyquist rate [5]. The signal is transformed into a domain in which it shows sparse representation. Then the signal is transmitted and stored in the channel by the receiver side [13].
Fig.1 Basic block diagram of compressive sensing
Finally the signal is reconstructed from the samples by using one of the different optimization techniques available.
3. Noizeus Corpus
© 2017, IRJET | Impact Factor value: 5.181 | ISO 9001:2008 Certified Journal | Page 1126
4. Proposed Method for Speech
Enhancement Using Compressive Sensing
algorithm
The proposed speech enhancement algorithm using compressive sensing is illustrated in Fig.2
Analysis filter bank uses gammatone filter due to its resemblance to the shape of human auditory filters. Then discrete cosine transform is chosen due to its simplicity. Subband modification is applied to produce subband coefficients for analysing the speech signal. On synthesis side, for solving convex optimization of compressive sensing, the gradient projection of sparse reconstruction algorithm is used [1]. Higher the processing power, higher is the quality of the signal synthesized.
Fig.2 Flowchart for Proposed Speech Enhancement Algorithm
5.
Measurement Matrix
A random matrix is a matrix with random entries. A random matrix (sometimes stochastic matrix) is a matrix-valued random variable, in which some matrix or all of whose elements are random variables.
y = Φx = ΦΨα (1)
Where, Φ is a M N measurement matrix with each row be a measurement vector
α is the coefficient vector with K non zeroes element. The measurement matrix plays a major role in the process of recovering the original signal. In compressive sensing there are two types of measurement matrices namely, random measurement matrix and the predefined measurement matrix [14].
subject to Φx= y (2)
which is also known as basis pursuit(P1). = (3)
It is otherwise known as Taxicab norm Manhattan norm [2]. The distance obtained from this norm is called the Manhattan distance or l1 distance.
6. Optimization Techniques
Signal reconstruction plays an major role in compressive sensing theory where the signal is reconstructed or recovered from a less number of measurements [4]. By using optimization techniques it is possible to recover the signal without losing the information at the receiver.
6.1.
l
1 Minimization
l1 minimization is used to solve the under determined linear equations or sparsely corrupted solution to an over determined equations [11].
7. Conventional Thresholding
In the proposed method soft thresholding is followed due to its advantages [3].The soft thresholding is defined as
© 2017, IRJET | Impact Factor value: 5.181 | ISO 9001:2008 Certified Journal | Page 1127
8. Experimental Results and Discussions
8.1. Input Speech and Noise Representation in
Time Domain
The sample sentence is “Clams are small, round, soft and tasty”
(i). Enhanced Output from Babble Noise (0db)
The enhanced output from babble noise is shown in the Fig.4
0 200 400 600 800 1000 1200 1400 1600 1800 2000 -0.15 -0.1 -0.05 0 0.05 0.1 0.15 0.2
0.25 input clean signal
Length of the input speech signal
A m pl itu de o f th e in pu t sp ee ch s ig na l (a)
0 200 400 600 800 1000 1200 1400 1600 1800 2000 -0.15 -0.1 -0.05 0 0.05 0.1 0.15 0.2
babble noise at 0db signal
Length of the noisy signal
A m p lit u d e o f th e n o is y s ig n a l (b)
0 200 400 600 800 1000 1200 1400 1600 1800 2000 -1 -0.8 -0.6 -0.4 -0.2 0 0.2 0.4 0.6 0.8 1
Discrete cosine transform of 0db signal
Length of the DCT spectrum
A m pl itu de o f th e D C T sp ec tr um (c)
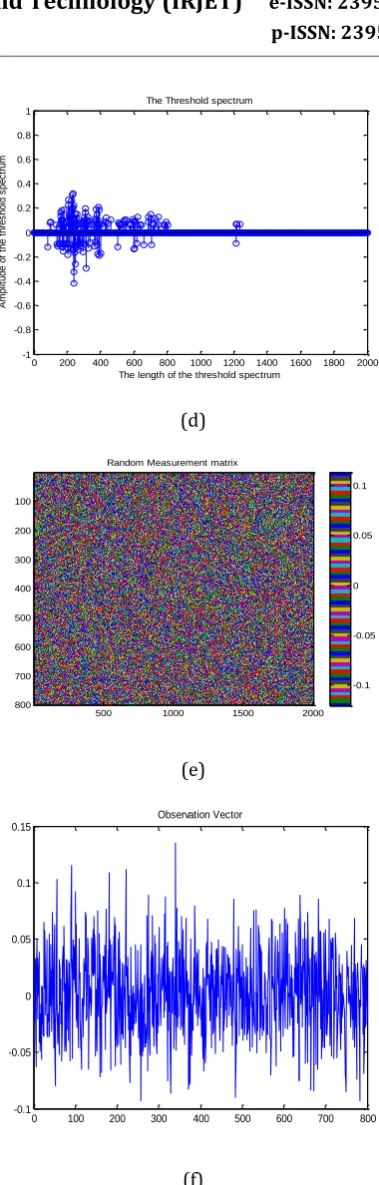
0 200 400 600 800 1000 1200 1400 1600 1800 2000 -1 -0.8 -0.6 -0.4 -0.2 0 0.2 0.4 0.6 0.8 1
The Threshold spectrum
The length of the threshold spectrum
A m p lit u d e o f th e t h re s h o ld s p e c tr u m (d)
Random Measurement matrix
500 1000 1500 2000
100 200 300 400 500 600 700 800 -0.1 -0.05 0 0.05 0.1 (e)
0 100 200 300 400 500 600 700 800
[image:3.595.337.527.55.649.2]-0.1 -0.05 0 0.05 0.1 0.15 Observation Vector (f)
[image:3.595.66.533.80.729.2]Fig.4 Enhanced Output From Babble Noise at (0db) (a) Clean Speech (b) Noisy Speech (c) Applying DCT (d) Thresholding (e) Random Measurement Matrix (f) Output for Compressive Sensing
© 2017, IRJET | Impact Factor value: 5.181 | ISO 9001:2008 Certified Journal | Page 1128 real data points into real spectrum and is shown in (c). The
[image:4.595.35.292.212.431.2]threshold window is then applied to eliminate the small coefficients as shown in (d). Threshold spectrum is multiplied by measurement matrix which is composed of randomly generated numbers as shown in (e), and then compressive sensing algorithm is used in (f).
Table 1: Amount of signals compressed by using signal parameters NOISE SIGNAL AT DIFFERENT (DB) LENGTH OF THE SIGNAL (L) THRESHOLD WINDOW
UL LL COMP ESSED SAMP LE(K) ERRO R(%) COMPRES SION(%) (K/L) Babble
0db 2000 0.04 -0.06
800
0.1089
40%
5db 2000 0.04
0.04 -0.06
-0.06
0.1361
10db 2000 0.04 -0.06 0.1931
15db 2000 0.04 -0.06 0.1821
Airport
0db 2000 0.04 -0.06
800
0.1037
40%
5db 2000 0.04 -0.06 0.1900
10db 2000 0.04 -0.06 0.1777
15db 2000 0.04 -0.06 0.1975
Car
0db 2000 0.04 -0.06
800
0.0795
40%
5db 2000 0.04 -0.06 0.1738
10db 2000 0.04 -0.06 0.2193
15db 2000 0.04 -0.06 0.1963
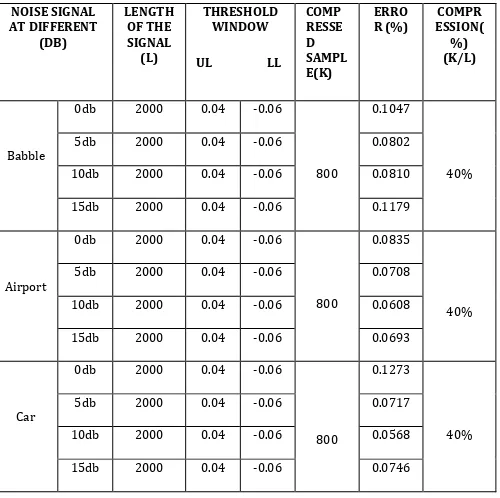
Table 2: Amount of signals compressed by using signal parameters NOISE SIGNAL AT DIFFERENT (DB) LENGTH OF THE SIGNAL (L) THRESHOLD WINDOW
UL LL COMP RESSE D SAMPL E(K) ERRO R (%) COMPR ESSION( %) (K/L) Babble
0db 2000 0.04 -0.06
800
0.1047
40%
5db 2000 0.04 -0.06 0.0802
10db 2000 0.04 -0.06 0.0810
15db 2000 0.04 -0.06 0.1179
Airport
0db 2000 0.04 -0.06
800
0.0835
40%
5db 2000 0.04 -0.06 0.0708
10db 2000 0.04 -0.06 0.0608
15db 2000 0.04 -0.06 0.0693
Car
0db 2000 0.04 -0.06
800
0.1273
40%
5db 2000 0.04 -0.06 0.0717
10db 2000 0.04 -0.06 0.0568
15db 2000 0.04 -0.06 0.0746
[image:4.595.305.563.234.458.2]From Table 1, it is observed that for babble noise with noise level as 5db, length of the signal as 2000, threshold window from 0.04 to -0.06 and compressed samples as 800, the error is 13.61% and compression is upto 40%. From Table 2, it is observed that for babble noise with noise level as 5db, length of the signal as 2000, threshold window from 0.04 to -0.06, and compressed samples as 800, the error is 8.02% and compression is upto 40%.
Table 3: Amount of Signals Compressed by using Signal Parameters NOISE SIGNAL AT DIFFERENT (DB) LENGTH OF THE SIGNAL (L) THRESHOLD WINDOW
UL LL COMP RESSE D SAMPL E(K) ERROR (%) COMP RESSIO N(%) (K/L) Babble
0db 2000 0.04 -0.06
800
0.0866
40%
5db 2000 0.04 -0.06 0.0863
10db 2000 0.04 -0.06 0.1009
15db 2000 0.04 -0.06 0.0887
Airport
0db 2000 0.04 -0.06
800
0.0894
40%
5db 2000 0.04 -0.06 0.0767
10db 2000 0.04 -0.06 0.0939
15db 2000 0.04 -0.06 0.0834
Car
0db 2000 0.04 -0.06
800
0.1410
40%
5db 2000 0.04 -0.06 0.0995
10db 2000 0.04 -0.06 0.0879
15db 2000 0.04 -0.06 0.0967
From Table 3, it is observed that for babble noise with noise level as 5db, length of the signal as 2000, threshold window from 0.04 to -0.06, and compressed samples as 800, the error is 8.63% and compression is upto 40%.
9. Conclusion and Future Scope
[image:4.595.39.289.482.731.2]© 2017, IRJET | Impact Factor value: 5.181 | ISO 9001:2008 Certified Journal | Page 1129 The speech signal was reconstructed without losing
important information that leads to increase in data rate. Some of the future works are as follows. Different transformations need to be tested in order to find the most efficient one for this application. A measurement matrix that will be optimum for speech signals is to be designed. The proposed method has to be tested with other existing methods to prove its efficiency.
10. References
[1] Amart Sulong, Teddy Surya Gunawan, Othman O. Khalifa, Mira Kartiwi,‘ Speech Enhancement based on Wiener filter and Compressive Sensing’, Indonesian Journal of Electrical Engineering and Computer Science, Vol. 2, issue.2, pp. 367-379, 2016.
[2] Joel A. Tropp and Anna C. Gilbert, ‘Signal Recovery from Random Measurements via Orthogonal Matching Pursuit’, IEEE Transactions on Information Theory, pp. 4655- 4666, Dec 2007.
[3] Phu Ngoc Le, Eliathamby Ambikairajah and Eric Choi, ‘An Improved Soft Threshold Method for DCT Speech Enhancement’, IEEE, pp. 268-271, July 2008.
[4] Vahid Abolghasemi, Saideh Ferdowsi, Bahador Makkiabadi, and Saeid Saneis, ‘On Optimization of the Measurement matrix for Compressive Sensing’, 18th European Signal Processing Conference (EUSIPCO-2010), semantic scholar, pp. 427-431, Aalborg, Denmark ,Aug 2010.
[5]
Amart Sulong, Teddy S.Gunawan, Othman O.Khalifa, and Jalel Chebil, ‘Speech Enhancement based on Compressive Sensing’, 5th International Conference on Mechatronics (ICOM’13), pp. 1-10. 2013.[6] Anna maria jose and Mathurakani M, ‘Compressive Sensing Based OFDM Channel Estimation’,International Journal of Modern Sciences and Engineering Technology,Vol. 3, issue. 2, pp.13-20, 2016.
[7] Donoho D.L, ‘Compressed Sensing’, IEEE Transactions on Information Theory, vol. 52, pp.1289-1306, April 2006.
[8] Emmanuel J. Candes and Michael B. Wakin, ‘An Introduction to Compressive Sampling’, IEEE Signal Processing Magazine, Vol. 25, issue 2, pp. 21-30, March 2008.
[9] Hirsch H and Pearce D (2000),
‘The Aurora Experimental Framework for the Performance Evaluation of Speech Recognition Systems under Noisy Conditions’, ISCA ITRWASR2000.
[10] Jagdeep Kaur, Kamaljeet Kaur, Monika Bharti, Pankaj Sharma and Jatinder Kaur ‘Reconstruction Using Compressive Sensing: A Review’, International Journal of Advanced Research in Computer and
Communication Engineering, Vol.2, issue.9, pp.3648-3650,2013.
[11] Massimo Fornasier and Holger Rauhut, ‘Compressive Sensing’, Springer link handbook of mathematical methods and imaging, pp. 187-228, 2010.
[12] IEEE Subcommittee 1969 IEEE Recommended Practice for Speech Quality Measurements. IEEE Trans. Audio and Electroacoustics, AU-17(3), 225-246.
[13] Pooja C. Nahar, Dr. Mahesh and Kolte.T, ‘An Introduction to Compressive Sensing and its Applications’, International Journal of Scientific and Research Publications, Volume 4, Issue 6, pp . 1-5, June 2014.
[14] Richard G. Baraniuk, ‘Compressive Sensing’, IEEE Signal Processing Magazine, lecture notes, pp.118-120, 124, 2007.
[15] Siddhi Desai and Prof. Naitik Nakrani ‘Compressive Sensing in Speech Processing: A Survey Based on Sparsity and Sensing Matrix’, International Journal of Emerging Technology and Advanced Engineering, Volume 3, Issue 12, pp . 18-23,2013.