© 2017, IRJET | Impact Factor value: 5.181 | ISO 9001:2008 Certified Journal
| Page 1949
PSO-GSA Tuned Dynamic Allocation in Wireless Video Sensor Networks
for IOT
Shilpa Bisen,
M
.Tech ,Department of Electronics and Communication,
AMITY University, Noida, U.P., India
---***---Abstract— We are witnessing the formation of an Internet of Things (IoT), where real-world entities (e.g., people, plants, cars) augmented with computing devices (e.g., smart phones, tablets, sensor no des), sensors (e.g., humidity sensors, microphones, cameras), and actuators (e.g., motors, LED) are connected to the Internet, enabling them to publish their generated data on the Web. Two main characteristics of the IoT are its large scale interconnecting billions of Smart Things in the next decade, and the resource limitations of Smart Things (i.e., of their embedded computing devices). For many IoT applications, routing and sensor search are essential services. Our thesis is that despite the large scale of the IoT and the resource limitations of Smart Things, efficient solutions for the routing and sensor search services can actually be provided. We support this thesis by proposing, implementing, and evaluating routing algorithm for high-scale wireless sensor networks (which are a building block of the IoT), and channel allocation for those searched path. Particle Swarm Optimization (PSO) and Gravitational Search Algorithm (GSA) are used to assign the optimal channel bandwidth to all paths out of total assigned bandwidth to minimize the total path loss so that all data can be transferred to destination.
Key words: Particle swarm optimization, Gravitational Search Algorithm.
1.INTRODUCTION
1.1 Internet of Things:
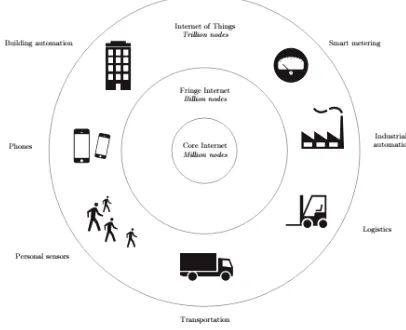
Every kind of things we think, we will be connected in Internet of Things (IoT). In this, at any time we can get information about anything from anywhere. This interconnected ecosystem have so many countless applications which interface with the internet; embedded and resource-constrained devices will imminently dominate a domain once accessible exclusively to servers and workstation computers, providing highly specific functions for sensing and actuating. Such devices find new ways for communicating with existing infrastructure and outside the world and between the things which are outside of their applications. So, we need a broad vision for the IoT for everything we might need. Figure 1.1 shows the vision of Internet of three layers.
[image:1.595.330.533.355.520.2]The core internet is the first layer of this vision. It is the backbone of the internet. It is made up of routers, servers and carrier infrastructure which are machines and access all the way along the route which connect to a website and its endpoint also. The ‘fringe’ Internet is the 2nd layer which included the concept of workstation computers; personal desktop and laptop computers. The internet of things is the third and final layer which can act either clients, servers or both and provide so many services and be any type of devices
Figure 1.1: Internet of Things vision
1.2 Wireless Sensor Networks
© 2017, IRJET | Impact Factor value: 5.181 | ISO 9001:2008 Certified Journal
| Page 1950
Lifetime constraints imposed by the limited energysupplies of the nodes in the network.
Unreliable communication due to the wireless medium.
[image:2.595.70.293.186.336.2] Need for self-configuration, requiring little or no human intervention.
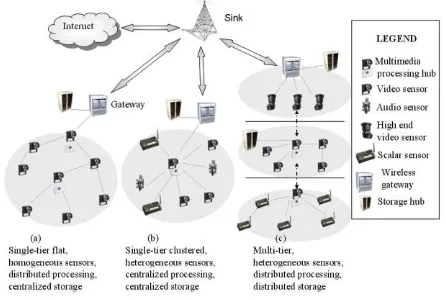
Figure 1.2: Wireless sensor networking
Attacks can be categorized as insider (internal) and outsider (external) Attacks can also be classified as passive and active attacks. Internal attacks: In this type of attack, nodes of the networks perform abnormally. It can destroy the entire network easily by using compromised node. External attacks: In this type of attack, nodes which performed attack function, are not belongs to the network. So, they have no information such as cryptographic of the network. Passive attacks: These attacks are outside from the network so they do not direct affect the network. Active attacks: These attacks are inside the network and disturb all the activity of the network. It also interrupts the information, modification, traffic analysis, and traffic monitoring.
We set our objectives for the dissertation work as:
To allocate the channel and path to video data to minimise the energy consumption, the non linear programming formulation will be used. This NLP problem will be solved by more accurate optimisation algorithm.
To reduce the power consumption only active nodes (which will be triggered at some activity detection) will be considered.
An IOT network of 100-400 nodes will be considered and whole proposed work will be simulated in MATLAB environment.
2.PROPOSED WORK
This work is targeted to minimize the power consumption in wireless video application of IOT. The mathematical formulation of this, converted the solution in to a non linear equation which can't be solved linearly. Optimization algorithms has to be applied on them.
The mathematical problem for this work is represented as:
Where = transmitted power and is link utilisation ratio. The Ptx and UR will be calculated between two sensor nodes termed as edge. The choice of optimal edges satisfying the above equation is subject to constraint that
I. ; where ‘e’ is the edge and ‘E’ is the set of all alive edges
II. The remaining link energy at each edge must be to hold the new sensor data.
This work is divided into two sections. In one part route selection is done and in another part channel allocation to each route is done using hybrid PSO-GSA algorithm in channel allocation part. Let D is the distance from a source node to a destination node. A general formula for the path loss for a wireless link is given by (in unit of dB) :
Here is wavelength of the RF signal. The TX power PTx(e)
for each edge can then be represented as follows (in unit of
mW):
Here is a channel factor. As described above, the maximum link rate is assumed as 100Mbps, which is then with distortion factor β, a possible link rate for each edge e can be defined by
The total data rate traversing an edge e is defined as U(e). Then the link utilization ratio UR(e) for edge e is defined by
Here R(e) is a possible link rate for edge e. For each edge e, the effective TX power is defined by
Hence the total effective power consumption of the entire network is defined as
© 2017, IRJET | Impact Factor value: 5.181 | ISO 9001:2008 Certified Journal
| Page 1951
Dynamic Channel Allocation by PSO-GSA
In our proposed scheme PSOGSA optimized technique is used which is hybrid of PSO (Particle Swarm optimization) and GSA (Gravitational Search Algorithm) optimization algorithm which requires an objective function to minimize. Steps of proposed algorithms are described as:
Step1. Initialize all initial parameters like active nodes, their position, channel bandwidth, frequency to model it.
Step2. Place the nodes randomly in geographical region of 10*10
Step3. Mark the transmission range of each node to be 5 meter and plot a circular region around each node.
Step4. Manage a sink node and select the best path for each node to sink based on minimum hopes and distance.
Step5. Pass these paths for each node to hybrid PSO-GSA optimization algorithm to get the tuned bandwidth allocation for minimization of power consumption.
PSO-GSA Initialization
Step6. Initialize the random positions of particles in PSO.
Step7. Consider the searching space dimension as number of available channels
Step8. Initialize the weighting parameters of PSO as 1.2 and 0.5.
Step9. Compare the fitness value of each particle with the previous best position of bacteria. If fitness function value is less for this new position than previous position then it will be assigned as new.
Step10. The present bets position is termed as current position of particle for PSO and output of fitness function is local for the PSO.
GSA Starts here:
Step11. The current position selected in previous step is used to get the mass for each agent as per GSA algorithm. The minimum value of fitness function is selected as best and maximum as worst position and using the formulas, mass of each agent can be calculated as:
Step12. Gravitational force is calculated as:
The formula is described in section 3.1.
Step13. This new velocity is the direction of particle in PSO is updated as
Here gbest is the global best position of particles in PSO and acceleration is calculated in GSA as
.
GSA ends here
Step14. The final position of agents which is achieved either by matching the condition of power reduction or by reaching the maximum iterations.
Step15. Final positions of agents thus settled are considered as the final weighted sequence of PTS algorithm and multiplied with input sub blocks and PAPR is calculated.
3.Result
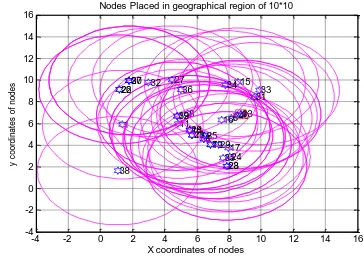
Our results are tested for different active nodes numbers and comparison is done in the basis of effective power and path loss component, tuned with Genetic algorithm, GSA and PSO-GSA. We used 6 channels of 20 MHz bandwidth as per IEEE 802.11 standard. There is no limit to multiple times use of these channels during simulation. So if there is more number of edges in a path then these channels can be allotted dynamically to each edge. This channel allocation process is optimized by PSO-GSA algorithm. Figure 3.1 shows the random placement of 40 active nodes in a geographical region of 10*10 square meters with transmission range of 5 meter.
-4 -2 0 2 4 6 8 10 12 14 16
-4 -2 0 2 4 6 8 10 12 14 16
1 2
3 4 5
6 7
8 9
10 11
12 13
14 15
16
17 18
19 20
21 22
23 24 25 26
27
28 29 30
31 32
33 34
35 36 37
38
39 40
X coordinates of nodes
y
co
or
di
na
te
s
of
n
od
es
[image:3.595.341.523.481.611.2]Nodes Placed in geographical region of 10*10
Figure 3.1: Randomly allocated active nodes in a geographical region of 10*10 m2
© 2017, IRJET | Impact Factor value: 5.181 | ISO 9001:2008 Certified Journal
| Page 1952
1 2 3 4 5 6 7 8 9 10
1 2 3 4 5 6 7 8 9 10 11 1 2 3 4 5 6 7 8 9 10 11 12 13 14 15 16 17 18 19 20 21 22 23 24 25 26 27 28 29 30 31 32 33 34 35 36 37 38 39 40
X coordinates of nodes
y c o o rd in a te s o f n o d e s
[image:4.595.294.566.65.243.2]All possible edges in geographical region of 10*10
Figure 3.2: all possible edges for each node for nodes in figure 3.1
1 2 3 4 5 6 7 8 9 10
1 2 3 4 5 6 7 8 9 10 1 2 3 4 5 6 7 8 9 10 11 12 13 14 15 16 17 18 19 20 21 22 23 24 25 26 27 28 29 30 31 32 33 34 35 36 37 38 39 40
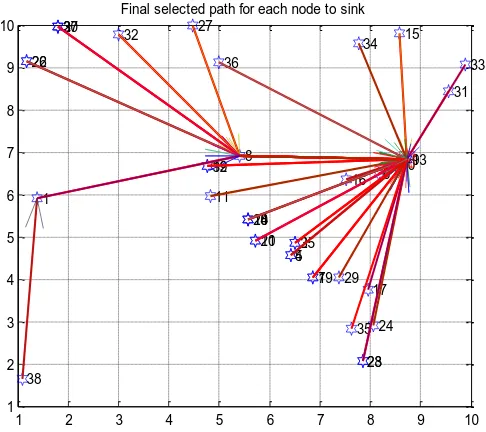
Final selected path for each node to sink
Figure 3.3: Finalized path for each node to sink node
Once the paths are selected then the NP hard problem of optimal allocation of channels is left, which is very important to reduce the power consumption in the network. For this we have used hybrid PSO-GSA optimization which is better than genetic algorithm (GA) and GSA as GA is a local optimization algorithm which sometime skips local minima points during the search of minimum point whereas GSA is the global optimization algorithm which checks every point in search of global minima.
1 -> 8 -> 9 2 -> 8 -> 9
3 -> 9 4 -> 9 5 -> 9 6 -> 9 7 -> 9 8 -> 9
10 -> 9 11 -> 9 12 -> 9 13 -> 9 14 -> 9 15 -> 9 16 -> 9 17 -> 9 18 -> 9 19 -> 9 20 -> 9
21 -> 9 22 -> 8 -> 9
23 -> 9 24 -> 9 25 -> 9 26 -> 8 -> 9 27 -> 8 -> 9
28 -> 9 29 -> 9 30 -> 8 -> 9
31 -> 9 32 -> 8 -> 9
33 -> 9 34 -> 9 35 -> 9 36 -> 9 37 -> 8 -> 9 38 > 1 > 8
[image:4.595.45.282.101.297.2]-> 9 39 -> 9 40 -> 9
Table 3.3: Finalized path from each node to sink for nodes in figure 3.1
After optimization the available channel bandwidth of channels allotted by both optimizations are shown in table 3.4.
Available Channel bandwidth
PSO-GSA 20 20 20 1 11 20
GSA 5 8 3 4 3 3
GA 2.5350 1.9065 1.8111 0.1582 1.3436
0.8510
Table 3.4: Optimized channel bandwidth for available channels
Once the paths are selected then the NP hard problem of optimal allocation of channels is left, which is very important to reduce the power consumption in the network. For this we have used hybrid PSO-GSA optimization which is better than genetic algorithm (GA) and GSA as GA is a local optimization algorithm which sometime skips local minima points during the search of minimum point whereas GSA is the global optimization algorithm which checks every point in search of global minima. The PSO-GSA combination uses the strength of both local and global optimization algorithm because PSO is also a local search algorithm.
[image:4.595.337.524.333.463.2] [image:4.595.43.286.346.562.2]© 2017, IRJET | Impact Factor value: 5.181 | ISO 9001:2008 Certified Journal
| Page 1953
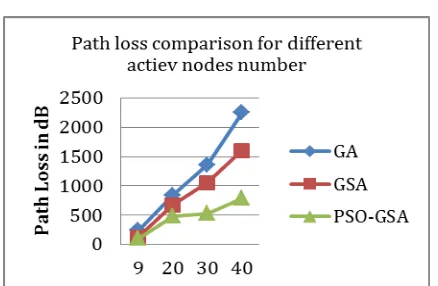
Figure 3.6 path loss comparisons for different active nodes
This figure proved that with number of increase in active nodes, path loss and transmitted power consumption also increases but still with our proposed method i.e. PSO-GSO, it is still very less than genetic algorithm.
4.Conclusion
The main challenge of IOT is the resource like energy, memory, range constraint. These limitation affect the routing in several ways. The best way of routing is multi hops. Rather than sending the data direct to sink which consumes large power, it must be sent through multiple nodes which consumes less power for each node. The low processing power and program memory require that the routing process running on the IOT devices must be highly optimized and light-weight.
These constraint problems needs a solution for this non linear problem which can be best described as an optimisation problem. We proposed a hybrid optimisation algorithm which is a combination of local and global search optimisation. We combined them rather than cascading.
Table 3.5: output parameters comparison for different number of active nodes
Active nodes
9 20 30 40
GA GSA
PSO-GSA GA GSA PSO-GSA GA GSA PSO-GSA GA GSA PSO-GSA
Path Loss Compo nent in dB
238.828
8 126.9 936
103.4
392 841.8833 674.0149 481.8833 1.3580e+03 1.0532e+03 529.5278 2.2510e+0 3
1.601
3e+03 788.3626
Total Trans mitted Power in mW
2.7049e
+41 2.7087e+1 4
3.098
9e+13 1.4852e+65 3.7573e+35 1.5466e+ 25
1.2062e
+31 1.2549e+67 1.2549e+2 7
2.903 1e+6 4
2.508
© 2017, IRJET | Impact Factor value: 5.181 | ISO 9001:2008 Certified Journal
| Page 1954
REFERENCES
[1].Quan Le; Thu Ngo-Quynh; Magedanz, T., "RPL-based multipath Routing Protocols for Internet of Things on Wireless Sensor Networks," in Advanced Technologies for Communications (ATC), 2014 International Conference on , vol., no., pp.424-429, 15-17 Oct. 2014
[2].Sang-Hyun Park, Seungryong Cho, and Jung-Ryun Lee, “Energy-Efficient Probabilistic Routing Algorithm for Internet of Things,” Journal of Applied Mathematics, vol. 2014, Article ID 213106.
[3].HyungWon Kim, "Low power routing and channel allocation method of wireless video sensor networks for Internet of Things (IoT)," in Internet of Things (WF-IoT), 2014 IEEE World Forum on , vol., no., pp.446-451, 6-8 March 2014
[4].Al-Turjman, F.; Gunay, M., "CAR Approach for the Internet of Things," in Electrical and Computer Engineering, Canadian Journal of , vol.39, no.1, pp.11-18, winter 2016
[5].Sung-Keun Lee , Jin-Gwang Koh and Chang-Ryul Jung,” An Energy-Efficient QoS-aware Routing Algorithm for Wireless Multimedia Sensor Networks”, International Journal of Multimedia and Ubiquitous Engineering Vol.9, No.2 (2014), pp.245-252
[6].Chetana V Jyothi, Reema Sharma,” Reducing Power and Interference Using a Routing and Multichannel Allocation Approach in Wireless Sensor Networks for Internet of Things (IoTs)”, International Journal of Innovative Research in Computer and Communication Engineering, Vol.3, Special Issue 5, May 2015
[7].Sastry Kompella, Member, IEEE, Shiwen Mao, Member, IEEE, Y. Thomas Hou, Senior Member, IEEE, and Hanif D. Sherali,” On Path Selection and Rate Allocation for Video in Wireless Mesh Networks”,
[8].IEEE/ACM TRANSACTIONS ON NETWORKING, VOL. 17, NO. 1, FEBRUARY 2009
[9].Samia Allaoua Chelloug,” Energy-Efficient Content-Based Routing in Internet of Things”, Journal of Computer and Communications, 2015, 3, 9-20 [10]. Yong Ding, Li Xiao, "Video On-Demand
Streaming in Cognitive Wireless Mesh Networks", IEEE Transactions on Mobile Computing, vol.12, no. 3, pp. 412-423, March 2013
[11]. Roslin, S.E., "Genetic algorithm based cluster head optimization using topology control for hazardous environment using WSN," in Innovations in Information, Embedded and Communication Systems (ICIIECS), 2015 International Conference on , vol., no., pp.1-7, 19-20 March 2015
[12]. A.S. Uma maheswari, Mrs. S. Pushpalatha,” Cluster Head Selection Based On Genetic Algorithm
Using AHYMN Approaches in WSN”, International Journal of Innovative Research in Science, Engineering and Technology Volume 3, Special Issue 3, March 2014
[13]. Kiranpreet Kaur1, Harjit Singh,” Cluster Head Selection using Honey Bee Optimization in Wireless Sensor Network” International Journal of Advanced Research in Computer and Communication Engineering Vol. 4, Issue 5, May 2015
[14]. R.Aiyshwariya Devi,M.Buvana,” Energy Efficient Cluster Head Selection Scheme Based On FMPDM for MANETs” International Journal of Innovative Research in Science, Engineering and Technology Volume 3, Special Issue 3, March 2014 [15]. Ebin Deni Raj,” An Efficient Cluster Head Selection Algorithm for Wireless Sensor Networks – Edrleach”, IOSR Journal of Computer Engineering (IOSRJCE) ISSN: 2278-0661 Volume 2, Issue 2 (July-Aug. 2012)
[16]. Nabil Ali Alrajeh, S. Khan, and Bilal Shams,” Intrusion Detection Systems in Wireless Sensor Networks: A Review” International Journal of Distributed Sensor Networks Volume 2013. [17]. Ajith Abraham, Crina Grosan, and Carlos
Martin-Vide,” Evolutionary Design of Intrusion DetectionPrograms” International Journal of Network Security, Vol.4, No.3, 2007
[18]. Ioannis Krontiris, Zinaida Benenson, Thanassis Giannetsos, Felix C Freiling, Tassos Dimitriou,” Cooperative Intrusion Detection in Wireless Sensor Networks”, Wireless sensor networks, Springer Berlin Heidelberg,2009 [19]. Djallel Eddine Boubiche and Azeddine
Bilami,” Cross Layer Intrusion Detection System For Wireless Sensor Network” International Journal of Network Security & Its Applications (IJNSA), Vol.4, No.2, March 2012.
[20]. Shio Kumar Singh, M P Singh, and D K Singh,” Intrusion Detection Based Security Solution for Cluster-Based Wireless Sensor Networks” International Journal of Advanced Science and Technology Vol. 30, May, 2011