© 2017, IRJET | Impact Factor value: 6.171 | ISO 9001:2008 Certified Journal | Page 1036
BNTM: Bayesian network based trust model for grid computing
Roya Ghahramani
1, Negar sendani
21,2
Electrical and Electronics Engineering, Istanbul University, Istanbul, Turkey
---***---Abstract -
Grid computing is a new generation ofdistributed information and provides consumers with resources. The trust of each transaction is the probability of successful execution or completion of a given task. In Grid systems with distributed ownership of resources and jobs, the Quality of Service (QoS) and trust in the allocation of resources is important. Some consumers may not want their applications to be mapped to the unreliable resources. Therefore, it requires a reliable system that provides a level of robustness against malicious nodes. In this paper, we propose a new Bayesian Networks-based Trust Model (BNTM) for grid computing. Bayesian networks provide a flexible method for combining different aspects of trust. We use a Bayesian network to represent the trust between users and Grid providers. Trust can be obtained based on environmental conditions and direct interactions between entities in the past, or through indirect interactions between entities. The following parameters are considered as the Quality of Service parameters: Response Time, Availability, Reliability, and Cost and Success Rate. Using comparison between the BNTM and trust model without environmental trust, several experiments conducted and the achieved results indicate that BNTM is efficient in reducing the delay and the job failure rate.
Key Words: Grid computing, trust, Quality of Service, Bayesian network, Reliability, environmental parameters
1. INTRODUCTION
The grid computing is a special kind of distributed computing. In distributed computing, different computers within the same network share one or more resources. Grid computing usually consists of one main computer that distributes information and tasks in a group of networked computers to accomplish a common goal. Grid computing is often used to complete complicated or tedious mathematical or scientific calculations. In an ideal grid computing system, every resource is shared, turning a computer network into a powerful supercomputer. The main purpose of the grid is to use these shared resources such as CPU power, bandwidth, and database and distribute it to the central computer. The grid may have different meanings for different individuals. But, if we want to have a simple definition of grid, we can say that in fact, grid computing allows you to create a large central power by using resource systems connected to the network. This great source has the ability to perform very complex operations the system unable to do alone. So, in the viewpoint of the users of these large systems, this operation is done only via one system.
Some of the nodes in grid computing may be fraudulent or malicious. Resource sharing or having transactions in such an unpredicted environment may lead to adversity. Since all the nodes contained in the grid computing may not be reliable, in a grid computing, trust is one of the key issues in such resource and data sharing environment.
According to [3, 4], the Grid computing paradigm is aimed at (a) providing flexible, secure, coordinated resource sharing among dynamic collections of individuals, institutions and resources, and (b) enabling communities (“virtual organizations1”) to share geographically distributed resources as they pursue common goals, assuming the absence of central location, central control, omniscience, and existing trust relationships [8].
Trust in Grid computing, is dependent on a set of parameters. Dependency between these parameters is very important and vital for calculating the trust in Grid computing environments. Most previous works have offered the trust model, but they have not considered dependencies between the parameters related to trust computing.
A Bayesian network is a probabilistic model that considers the dependencies between parameters. The Bayesian network can also show dependencies between parameters when the inputs are uncertain. The Bayesian network for Grid computing is very convenient, because grid computing is uncertain. Using a Bayesian network, we can infer the exact parameter values at any moment. The exact inference of parameter values helps accurate computation of trust.
The BNTM is concerned with evaluating every request submitted by the user to access a resource and determine the appropriate resource to which the request should be mapped to [5]. This work aims is to provide a trust model for the grid computing that helps the users to identify trusted sources for the implementation work of the user in Grid computing environments. BNTM is based on computing environment of grid infrastructure. The main contribution of this paper is summarized as follows:
Exact inference of parameters associated with the calculation of trust
Using a multilevel Bayesian network for computing trust
© 2017, IRJET | Impact Factor value: 6.171 | ISO 9001:2008 Certified Journal | Page 1037 Using environmental trust for computing the total
trust
Considering various qualities of service aspects for calculation of the subjective trust
2. BNTM
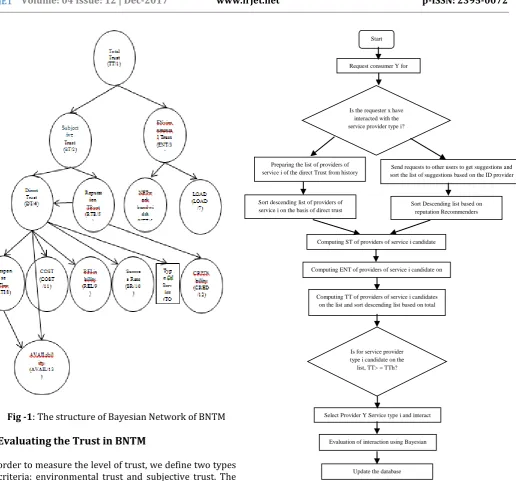
The BNTM is concerned with evaluating every request submitted by the user to access a resource and determines the appropriate resource to which the request should be mapped to. The purpose of this study is to provide a trust model for the grid computing that helps the users identify trusted sources for the implementation work of the user in a grid computing environment. BNTM is based on computing environment of grid infrastructure. The trust of an entity is evaluated as the quantitative value of trust based on the past experiences and the running present environmental condition. The overall trust value is computed with respect to the subjective and environmental trust. This overall trust value is used to select a suitable resource for a job and eliminates run time failures arising from incompatible user-resource pairs. The BNTM will act as a tool to calculate the trust values of the various components of the grid computation and thereby improves the success rate of the jobs submitted to the resource on the grid computing. In grid computing environments, we have two kinds of agent: a service provider and a service consumer. Here, each agent plays only one role at any time: the role of the service provider, or the role of the consumer of the service. Each service provider provides only one type of service.
In BNTM, accessing a resource not only will be based on the identity and behavior of the resource, but also will rely on the context of the interaction, time of interaction, network bandwidth, load on resource, etc. After finding the total trust of the source, the tasks would be allocated to the selected resource for running. The overall trust value is computed with respect to the environmental and subjective parameters. QoS is calculated through the observed values during the execution of tasks by a Bayesian network. The parameters which are considered for QoS include: COST (COST), AVAILability (AVAIL), RELiability (REL), Response TIme (RTI) and Success Rate (SR). QoS parameters are used for selecting the service provider. In addition to quality of service parameters, environmental parameters such as network bandwidth and load on resource were also considered in selection of the service provider. We randomly generated the dataset using the viewpoints of experts in this field. After generating the dataset, Bayesian network structure should be specified. A Bayesian network structure is the relationship between the parameters and the dependencies between them. One problem in using Bayesian network is creating the complete network that can be difficult, even for an expert, to solve. Therefore, many attempts have been made to learn Bayesian networks. In any Bayesian network, the structure and
conditional probability tables are determining factors. Therefore, these two cases should be determined by the learning process.
2.1 Structure Learning
The data set is generated randomly, and at the same time, intelligently. Such that the range of parameters was defined based on other data sets [7, 5] and the theories of experts.
Some parameters such as TOS, are discrete and some other parameters such as, AVAIL are continuous. We normalized value of all parameters to the interval [0 1] so that the implementation comfortable.
Parameters that are considered for the Bayesian network include: Total Trust(TT), ENvironmentalTrust (ENT),SubjectiveTrust(ST),DirectTrust(DT),Reputation TRust (RTR),Response TIme(RTI),Type Of Service(TOS), COST (COST), Success Rate (SR), RELiability (REL), AVAILability (AVAIL), CREDibility (CRED), NETwork bandwidth (NET), LOAD on resource (LOAD). The definition and formulation of the parameters are as follows:
Response time: Response TIme, or RTI is the time that takes between sending a request from a user and receiving it by the provider and is measured in milliseconds.
Availability: AVAILability of a resource, or AVAIL is defined as the ratio of the number of times the resource available to the user, to the total number of times the resource was requested. Availability is expressed by percent.
Reliability: RELiability of a resource, or REL is defined as the ratio of the number of error messages to the all messages, which is expressed by percent.
Success Rate: The Success Rate of a resource, or SR is defined as the ratio of the number of jobs completed successfully, to the total number of jobs submitted to the resource.
Credibility of the recommender: the CREDibility of the recommender’s feedback, or CRED is estimated by considering different parameters, such as similarity and number of useful feedbacks [3].
NETwork bandwidth (NET): Every resource is connected to the grid by a communication link. The network communication speed between a user and a resource is defined in terms of data transferring rate which is expressed in Mbps.
© 2017, IRJET | Impact Factor value: 6.171 | ISO 9001:2008 Certified Journal | Page 1038 There are two ways to construct the structure of a
Bayesian network: manually, by an expert; automatically, by the learning methods. We used the second method to build a Bayesian network. The Bayesian network structure is designed for the relationships between the parameters and their interdependencies. To learn a Bayesian network, if the network structure is clear and observable to all variables, conditional probability tables can be easily learned from the trained data. However, if the network structure is not known, it would be difficult to learn and search methods, such as K2 algorithm are used to search in space of possible structures. Among the search and rating algorithms, K2 algorithm, which creates network structures from the data, is greatly used. As an input, K2 algorithm receives data through the order of node priority and produces the structure of the Bayesian network. Since we were looking to build a Bayesian network, we used Bayes classification algorithm, as well as the Bayesnet sub algorithm in Weka that uses K2 learning algorithm for creating Bayesian network structure. We created Bayesian network structure in the Weka software environment using the K2 algorithm. K2 algorithm receives our dataset as input and produces Bayesian network structure.
One of the filters available in the Weka is discretized filter. Using the discretized filter, values of a continuous attribute can be converted to any number of discrete intervals. Since our attribute values are both discrete and continuous, so we perform data pre-processing using discretized filter. We turned the continuous attribute values such as RTI to the discrete values. For data processing and production graph structure and the relationships between QoS parameters and the environmental parameters considered in the trust model, we used K2 algorithm in the Weka software platform.
2.2 Parameter Learning
When the structure of a Bayesian network is built, the next step is to learn its parameters. Learning the parameters of a Bayesian network determines the distribution of conditional probability for each node. After soft discretization step which converts each training case in the continuous dataset into soft evidence, parameter learning step is performed in BNTM. In BNTM, we use a modification of the Maximum Likelihood Estimation2 algorithm [2] to learn the constructed discrete Bayesian network. This modification enables the MLE algorithm to calculate the discrete conditional probability tables from the discrete cases and to accept soft evidence as its input.
2.3 Inference
To assess the interaction and inference, the BNTM uses discrete software Bayesian network, because the values of its nodes are combinations of discrete and continuous values. This version contains two small modifications [1, 2]: it uses long node names and all nodes are defined for
2 MLE
observation. Since our parameter values are of a mixed discrete-continuous system, we used BNT Soft Discretization Package [1, 2] to create and train the Bayesian network and get inference from the Bayesian network in the MATLAB 2011 environment. This software package consists of: definition of Bayesian network structure, introducing parameters, getting parameters, parameter learning, and ultimately inference from the Bayesian network. In fact, this package converts our discrete parameters to the soft discretization and discretizes all continuous parameters. Inference in BNTM is performed in three steps:
A soft discretization step that converts the continuous variables of the training cases into soft evidence
Inference step that executes the inference algorithm
Conversion of inference results from the discrete network to meaningful continuous output values
Therefore, soft evidence can be introduced as input to the junction tree algorithm. We use the junction tree algorithm as an inference algorithm in BNTM. Junction tree algorithm, developed by Lauritzen and Spiegelhalter [6], is one of the most popular algorithms for a careful inference in Bayesian networks that was developed by Lauritzen and Spiegelhalter [6]. The evidences for inference algorithm in BNTM are dynamic changes in the values of some QoS parameters of candidate grid computing services. The trained Bayesian network and known, as well as unknown parameters are introduced as input into inference, and the values of unknown parameters would be estimated as output.
© 2017, IRJET | Impact Factor value: 6.171 | ISO 9001:2008 Certified Journal | Page 1039
Fig -1: The structure of Bayesian Network of BNTM
3. Evaluating the Trust in BNTM
In order to measure the level of trust, we define two types of criteria: environmental trust and subjective trust. The subjective trust is calculated by combining direct trust and reputation. The value of direct trust obtained as the user satisfaction with the quality of service and by using the Bayesian network after completion of user requests. The process is as follows (Figure 2):
Fig -2: The Flowchart of BNTM
Process is as follows:
First of all, the user x sends the request to the BNTM. The requests kept on the reqt table. Format of user requests is shown in Table 1. TOS is type of service that user request. TOS includes four parameters:
Computer power (CPU)
Data storage
Application
Services
Table -1: Format of user requests
Wqj TTh TOS User id
Request id
Computing ST of providers of service i candidate on the list
Sort Descending list based on reputation Recommenders Is the requester x have
interacted with the service provider type i?
Start
Request consumer Y for service i
Preparing the list of providers of
service i of the direct Trust from history sort the list of suggestions based on the ID provider Send requests to other users to get suggestions and of service i
Sort descending list of providers of service i on the basis of direct trust
Computing ENT of providers of service i candidate on the list
Computing TT of providers of service i candidates on the list and sort descending list based on total
trust
Select Provider Y Service type i and interact with it
Is for service provider type i candidate on the list, TT> = TTh?
Update the database Evaluation of interaction using Bayesian
[image:4.595.50.567.59.540.2] [image:4.595.35.282.89.460.2]© 2017, IRJET | Impact Factor value: 6.171 | ISO 9001:2008 Certified Journal | Page 1040 TTh is the total trust threshold value that is defined by the
user to select a service provider. Wqj represents the weight for the quality (q)j of a service i and 𝑗 *1 2 3 4 5+, which respectively represents the following quality parameters:
j=1; COST, j=2; RTI, j=3; AVAIL, j=4; REL, j=5; SR
When requesting for the service i, the consumer x will specify its level {0, 1, 2}, which means {”not interested”, ”interested”, ”very interested”} for each quality j of service i. For example, if wq2= 1, it means that the useris “interested” about the second parameter of the quality and, the weightis consideredtobe"1"
.
When the requests of user x are received (2), the BNTM is referred to ditt table. The ditt is, in fact, the table for the history of interactions. If the user x has already interacted with a service provider whose service type is of the same type requested by the user x, a list of service providers i
would be provided. This list includes the list of service providers requested (i) that the consumer x is directly interacting with them (3). When the list of service provider candidates and their direct trust is provided, the candidate list is sorted in descending order based on the direct trust (4). But, if a candidate list was empty, the user x sends the request to other users to receive offers (6). Each user that receives the request, provides the list of providers which have interacted with them from table ditt and orders the candidate list based on the credibility of offerers in a decreasing order (7). Now, we calculate the subjective trust of each service provider candidate that is: DT + RTR (8 and 5).
In environmental trust, we have two types of parameters: network bandwidth and the load to resource. Thus, we calculated the environmental trust of the candidate's service (9). Total trust is computed from the combination of subjective trust and environmental trust, and the list of candidates is sorted based on total trust in decreasing order (10). After calculating the total trust, the condition TT> = TT is checked (11). If this was true, the consumer x
selects the provider y of the service i from the list and interacts with it (12). Otherwise, the user x asks other users about the proposal, again (13).
And we will continue this to find the suitable service provider by user requests. After selecting a provider y and interacting with it, the interaction is assessed based on the observed values during the implementation of the service. Observed value is inferred by the Bayesian network (14). If the obtained new direct trust is true on the condition DT> = TTh, it means that the interaction satisfies the user and s=1; Otherwise the interaction is not satisfied the user and s = 0. Finally, after the interaction the Bayesian networks and related tables are updated and, if needed, new records are added to the database (15).
3.1 Subjective Trust
To calculate the subjective trust in the luTl, we considered two types o f trust: direct trust and reputation.
Trust is dependent on some parameters such as load on resource, availability and etc. These parameters are constantly changing. Through these changes, the values of unknown parameters are estimated. f these changes, w e
estimate the values of other parameters that are unknown. f the value of parameters is unknown, we cannot
determine the trust value .
uppose that consumer x requests for the service i. Direct trust is the percentage of interactions which are
satisfacto ry, and measured by the number of satisfying
interactions by the service provider divided by the total number of interactions by the same service provider (equation 1) [11]. In fact, to know whether an interaction was satisfactory or not, we use a Bayesian network.
⁄ (1)
If the user x has not already interacted with the service provider y whose requested service type is not in interaction with that of what requested by the user x, it asks other users to offer some suggestions. When offers are reached from users, we must calculate the reputation trust for every offered service. Reputation trust for service
i in the view of consumer x is calculated from equation 2 [7].
( )
. ( ) (𝑦)/
∑ ( ) (𝑦)
⁄
(2)
Crx(y) is the credibility of consumer y as an offering in the view of consumer x, that is calculated from equation 3 [7].
(𝑦) (y) 𝑤 (𝑥 𝑦) 𝑤 𝑤 𝑤 1
(3)
The usefulness of offering y’s feedbacks are calculated from equation 4[7].
(𝑦) N f(y) Nf(y)
⁄
(4)
The similarity between consumer x and offering y is calculated from equation 5 [7].
© 2017, IRJET | Impact Factor value: 6.171 | ISO 9001:2008 Certified Journal | Page 1041 D(x,y) values can be calculated based on the Euclidean
method that is in the equation 6.
(𝑥 𝑦) ( (𝑥 𝑦) 𝑝(𝑥 𝑦))⁄ 2
(6)
3.2 Environmental Trust
Another type of trust that is considered in the proposed model is environmental trust. Simply taking past experiences into account does not provide an effective way for selecting a resource on the grid. But also environmental execution parameters at the time of allocation of work should be considered equally with subjective trust. The execution parameters are the network bandwidth to which the resource is connected and the load on the resource at the time of job request. The Environmental Trust value (ENT), about a resource can be calculated as equation 7 [5] .
𝑇𝑁 𝑤1 𝑊𝐵𝑝 𝑤2 𝐷𝐴𝑂 𝑝 𝑤1 𝑤2 5(7)
3.3 Total Trust
Finally, we calculate total trust for each candidate service provider. The total trust is a combination of subjective trust and environmental trust. The Total Trust value (TT) of a resource is computed as equation 8 [5].
𝛼 𝛽 𝑇𝑁 𝛼 𝛽 5 (8)
The factor TT varies between 0 and 1. After calculating the total trust, if the total trust value of top service provider in the list of candidates meets the condition TT> = TTh, the desired service provider is selected to interact with the user. Otherwise, the trust model again wants other users to provide suggestions for desired application and trust calculation process is repeated again from the beginning. This process will continue so as to find the appropriate service.
4. Evaluation of interactions using Bayesian
network
After selecting the service provider and interaction, it is time to evaluate the performed interaction in order to assess user satisfaction with the service provider. In this section, using the Bayesian network, we estimate the quality of service parameters during execution and consider these values as the observed values of quality of service parameters. Then, the trust model calculates a rating for the selected service using the weight the user has made in its request for each of the quality of service parameters. Our parameters have combinatory values,
from nodes with continuous values, to nodes with discrete ones. So, we have to use BNT Soft Discretization Package to create and train the Bayesian network and its inference in Matlab 2011. After each transaction, consumer x will provide the rating score Rqj(x,i,u) for each quality j of service i; the rating score Rqj(x,i,u) for each quality j of service i is estimated by using the Soft Discretization Package of Bayesian network (Ebert, 2010) from our Bayesian network. If the service provider's rating is greater than or equal to a trust threshold value defined by the users, the service is satisfactory in this transaction, otherwise it is unsatisfactory. On that basis, the overall rating (𝑥 ) which is given to web service i by the consumer x in transaction u will be calculated as follows [7]:
(𝑥 ) ( ) ∑ (𝑅 ( ) 𝑤 ( ))
𝑛 ∑𝑛 𝑤 ( ))
(9)
TF(x, i, u) is the transaction context factor. To assess a service, we should decay extremely old transactions and feedbacks. Thus, we need a function that may look like the equation 10 [7]. To put it simply, we assume that for all transactions TF =1.
(𝑥 ) . 𝑦( ) ( )/ (10)
After each interaction, the rating of the QoS i was estimated using BNT soft discretization Package [1, 2]. If the service provider's rating is greater than, or equal to, a TTh defined by the users, the interaction is satisfactory; otherwise, it is unsatisfactory.
5. Update
After the transactions, the database tables and Bayesian network data should be updated. The updated Bayesian network has to be trained with new values to be re-trained and be used for the subsequent requests. The tables were updated in the database after completion of every ‘u’ transaction of the resource by various users. Frequent updating’s in the database leads to heavy network traffic in the grid. The following parameters must be updated.
The total number of interactions that the service provider has to participate in (n)
The number of successful transactions that the service provider has to participate in (m)
Direct Trust of service provider (DT)
© 2017, IRJET | Impact Factor value: 6.171 | ISO 9001:2008 Certified Journal | Page 1042
6. Simulation and Results
In this section, we discuss the evaluation of the BNTM. Since there is no similar work in grid computing, no comparison is made. The evaluation takes place by comparing the BNTM with the trust model without environmental trust. BNTM, in addition to being a subjective trust, is considered an environmental trust for the requests in selecting the service provider. In general, two types of trust models have been compared. Trust model One, which just considers subjective trust on selecting the service provider to the request received by the trust model. Trust Model Two, which is BNTM and is considered an environmental trust for requests for selecting the service provider, in addition to subjective trust. The first experiment was made to three applications for both trust models. The second experiment is simulated for implementing the trust model on the average of 20 times. We want to review the effects of the environmental trust on the BNTM and on the trust model without environmental trust. The resource allocation process was simulated using a discrete event simulator with the request arrivals modeled using a Poisson random process. The simulation model includes a number of users and sources that send and receive job, communicating with each other. The estimated value is obtained by multiplying the probabilities of the state means and adding the result, which yields an expected value. The estimated value, thus, provides a continuous output. In our simulations, this continuous value was always fairly close to the actual value.
6.1 Experiment І
[image:7.595.326.537.369.508.2]This experiment includes simulation of three requests received by the trust model. These requests have been implemented for both trust models and the implementation results have been expressed in the following. In fact, we compared BNTM with the trust model that only considers subjective trust in selecting the service provider (trust model without environmental trust). Requests to the trust model are shown in Table 2. All three requests have been those of the type 3 Service.
Table -2: Requests received by trust model
Wq TTh
Type of service user
ID COST RTI AVAIL REL SR
0 1 0 1 1 0.6902 3 1 0 2 1 0 0 0.9035 3 2 0 0 2 0 1 0.8113 3 3
Candidate service for the first request is shown in Table 3. When both trust models were calculated for the total trust, it selects the top candidate from the list of candidate services. In selecting the service provider, Trust Model One considers subjective trust as a total trust.
Condition TT> = TTh is reviewed. If this condition was true, it would be selected by it and interacts with it.
Table-3: Candidate service for first request, sorted
descending order by total trust value
tleles le lste tsts ( ) evnotlvnl vste tsts tsejles onl tsts ( ) ypl lf tltno el f lf tltnoel ptlnoel t 1 0.73 75 0.8500 0.6250 3 2 1 0 0.65 00 0.3 1 3 112 2 0 0.57 50 0.5500 0.6000 3 4 3
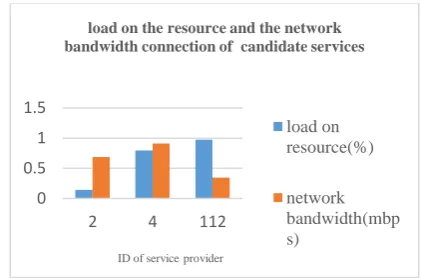
According to Table 2, the Trust Model One chooses service provider 112 for the first request. According to Table 3, the Trust Model Two selects the service provider 2 for the first request. Figure 3 is related to the load on the resource and the bandwidth connection to all three candidates for the first request.
Fig -3: load on the resource and the network bandwidth
connection to all three candidates for a First request.
As shown in Figure 3, the selected service provider by the BNTM (the service provider 2) has the lowest load among candidate services and has higher bandwidth, compared with the selected service provider of The Trust Model One (the service provider 112). Although the service provider 112 has higher direct trust compared with other candidate service providers, the amount of load on it is close to 100%. This amount of load on the resource increases the probability of failure with the running of the service. Although the direct trust of service provider 2 is less than direct trust of service provider 112, the amount of load on it is close to 0 percent, so the probability of failure during the execution of the service is close to zero. Candidates’ services for the second request is shown in Table 4.
0 0.5 1 1.5
2 4 112
ID of service provider
load on the resource and the network bandwidth connection of candidate services
load on resource(%)
[image:7.595.31.293.621.684.2]© 2017, IRJET | Impact Factor value: 6.171 | ISO 9001:2008 Certified Journal | Page 1043
Table -4: Candidates services list for the second
request,tltsle descending order by total trust value.
tleles le lste tsts ( ) evnotlv nlvste tsts tsejleso
nl tsts ( ) ypl lf tltno el f lf
tltnoe l ptlnoe lt 1 0.9250 0.8500 1 3 10 1 0 0.8500 0.7000 1 3 14 2 0 0.7250 0.4500 1 3 22 3
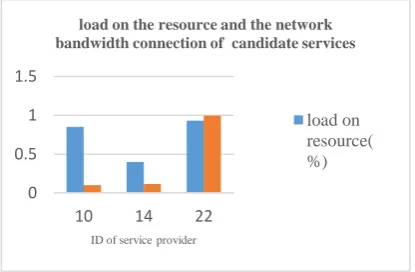
According to Table 4, Trust Model One selects the service provider number 10 for the second request. The BNTM selects the service provider 10 to the second request, as well. Figure 4 is related to the load on the resource and the bandwidth connection to all three candidates. As shown in Figure 4, the amount of load on resource on the service provider 10 is the least and BNTM has chosen it for the second request. The bandwidth connectivity of service provider 22 is a little more than bandwidth connection of service provider 10, but the amount of load on it is close to 100%. This has led the BNTM to choose the service provider 10 for the second request.
Fig -4: load on the resource and the bandwidth connection
to all three candidates for a Second request.
The list of candidate services for the third request is shown in Table 5. According to Table 6, the Trust Model One selects the service provider 22 for the third request and for the BNTM, and the service provider 37 is selected for the third request.
Table -5: Candidate services list to third request,
tltsle
descending order by total trust value.
tleles le lste tsts ( ) evnotlv nlvste tsts tsejleso
nl tsts ( ) ypl lf tltno el f lf
tl tnoe l ptlnoe lt 1 0.8250 0.6500 1 3 37 1 0 0.7250 0.4500 1 3 22 2 0 0.7084 0.7500 0.6667 3 39 3
[image:8.595.330.536.246.392.2]Figure 5 shows a diagram of load on the resource and a bandwidth connection to all three candidates for the third request. The BNTM has selected the service provider 37 for the third request, while the Trust Model One has the service provider 22 for the third request. The bandwidth connectivity of the service provider 37 is slightly less than bandwidth connection of the provider 22, but the load on it is much lower than the load on the resource 22. According to the third request, the service provider number 37 is the best option in the candidate list of service providers. This has led the BNTM to select the service provider number 37, instead of the service provider number 22.
Fig -5: load on the resource and the bandwidth connection
to all three candidates for a third request.
6.2 Experiment ІІ
To study the efficiency of the BNTM, we run the program for 20 times for two trust models, BNTM and trust model, without environmental trust. In each run, we responded 150 request received by the system. In each run, the parameter means for 150 responded requests was calculated. This section contains charts for the average amount of load, the bandwidth and the success rate of selected services for 20 times run. In each run, 150 requests by the user have been responded. The load on a resource is estimated based on the observed load conditions (%). The Load on resource represents the number of active jobs currently running on the resource. Assigning requests to a resource with a light load minimizes the response time of the request. In many cases, a resource with a very good trust rating may be heavily loaded, and hence it cannot provide a satisfactory service. The BNTM aimed to reduce the runtime failure of services to a large degree. As shown in the diagram of Figure 6, the amount of load on the resources taken in the BNTM, is much less than that of load on the resources selected by the Trust Model One. As we know, as the load on the resource increases, the job failure rate increases as well. In fact, the BNTM reduces the success rate of the tasks. The diagram in Figure 6 shows that using the BNTM Trust Model and selecting a resource with a low amount of load, we minimized the runtime failure rate of tasks. 0
0.5 1 1.5
10 14 22
ID of service provider
load on the resource and the network bandwidth connection of candidate services
load on resource( %) 0 0.5 1 1.5
22 37 39
ID of service provider
load on the resource and the network bandwidth connection of candidate services
load on resource(%)
[image:8.595.58.266.391.527.2]© 2017, IRJET | Impact Factor value: 6.171 | ISO 9001:2008 Certified Journal | Page 1044
Fig -6: Average load on the choices resources for two trust
model of 20 times run
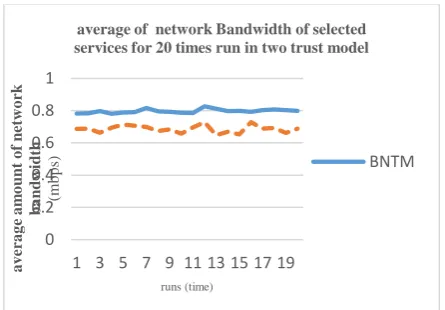
[image:9.595.46.281.59.230.2]The network communication speed between a user and a resource is expressed as data transferring rate (expressed in mbps). The resource is connected to the grid by a communication link. The bandwidth changes from one link to another. Bandwidth is the other environmental parameter of services that was involved in the calculation of total trust. It is expected that by using the BNTM Trust Model, the services with good bandwidth will be chosen. The result of an average of 20 times run for 150 requests for both trust models has shown in Figure 7.
Fig -7: Average bandwidth connection diagram for both
model trust
As shown in Figure 7, the bandwidth for selected services to user requests has increased in the BNTM in comparison with the Trust Model One. It can be concluded that the delay in the BNTM is reduced, compared with Trust Model One. As expected, when the load on the resource is reduced, the work failure rate reduces as well, and user satisfaction increases. To show this issue, in Figure 8 we draw the diagram of users’ satisfaction in the BNTM and in the Trust Model One, that is a trust model based on the subjective trust.
Fig -8: Chart of user satisfaction of selected services
As Figure 8 shows, the level of user satisfaction with the selected services for the request of users has been improved in the BNTM, compared with the Trust Model One in general.
7. Conclusion and future work
Since the high load on the resource may result in the failure of the running job in the trusted grid environment, we included this parameter in the calculation of trust. As a result, the job failure rate in the BNTM declined compared with other trust models based on Bayesian network that only considers subjective trust in the selection of the service provider. We consider the network bandwidth criterion in order to reduce the delay and maximize the grid utilization. BNTM is in relation to the user trust on the service provider in the grid calculation. As a future work, we can include in the BNTM the trust of service provider on the user, in addition to user’s trust on the service provider. Also, you can consider further parameters, such as waiting time of service, the importance of user requests, etc. to select a service provider on a user's request.
REFERENCES
[1] Ebert-Uphoff, I. (2009a). A probability-based approach to soft discretization for bayesian networks. Atlanta, GA (USA).
[2] Ebert-Uphoff, . (2009b). User’s Guide for the luT oft Discretization Package (Version 1.0).
[3] Foster, I., Kesselman, C., Nick, J., & Tuecke, S. (2004). The physiology of the grid: An open grid services architecture for distributed systems integration. 2002. Globus Project.
[4] Foster, I., Kesselman, C., & Tuecke, S. (2001). The anatomy of the grid: Enabling scalable virtual organizations. International Journal of High Performance Computing Applications, 15(3), 200– 222.
0 0.2 0.4 0.6 0.8
1 4 7 10 13 16 19
ave
rage
am
ou
n
t
of
l
oad
on
r
es
ou
rc
es
(%)
runs (time)
average amount of load on selected services for 20 times run in two trust model
BNTM
0 0.2 0.4 0.6 0.8 1
1 3 5 7 9 11 13 15 17 19
a
v
er
a
g
e
a
m
o
u
n
t
o
f
n
et
w
o
rk
b
a
n
d
w
id
th
(mb
p
s)
runs (time)
average of network Bandwidthof selected
services for 20 times run in two trust model
BNTM
0 0.2 0.4 0.6 0.8
1 4 7 10 13 16 19
A
v
er
a
g
e
o
f
u
ser
sa
ti
sf
a
ct
io
n
run
Average of user satisfaction for 20 runs for both trust model
[image:9.595.50.273.411.566.2]© 2017, IRJET | Impact Factor value: 6.171 | ISO 9001:2008 Certified Journal | Page 1045 [5] Kavitha, G., & Sankaranarayanan, V. (2010). Secure
resource selection in computational grid based on quantitative execution trust. World Academy of Science, Engineering and Technology, 72, 149–155.
[6] Lauritzen, S. L., & Spiegelhalter, D. J. (1988). Local computations with probabilities on graphical structures and their application to expert systems. Journal of the Royal Statistical Society. Series B (Methodological), 157–224.
[7] Nguyen, H. T., Zhao, W., & Yang, J. (2010). A Trust and Reputation Model Based on Bayesian Network for Web Services. In Proceedings of the IEEE International Conference on Web Services (pp. 251–258). IEEE. http://doi.org/10.1109/ICWS.2010.36
[8] Papalilo, E., & Freisleben, B. (2004). Towards a flexible trust model for grid environments. In Grid Services Engineering and Management (pp. 94–106). Springer.
[9] Srivaramangai, P., & Srinivasan, R. (2010). Reputation based two way trust model for reliable transactions in grid computing.
[10] Vivekananth, P. (2010). A Behavior Based Trust Model for Grid Security. International Journal of Computer Applications, 5, 1–3.
[11] Wang, Y., & Vassileva, J. (2003a). Bayesian network-based trust model. In Web Intelligence, 2003. WI 2003. Proceedings. IEEE/WIC International Conference on (pp. 372–378).