Journal of Criminal Law and Criminology
Volume 59 | Issue 1
Article 4
1968
Age Composition and Patterns of Change in
Criminal Statistics
Philip C. Sagi
Charles F. Wellford
Follow this and additional works at:
https://scholarlycommons.law.northwestern.edu/jclc
Part of the
Criminal Law Commons
,
Criminology Commons
, and the
Criminology and Criminal
Justice Commons
This Article is brought to you for free and open access by Northwestern University School of Law Scholarly Commons. It has been accepted for inclusion in Journal of Criminal Law and Criminology by an authorized editor of Northwestern University School of Law Scholarly Commons.
Recommended Citation
AGE COMPOSITION AND PATTERNS OF CHANGE
IN CRIMINAL STATISTICS*
PHILIP C. SAGI um CHARLES F. WELLFORD
Philip C. Sagi is Professor of Sociology in the Department of Sociology and Co-Director of the Population Studies Center at the University of Pennsylvania. His continuing research activities have resulted in books and articles in the areas of demography, methodology and statistics.
Charles F. Wellford is a doctoral candidate in the Department of Sociology at the University of Pennsylvania, specializing in Criminology and an Assistant at the Center for Studies in Criminology and Criminal Law.
In an attempt to provide a more accurate view of the increase in recorded crime during the period 1958-1964, the authors calculated age specific, offense specific crime rates. The analysis of the rates in-dicate that 30-50% of the increase in absolute crime over the years 1958-1964 can be attributed to changing age structure in the U.S.A., and that any measure of crime patterns must be interpreted with caution due to the presence of a two year cycle in rates of recorded crime. The remainder of the article discusses some structural correlates of this periodicity in crime rates.
The volume of criminal offenses in a population may be expressed in terms of three factors. These are: the productivity of criminal offenses per person at each age (the age specific offense schedule), the age structure or the proportion of the total tion in each age group, and the size of the popula-tion in quespopula-tion. It follows that a change in the volume of criminal offenses may occur if any one factor or if a combination of these factors under-goes change. Thus, an increase in the volume of crime in a population can result from an increase in the size of the population and/or shifts in its age composition, without a concomitant change in the productivity of criminal offenses per person at each age. (There are of course other possibilities; for example, changes in the age specific criminal offense schedule may not show up in statistics describing volume of crime if there are offsetting changes in age composition.) The realistic expecta-tion is that age specific offense rates, age composi-tion, and size of population vary from year to year. To assess the productivity of offenses per person we must analyze the contribution of each of these factors to changes in the total volume of offenses. From the academic point of view such assessments make more precise our knowledge of causes of fluctuations in the volume of offenses. From the applied view, there is the potential of using the knowledge gained in more rational planning.
* This paper is a revised version of a project com-pleted for the President's Commission on Law En-forcement and the Administration of Justice. While we acknowledge their support, the results and interpreta-tion are the authors' and not those of the Commission.
At least for the immediate future the volume of serious criminal offenses will rise even if the age specific offense schedule remains fixed (an ad-mittedly unlikely assumption). The increase in volume will in part be determined by the continued increase in the size of the age groups most prone to committing offenses. Prior birth rates are the main cause of the increase in numbers and there-fore, some portion of the increase in volume of offenses It is possible to forecast the size and age composition of the population for as many as ten years into the future by simply aging the popula-tion distribupopula-tion reported in the census. The major problem in predicting the extent of crime is the age specific offense schedule. It represents the area of greatest uncertainty and deserves the immediate focus of attention. A portion of this research was addressed to this task.
The other focus of this project was the assessment of the potential effects of changing age composi-tion on changes in volume of estimated offenses and arrests. In the process of achieving this aim techniques known to demography were adapted and applied to age and crime specific reports of arrests as presented in the Uniform Crime Reports for the years 1958 through 1964.
The degree of precision in estimation can not be
I The study of the relation between offenses recorded
PHILIP C. SAGI AND CHARLES F. WELLFORD
evaluated. Whatever weaknesses are characteristic of data collected for the Uniforin Crime Reports are inherent as well in our research.2
In addition, the techniques employed in the analysis reported here are not as refined as is desirable. Nevertheless, three worthwhile results are seen. Firstly, the order of magnitude of effects of changing age distribu-tion can be assessed without the requirement of precise figures for arrests or offenses. Secondly, the results appear to justify greater attention being paid to alternate techniques of data analysis even if the data cannot be immediately improved. Thirdly, techniques employed in this study suggest what appear to be improvements in the quality of data collection and reporting.
ANALYSES OF DATA
The statistics and statistical procedures we adapted from demography were applied to data reported in the series of UCR publications covering the period 1958 through 1964. These publications contain estimates of clearance rates for each type of index offense as well as age specific arrest rates by size of reporting areas. Throughout the analysis, data on arrests in cities of 2500 or more were selected (to preserve some comparability) and in-flated to represent the United States population as a whole. As indicated in later portion of this paper, these procedures appear not to meaningfully in-fluence the measurement of change in crime rates or the volume of crime.
Once decisions on choice of data were made, the rote application of the various computational schemes followed. Tables reported the variation among the years 1958-1964 in the values of total volume of offenses, total offense rates and offense ratios were constructed to demonstrate facets of the rise in arrests and offenses committed for the period under study. The thrust of the analysis is twofold. First there is the evaluation of the effect of age composition and size of population on changes in the crime rate. Second, there is the evaluation of the pattern of change over time in statistics describing the rate of crime.
The first concern, the effects of age composition and size of population on apparent changes in the volume of crime or arrests, requires not direct confrontation with the question of reliability (or validity) in the reporting of offenses or arrests. The order of the effects of age composition and size of population may be assessed, though not precisely,
2For a more detailed discussion see the Appendix.
by comparing magnitudes of statistics that do and do not take into account these demographic facts. The second concern is with the pattern of change over time in statistics describing arrests or offenses. Attention is fixed on the explanation of temporal variation in the value of a statistic rather than differences among different statistics during some time interval.
PATTERN OF CHANGES m CRnmn RATES AND
VOLUME OF CRIME
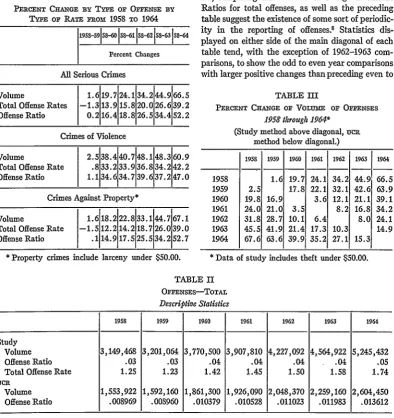
Data presented in Table 1 display changes in offense rates in the period 1958-1964, with the constant base year being 1958. These statistics are being compared in each column of the table. The volume of offenses in all columns shows the greatest change over the years3 The change reflects possible increases in the propensity toward crime by indi-viduals, the increase in the number of individuals producing crimes, and changes in the age composi-tion of the populacomposi-tion. The Total Offense Rate takes into account both changing numbers and changing age composition.4 As such, the Total Offense Rate displays the smallest amount of in-crease, being from 30-50% lower than the other measures. The Offense Ratio adjusts for the numbers of persons in the crime prone ages only (ages 10-50). It yields intermediate values for the changes in offenses over time.
The analysis so far does not require great ac-curacy in the reporting of offenses provided there is a concession that offenses vary greatly with age and that some age groups are vastly more crime productive than others. Thus, even if the offenses are not accurately recorded, comparisons among estimates in columns at least show the potential effects of changing size and age composition. The analysis to this point demonstrates the importance of age composition.
Intermediate statistics that give rise to part one of Table I and to subsequent tables are presented in Table II.' These intermediate statistics allow a quick appraisal of the impact of differing pro-cedures in the estimation of volume of offenses (as noted in the appendix). It can be seen that though
3 The percentage change in volume differs from ucR
estimates for reasons that are explicitly stated in the Appendix. For the discussion at hand the difference be-tween these estimates and the ucR estimates is not
meaningful.
4 All statistics are described in the Appendix.
" Similar tables were constructed for crimes of
vio-lence and crimes against property. These are available
by request.
TABLE I
PERCENT CHANGE BY TYPE O OFFENSE BY TYPE oF RATE ROM: 1958 TO 1964
1958-59158-60 158-61158-62 158-63 158-64
Percent Changes
All Serious Crimes
Volume 1. 619.7 24.134.2 44.9 66.5
Total Offense Rates -1.3 13.9 15.8 20.0 26.639.2 Offense Ratio 0.2 16.4 18.8 26.5 34.4 52.2
Crimes of Violence
Volume 2.5 38.4 40.7 48.148.3 60.9 Total Offense Rate .8 33.2 33.9 36.8134.2 42.2
Offense Ratio 1.134.6 34.7 39.6 37.2 47.0
Crimes Against Property*
Volume 1.6 18.2 22.8 33.1 44.767.1 Total Offense Rate -1.5 12.2 14.2 18.7 26.039.0
Offense Ratio .1 14.9 17.5 25.5 34.2 52.7
* Property crimes include larceny under $50.00.
IV, comparing the behavior of change in Offense Ratios for total offenses, as well as the preceding table suggest the existence of some sort of periodic-ity in the reporting of offenses8 Statistics dis-played on either side of the main diagonal of each table tend, with the exception of 1962-1963 com-parisons, to show the odd to even year comparisons with larger positive changes than preceding even to
TABLE III
PERCENT CHANGE OF VOLUME OF OFIENSES
1958 through 1964*
(Study method above diagonal, uca method below diagonal.)
1958 1959 1960 1961 1962 1963 1964
1958 1.6 19.7 24.1 34.2 44.9 66.5
1959 2.5 17.8 22.1 32.1 42.6 63.9 1960 19.8 16.9 3.6 12.1 21.1 39.1 1961 24.0 21.0 3.5 8.2 16.8 34.2 1962 31.8 28.7 10.1 6.4 8.0 24.1 1963 45.5 41.9 21.4 17.3 10.3 14.9 1964 67.6 63.6 39.9 35.2 27.1 15.3
* Data of study includes theft under $50.00.
TABLE II OFFENSES-TOTAL
Descriptive Statistics
1958 1959 1960 1961 1962 1963 1964
Study
Volume 3,149,468 3,201,064 3,770,500 3,907,810 4,227,092 4,564,922 5,245,432
Offense Ratio .03 .03 .04 .04 .04 .04 .05
Total Offense Rate 1.25 1.23 1.42 1.45 1.50 1.58 1.74
UCR
Volume 1,553,922 1,592,160 1,861,300 1,926,090 2,048,370 2,259,160 2,604,450 Offense Ratio .008969 .008960 .010379 .010528 .011023 .011983 .013612
magnitudes of volume of offenses greatly differ, percentage changes (with few exceptions) over time do not. The per cent increase for all offenses derived from the two methods as compared in Table ]1. 6 For reasons that are not entirely apparent, 1959-1960 comparisons are most inconsistent.7 Similar patterns obtain in tables displaying per cent changes in Offense Ratios. The greatest inconsist-ency again appears in the 1959-1960 period. Table
0 Similar tables are available for crimes of violence
and crimes against property.
7The inconsistency is probably due to the over-estimation of Robbery in the United States as a whole when inflating data for cities 2500 and over.
odd year changes. That is to say, the per cent changes 1958-1959 is small compared to 1959-1960 and so on alternating up to 1962-1963 when exceptions are consistently seen. Subsequent tables (which are offense specific) employing Total Offense Rates demonstrate the periodicity for some crimes even for the 1962-1963 years (Table V).9 As can be seen, the pattern is particularly apparent in the crimes of violence. Thus, when age composition is
8 The same pattern is observable in the violent and
property crimes considered separately. (Tables avail-able by request.)
[image:4.431.14.409.45.464.2]PHILIP C. SAGI AND CHARLES F. WELLFORD
TABLE IV
PERCENT CHANGE OF OFFENSE RATIO FOR TOTAL OFFENSES
1958 through 1964
(Study method above diagonal, uCR method below diagonal.)
1958 1959 1960 1961 1962 1963 1964
1958 .2 16.4 18.8 26.5 34.4 52.2 1959 -. 10 16.2 18.6 26.3 34.1 51.9 1960 15.7 15.8 2.0 8.7 15.5 30.8 1961 17.4 17.5 1.4 6.5 13.2 28.1 1962 22.9 23.0 6.2 4.7 6.2 20.3 1963 33.6 33.7 15.5 13.8 8.7 13.2 1964 51.8 51.9 31.2 29.3 23.5 13.6
to examine arrest rates for white and Negro com-bined, arrest rates for Negroes, patterns of change in clearance rates, changes in percentages of uni-formed and civilian employees, and changes in percentages of population covered by the UCR."
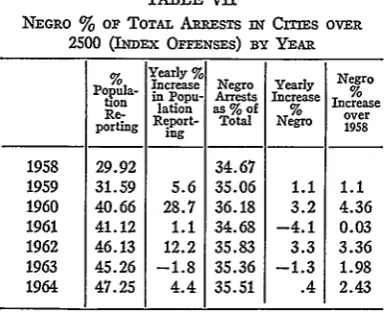
In brief, for the period 1958 to 1964 inclusive, our explorations show no convincing pattern of periodicity in arrest rates of whites and Negroes combined. (See Table VI.) However, Table VII shows a periodicity for arrests in the case of Negroes that complements the previously described offense patterns. Thus, when the total offense rate is increasing rapidly, the rate of negro arrests is also disproportionately increasing.
The lack of pattern for all arrests and the pattern
TABLE V
PERCENT CHANGES IN OFFENSES OF VIOLENCE (above diagonal) AND OFFENSES AGAINST PROPERTY (below diagonal)
(Using Total Offense Rates-1958 through 1964)
1958 1959 1960 1961 1962 1963 1964
1958 .847 33.216 33.909 36.807 34.21 42.19
1959 -1.47 32.097 32.78 35.658 33.08 40.999
1960 12.236 13.91 .52 2.696 .747 6.739
1961 14.236 15.94 1.78 2.16 .225 6.186
1962 18.7 20.4 5.7 3.9 -1.897 3.936
1963 25.989 27.87 12.25 10.228 6.2 5.947
1964 38.98 41.059 23.829 21.66 17.1 10.31
controlled for comparative purposes, the cycle in reported offenses becomes increasingly obvious. Of course, these tables offer no explanation of the cycle.
THE QUESTION OF PERODICrrY The unanticipated observation of a periodicity in changes in offense rates (the rise in rates from odd to even years being greater than from even to odd years) indicates the need for caution in interpreting changes in offense rates whether the rates are those reported in the UCR or those presented in this paper adjusted for changes in age composition.10
One explanation of the observed periodicity is that crime follows a two year cycle, but this explanation ranks low in credibility.
Our efforts to find more reasonable causes led us
10 Since the original form of this report was prepared for the President's Commission on Crime, 1965 and 1966 rates have been released. These too follow the indicated pattern.
TABLE VI
PERCENT CHANGE IN TOTAL ARREST RATE FOR INDEX OFFENSES
1958 1959 1960 1961 1962 1963 1964
1958 1.5 14.3 21.2 17.3 22.7 28.1 1959 12.6 19.3 15.5 20.8 26.1
1960 6.0 2.6 7.3 12.1
1961 -3.2 1.2 5.7
1962 4.6 9.2
1963 4.4
1964
for estimated offenses is in part related to clearance rates. (Roughly, a clearance is an offense known to police cleared by an arrest for the offense.) There
n It may occur to the reader that the two year cycle
suggests an election year phenomenon. Data bearing on this observation are being collected for analysis at a further date by the writers. Also, the cycle may reflect in part the variation due to the fluctuations in the re-porting population (Table VIi). However, in either case there are similar effects on the ucR statistics.
TABLE VII
NEGRO
%
or TOTAL ARRESTS IN CITIES OVER2500 (INmEx OFFENSES) BY YEAR
% Yearly Negro
Popula- Increase Negro Yearly
in Popu- Arrests Increase In
Re- aion as % of % crease
porting Report- Total Negro over
p Ing g 1958
1958 29.92 34.67
1959 31.59 5.6 35.06 1.1 1.1 1960 40.66 28.7 36.18 3.2 4.36
1961 41.12 1.1 34.68 -4.1 0.03 1962 46.13 12.2 35.83 3.3 3.36 1963 45.26 -1.8 35.36 -1.3 1.98 1964 47.25 4.4 35.51 .4 2.43
be generated by periodically improved reporting and recording of offenses without attendant im-provements in apprehension.
There is some evidence that the periodicities just mentioned are related to changes in per cent in-creases in personnel employed by police. Table IX shows that the yearly per cent increase in uni-formed personnel shows periodicity, with the larger increases in the even to odd years, while civilian personnel per cent yearly increases follow the pattern observed in the offense ratio and total offense rate except for the 1961-62 period.1 2 The apprearance of periodicity in the instances just presented, as well as in percentages of population
TABLE VIII
CLEARANCE RATES BY TYPE OF OFFENSE BY YEAR
Man-Agratd Brar Lacn
Year Murder saughter by Forcible Rape Robbery Agauated Lre Auto Theft
Negligence eft
1958 94 90 73 43 79 30 20 27
1959 93 89 74 43 79 31 21 26
1960 92 83 73 39 76 30 20 26
1961 93 87 73 42 79 30 21 28
1962 93 81 66 38 76 28 20 25
1963 91 84 69 39 76 27 20 26
1964 90 86 67 37 74 25 19 26
TABLE IX
PER CENT INCREASE POLICE PERSONNEL
(Uniformed Police Employees Above Diagonal, Civilian Below Diagonal)
Years Base
Year
1958 1959 1960 1961 1962 1963 1964
1958 4.2 7.8 13.5 12.5 16.2 15.1
1959 6.9 3.5 8.9 8.0 11.5 10.4 1960 27.3 19.1 5.3 4.4 7.8 6.7
1961 29.6 21.3 1.8 -. 8 2.4 1.4 1962 31.4 23.0 3.2 1.4 3.4 2.2 1963 35.7 27.0 6.6 4.8 3.3 -1.0 1964 41.9 32.8 11.5 9.6 8.0 4.6
is a tendency to have lower clearance rates on even years than odd years. Furthermore, since 1958, clearance rates appear to be on the decline (see Table VIII). Hence, the inverse relationship be-tween changes in clearance rates and offense rates without similar changes in overall arrest rates can
covered by the UCR (Table VII) suggests certain cautions in the interpretation of crude or refined offense rates which we can now outline.
12 Operating on assumptions similar to those used in estimating total offenses for the entire population, we
can arrive at an estimated number of police employees
in the United States for the years 1958-1964. This figure includes uniformed and civilian employees. Using the percentages of civilian employees reported in the ucR, the number of civilian and uniformed can be estimated as well.
[image:6.431.15.209.49.205.2]PHILIP C. SAGI AND CHARLES F. WELLFORD
SPECULATIONS
Data examined for this study suggest that re-ports on offenses are not reliable indices of the level of crime or changing rates of crime in the United States. The main evidence for this point of view is the periodic pattern of change in the volume of crime as well as in measures of crime adjusted for age compositional changes. The crux of the problem in the reliability or accuracy of statistics on crime appears to be the suspected gaps between com-mitted offenses and reported offenses and between reported offenses and recorded offenses. The sizes of these gaps are unknown.13 If such gaps exist and they are relatively large, then certain ramifica-tions follow as reasonable possibilities. Firstly, with improvements in the system of recording offenses, the volume of offenses reported in UCR will increase whether or not there has been a true increase in committed offenses. That is to say, improvements in recording offenses primarily narrows the gap between reported and recorded offenses. Secondly, without attendent increases in the ability to dear crimes through arrests, im-provements in the recording of offenses result in an apparent drop in clearance rates.4 Thirdly, for reasons that are not fully explained, there are periodic spurts in the recording of offenses. Such spurts are also made possible by the gaps or reservoirs of previously unreported and/or un-recorded offenses.5 These three possibilities may account in a general way for the patterns of growth and fluctuations in data previously discussed.
These uncertainties make it virtually impossible to estimate the change in the crime productivity of each age group. The undesirable consequence of a constantly improving reporting system is that for the while at least, offense rates will appear to rise if only from improved recording. However, as the
13 Recent research has indicated that the gaps do exist and are, in the case of index offenses, of
consider-able magnitude. See, Enis, Crinimal Victimization in
the United States: A Report of a National Survey, U.S.
Government Printing Office, 1967.
14 The number of police employees per 1000 popula-tion or 1000 persons in the crime prone ages in selected cities has remained virtually constant between 1958 and 1964 according to UcR. One would suppose, there-fore, that the ability to clear offenses by arrests has also been largely constant during this period.
11 The victimization research in Washington, D. C. suggests that recording practices of police "are a much greater source of spurious change" then the non-re-porting by victims. See Biderman, et al. Report on a
Pilot Study in the District of Columbia on Victimization
and Attitudes Toward law Enforcement, U.S.
Govern-ment Printing Office, 1967, p. 111.
gap closes, those conditions that would assure meaningful comparisons are also approached.
Finally, we find that variations in the estimates of the increase in crime and the police employee data exhibit patterns whose similarity cannot be considered fortuitous or artifacts of our method-ology alone. The analysis of police employee data indicates that some proportion of the increase in crime described in traditional measures of crime increase can be attributed to changes in the occupa-tional composition of police systems. This suggests further investigation of other system characteristics and their influence on the extent of known and reported crime.
CONCLUSIONS
Despite serious reservations, first with respect to bias in recorded data on offenses, and second with respect to operations performed on these data, such as inflating reported data on arrests to yield offenses and further inflating to yield offenses for the U.S. as a whole, certain conclusions appear warranted. These are:
1. That, as measured by the Total Offense Rate, changes in per person proneness toward com-mitting offenses appears less (perhaps 30-50 per cent less) than are changes in the per person offense rate recorded in the UCR. That is to say, in the year 1958-1964 two facts contribute to the dif-ference between the two rates. First, some portion is explained by the changes in the size of the population from one year to the next. Second, the remaining portion is accounted for by the procedure that adjusts for different numbers or proportions in each age category.
2. An understanding of what factors affect changes in offense rates is enhanced by the calcula-tion of rates such as the Total Offense Rate.
3. There exists a periodicity to the recording of offenses known to police. An important correlate of this periodicity appears to be the patterns of increase in police employees, civilian and uni-formed. The mechanism linking civilian employee changes to recording is not known. Nor is it known why there are periodic increases in the estimated number of civilian employees.
4. The analysis leads to a pessimistic view of the validity of using UCR data for estimating the rate of growth of either volume of offenses or crime proneness of individuals. Without techniques for the correction of year-to-year changes in bias in
the recording of offenses, neither a true rate of growth of volume of offenses nor a true rate of growth for the Total Offense Rate can be ex-tracted from available data.
5. Finally, given laudable improvements in the police system of reporting and recording offenses, a
continued apparent increase in estimated offenses will result. The consequence of such growing efficiency is the continuing drop in clearance rates. Therefore, a drop in clearance rates is not a sure measure of increasing police load or loss of efficiency in apprehension.
APPENDIX
CALCULATioN OF TOTAL OFENSE RATE BASED oN UCR DATA
Because of limitations of data as well as knowl-edge, several assumptions have been made to facilitate the calculation of age specific and offense specific offense rates. At first glance the assump-tions appear outrageous but reasons can be ad-vanced to modify that impression.
These assumptions are:
1. Clearance rates do not vary with the age of offenders within each type of offense. That is to say, if the clearance rate for murder is 90%, it is 90% regardless of the age of the offender (no doubt the assumption is false).
2. The time interval between an offense and an arrest for that offense is minimal. Therefore, age at arrest closely approximates age at offense.
3. The age composition in reporting areas (those
covered in the UCR) is representative of the nation as a whole.
4. Arrests per person at each age for each offense in reporting areas is equal to the age specific offense specific rates for the nation as a whole.
Those considerations that make these assump-tions somewhat acceptable are, respectively:
1. While clearence rates probably do vary with
age of the offender, offenses tend to duster within certain ages and thus, the clearance rate for the offense is determined in large part by the clearance rate found at the modal age.
2. It seems reasonable to assume that the majority of offenses are cleared by arrests within a brief period of time if they are cleared at all.
3. While there is variation in age composition from area to area, age compositions in general show some invariance. They tend to show decreas-ing numbers or proportions with age.
4. There are differences in arrest rates and offense rates from area to area; and the techniques used here will not take these into account. How-ever, much of the attention will be focused on change in rates over time so that errors more or less of the same kind will be introduced at each
point in time for which estimates are made. This will be true for the errors of estimation committed due to the prior assumption about age composition as well as the assumption of varying rates among reporting areas and non-reporting areas. In effect, measures of change will be less affected by these consciously naive assumptions than the yearly rates. The effects of these assumptions are the percent change on the volume of offenses from year to year, compared with estimates made in accord with UCR Techniques are displayed in Table II. From this table there is support for the modifica-tions employed in the analysis and, inferentially, for a charitable view of the assumptions. The assumptions made here appear not to differ significantly in effects on measures of change from the assumptions made in the UCR estimates of change. The weakness inherent in data are proba-bly of greater significance.
Given these prior assumptions, the calculation of the total offense rate for a particular year is symbolized below:
Definitions:
N(a) M the number of persons in the population N at age (a) during some year. P(a) = the proportion of persons in the
popula-tion N at age (a) during some year,
so N(a) = NP(a).
Ci is the clearance rate for offense
j.
A'i(a)
- arrests for offense j of persons age (a) during some year-for areas coveredby MCR,
then A'j(a)/Ci
is the number of offenses of type j due to persons age (a) during some year-for areas covered by UCR,
N' _= the population covered by UCR.
PHILIP C. SAGI AND CHARLES F. WELLFORD
is the estimate of number of offenses due to persons age (a) during some year subject to the assump-tions listed earlier.
Oi(a) = Aj(a)/CjN(a) the age specific and of-fense specific rate of ofof-fenses.
k
ZO(a) = O(a) the age specific rate of offenses,
j-1
and ZO(a) = Total Offense Rate.
a=0
In practice, further modifications were employed. The summation on (a) age, need not proceed over the range indicated. Offenses are committed in the main by those 10 years old and over but under 65. Without too great a distortion, we can substitute
50
--O(a) for the more precise expression of the
I0
total offense rate.
In addition, adjustments were made in those age categories where arrests were not reported by single years. For example, if the age category was a five year interval, all arrests for that category were.divided by the size of the population in that five year interval. The rate so obtained was then attributed to each year in the age interval.
TOTAL ARREST RATE
The Total Arrest Rate is similar to the Total Offense Rate. It differs only by the division of the offense specific clearance rate. Therefore:
Aj(a) Total Arrest Rate = E
AE(a)
a i N(a)
THE OFFENSE AND ARREST RATIO
Changes in the volume of arrests or the volume of offenses committed are related to the growth of
population. In particular, they are related to the growth of that portion of the population in the ages most prone toward criminal activity, say ages above ten but less than 50, if we are concerned with serious offenses. This observation suggests a statistic that takes the numbers in this age bracket into account. Ratios that may be formed include:
50
,
Ai(a)
a-10 j
50
, N(a)
10
50
ZF
Z Oj(a)
a-10 i
or 50
E N(a)
a-10
for the Arrest Ratio and Offense Ratio respectively.
AN INTERPRETATION OF THE TOTAL ARREST OR
TOTAL OFFENSE RATE
Apart from the use of these statistics as a meas-ure of criminalness of a population holding constant the size and age composition of populations being compared, the Total Offense Rate (or Total Arrest Rate) has another interesting meaning. It measures the number of offenses (or arrests) per person for a cohort moving through in its lifetime the various age specific offense rates observed at a given period or year. This interpretation requires that the age specific offense rates be fixed during the lifetime of the hypothetical cohort.
BIBLIOGRAPHY
Federal Bureau of Investigation, Uniform Crime
Re-ports, Washington, D. C.:
-1958, p. 93. (Table 17); -1959, p. 99. (Table 16); -1960, p. 92 (Table 17); -1961, p. 94 (Table 20); -1962, p. 94 (Table 20); -1963, p. 112 (Table 26); -1964, pp. 117-118 (Table 25). Census Reports:
-Series P-25, 9311, July 1965 (for 1958 and 1959); -Series PS-25, §314, August 1965, (for 1960, '61,
'62, '63, '64).