DESIGN OF A SHUNT ACTIVE
CAUSED BY NONLINEAR LOADS
D. M. Soomro
Department of Electrical Power Universit
86400 Parit Raja,
E-Mail: [email protected]
ABSTRACT
Application of non-linear electrical devices has It may lead equipment (connected to it) to overhea application of three-phase shunt active power filter
by nonlinear loads. To obtain result for this paper, the MATLAB / Simulink was used as a simulation tool. results are within the recommended IEEE-519 standard
almost unity.
Key words: Shunt Active Power Filter (SAPF) Power Quality (PQ)
INTRODUCTION
Power quality (PQ) issues are becoming a major concern of today’s power system (PS)
Harmonics play a significant role in deteriorating harmonic distortion (HD). HD in the electric
system is increasing day to day due to the widespread use nonlinear loads. Significant considerations of these pressures can possibly raise consonant voltage and current in an electrical PS to inadmissible abnormal states that can antagonistically affect the system. IEEE standards have characterized cutoff points for harmonic voltages and harmonic currents (Tsengenes and Adamidis, 2010), (Chapman, 2001). It has been has been observed that, in distribution system current harmonics cause serious harmonic problems in distribution feeders for sensitive consumers. Some technology solutions have been reported in order to solve PQ issues (Tsengenes and Adamidis, 2010), (Chapman, 2001), (Ao. Douglas, et al., 2010).
Initially, passive filters (combinations of capacitors and inductors) were used to mitigate the
These approaches were extensively used in high voltage D transmission (HVDC) for filtering the harmonics on the AC and DC sides. However, this approach is unsuitable at the distribution level as passive filters can only correct specific load conditions or a particular state of the PS
are unable to follow the changing system conditions. Thus, the active power filter (APF) was introduced to compensate harmonics and reactive power.
There are three types of APFs which are shunt APF, series APF, and hybrid APF (i.e. the combination of active and passive filters)(Badi, 2012)(Chaughule, Nehete, and Shinde, 2013).
The purpose of an APF as a power line conditioner is to repay the utility line current waveform with the goal that it approximates a sine wave in phase
voltage when a nonlinear load is connected with the system. Classically, shunt power line conditioner (
filter) consists of tuned LC filters. High pass filters to suppress harmonics. While power capacitors
to enhance the PF of the utility/mains. However, these
www.arpnjournals.com
SHUNT ACTIVE POWER FILTER TO MITIGATE THE HARMONICS
CAUSED BY NONLINEAR LOADS
Soomro, M. A. Omran, and S. K. Alswed
Electrical Power Engineering, Faculty of Electrical and Electronic Engineering, Universiti Tun Hussein Onn Malaysia (UTHM)
86400 Parit Raja, Batu Pahat, Johor, Malaysia
[email protected], [email protected], [email protected]
linear electrical devices has led to a distortion in the output sine waveforms of source current and voltage to overheat and sometimes cause damage. This paper concentrates on the design and phase shunt active power filter (SAPF) by using p-q theory to mitigate the harmonics which are created by nonlinear loads. To obtain result for this paper, the MATLAB / Simulink was used as a simulation tool.
519 standard i.e. less than 5% and also the power factor (
Power Quality (PQ) Total Harmonic Distortion (THD) Power Factor
issues are becoming a major (PS) engineers. Harmonics play a significant role in deteriorating PQ, called in the electrical distribution due to the widespread use of loads. Significant considerations of these nt voltage and current inadmissible abnormal states that can antagonistically affect the system. IEEE standards have harmonic voltages and and Adamidis, 2010), It has been has been observed that, in distribution system current harmonics cause serious harmonic problems in distribution feeders for sensitive consumers. Some technology solutions have been reported ve PQ issues (Tsengenes and Adamidis,
Douglas, et al., 2010). Initially, passive filters (combinations of capacitors and inductors) were used to mitigate the PQ problems. These approaches were extensively used in high voltage DC transmission (HVDC) for filtering the harmonics on the AC and DC sides. However, this approach is unsuitable at the distribution level as passive filters can only correct specific PS. These filters to follow the changing system conditions. Thus, was introduced to compensate
There are three types of APFs which are shunt APF, series APF, and hybrid APF (i.e. the combination of ve filters)(Badi, 2012)(Chaughule, Nehete,
power line conditioner is to repay the utility line current waveform with the goal with the line d with the system. Classically, shunt power line conditioner (shunt passive filters are used power capacitors are utilized, However, these
conventional methods have the compensation, large size and can also
conditions (Tsengenes and Adamidis,2010), (Chapman, 2001). Hence, SAPFs are introduced as a viable alternative to compensate harmonics and improve
This paper is focusing on the application of SAPF in treating the harmonics distortion in the distribution system by determining low Total Harmonic Distortion (THD) value and improving the system’s
SHUNT ACTIVE POWER FILTER DESIGN
Effect of harmonics
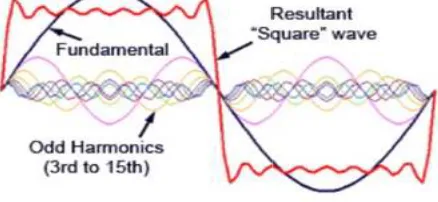
[image:1.612.320.539.564.665.2]Harmonics in PS can turn into the wellspring of a mixture of unwelcome impacts. For example, harmonics can cause signal interference, overvoltage, data loss, and circuit breaker failure, as well as equipment heating, breakdown, and harm. Any dissemination circuit serving modern electronic gadgets will contain some degree of harmonic frequencies. The greater the power drawn by nonlinear loads, cause higher the level of voltage and distortion as shown in Figure 1.
Figure 1: Effect of harmonics on voltage or waveform (Chaughule, et al.
HD in power distribution system by using equation (1)
% ∑
FILTER TO MITIGATE THE HARMONICS
, Faculty of Electrical and Electronic Engineering,
s of source current and voltage. This paper concentrates on the design and q theory to mitigate the harmonics which are created by nonlinear loads. To obtain result for this paper, the MATLAB / Simulink was used as a simulation tool. The achieved also the power factor (PF) of the system to
Power Factor(PF)
limitations of fixed compensation, large size and can also excite resonance conditions (Tsengenes and Adamidis,2010), (Chapman, are introduced as a viable alternative
and improve PF.
This paper is focusing on the application of SAPF in treating the harmonics distortion in the distribution system by determining low Total Harmonic Distortion (THD) value and improving the system’s PF.
SHUNT ACTIVE POWER FILTER DESIGN
can turn into the wellspring of a mixture of unwelcome impacts. For example, harmonics can cause signal interference, overvoltage, data loss, and circuit breaker failure, as well as equipment heating, breakdown, ny dissemination circuit serving modern electronic gadgets will contain some degree of harmonic requencies. The greater the power drawn by nonlinear , cause higher the level of voltage and current
on voltage or current et al., 2013)
HD in power distribution system can be measured
∑
Where n = 2, 3, 4, 5, ...
APFs are becoming a viable alternative to passive filters and are gaining market share speedily as their cost becomes competitive with the passive variety, one of the most common type of APF to reduce the harmonic current distortion is SAPF (Ten genes and Adamidis, 2010).
Principle of SAPF
The shunt-connected APF, with a self
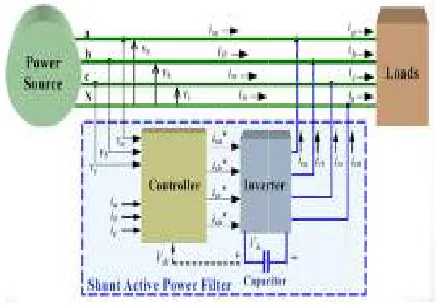
dc bus, has a topology similar to that of a static compensator (STATCOM) used for reactive power compensation in power transmission systems. compensates load current harmonics by injecting equal opposite harmonic compensating current. In this case, the SAPF operates as a current source injecting the harmonic components generated by the load but phase shifted by 180°. Figure 2 shows the connection of
compensating the harmonic load currents.
Figure 2:Connection of a SAPF
Design SAPF based on instantaneous PQ theory
The instantaneous active and reactive power theory or simply the p-q theory is based on a set of instantaneous values of active and reactive powers defined in the time domain. There are no restrictions on the voltage or current waveforms, and it can be applied to three-phase systems with or without a neutral wire for
three-voltage and current waveforms. Thus, it is valid not only in the steady state, but also in the transient state
Balu, 2014), (Gopal, Rama and Yarnagula
theory is very efficient and flexible in designing controllers for power conditioners based on power electronics devices. Other traditional concepts of power are characterized by treating a three-phase system as three
single-The p-q single-Theory first uses Clarke transformation to transforms voltages and currents from the a, b
coordinates and then defines instantaneous power in these coordinates. Hence, this theory always considers the three phase system as a unit, not a superposition or sum of three single-phase circuits (Priya and Balu, 2014).
The p-q Theory can be defined in three systems with or without a neutral conductor. Three instantaneous powers: the instantaneous zero
power P0, the instantaneous P, and the instantaneous
s are becoming a viable alternative to passive filters and are gaining market share speedily as their cost becomes competitive with the passive variety, one of the to reduce the harmonic current
midis, 2010).
connected APF, with a self-controlled dc bus, has a topology similar to that of a static compensator (STATCOM) used for reactive power compensation in power transmission systems. SAPF onics by injecting equal but opposite harmonic compensating current. In this case, the APF operates as a current source injecting the harmonic components generated by the load but phase shifted by 180°. Figure 2 shows the connection of a SAPF
APF
heory
nstantaneous active and reactive power theory q theory is based on a set of instantaneous values of active and reactive powers defined in the time domain. There are no restrictions on the voltage or current phase systems -phase generic voltage and current waveforms. Thus, it is valid not only in the steady state, but also in the transient state (Priya and , Rama and Yarnagula, 2014). This ory is very efficient and flexible in designing controllers for power conditioners based on power electronics devices. Other traditional concepts of power are characterized by -phase circuits. st uses Clarke transformation to b, and c to αβ0 coordinates and then defines instantaneous power in these coordinates. Hence, this theory always considers the three- or sum of three
q Theory can be defined in three-phase systems with or without a neutral conductor. Three instantaneous powers: the instantaneous zero-sequence ntaneous Q are
defined from the instantaneous phase voltages and line currents on the αβ0 axes as represented
0 0
0
0
Let us consider a three phase system voltages
, and andthe instantaneous line currents. Since zero sequence power in three phase, three wire system
equation (2) becomes:
In the proceeding discussion, the will be set as functions of voltages and the real and imaginary power(Q) respectively
meaning of the power defined in the p Balu, 2014). Equation (3) can be writ
The three phase instantaneous power !"# !"#
If current and voltages from replaced to their equivalent a, b, and (3), the instantaneous Q will be:
1
√3'( )*# ( *) √,+'# #
This expression is similar to that implemented in some instruments for measuring the three
power. The difference is that voltage and current
used in those instruments. Here, instantaneous values of voltage and current are used instead
(Gopal, Rama and Yarnagula, 2014)
Livint, 2013). According to p-q theory real and reactive powers can be written as:
- # ., - # . ,
where:
P = The active power for a three phase system with or without neutral conductor in steady state or during transients and it is representing the total instantaneous energy flow per second between source and load.
Q = The imaginary power and proportional to t
of energy that is being exchanged between the phases of the system. It does not contribute to energy transfer between source and load at any time.
P0=Active power due to zero sequence components
0=The average value of the instantaneous real p
transferred from the power source to the load. It is the only desired power component to be supplied by the power source and due to fundamental active current.
defined from the instantaneous phase voltages and line as represented in equation (2).
1
1 (2)
phase, instantaneous phase
, and which are the instantaneous line currents. Since zero sequence power three wire system is always zero, the
(3)
In the proceeding discussion, the α and β currents will be set as functions of voltages and the real power (P) respectively to explain the physical the p-q theory (Priya and
tten as:
(4) The three phase instantaneous power p is given by:
# !"
If current and voltages from α and β variables are , and c variables in equation
)# (* )22
# *2 (5)
This expression is similar to that implemented in some instruments for measuring the three-phase reactive power. The difference is that voltage and current phases are used in those instruments. Here, instantaneous values of tead (Priya and Balu, 2014) 2014) (Adam, Zbant and q theory real and reactive
. 345 (6)
= The active power for a three phase system with or without neutral conductor in steady state or during representing the total instantaneous energy flow per second between source and load.
= The imaginary power and proportional to the quantity of energy that is being exchanged between the phases of the system. It does not contribute to energy transfer between
-=Alternating value of the instantaneous real power exchanged between the power source and the load through the a-b-c coordinates. Since alternating value of the instantaneous real power does not involve any energy transference from the source to load, it must be compensated. It is due to harmonic currents.
0=Average value of the instantaneous imaginary power, exchanged between system phases and does not imply transfer of energy between power sources and load. The choice of compensation of average value of the instantaneous imaginary power depends on reactive power compensation and is due to fundamental reactive current. -=Alternating value of the instantaneous imaginary power exchanged between system phases and does not imply transfer of energy between power source and load. Since alternating value of the instantaneous imaginary
unwanted, it must be compensated. It is also due to harmonic currents. All these powers are explained in Figures 3.
Figure 3:The concept of different powers between power source and load (Priya and Balu, 2014)
The basic idea behind the shunt current compensation is illustrated in Figure 4. It shows a source supplying power to nonlinear load that is being compensated by the filter. Actually SAPF
compensator. We assumed that the SAPF behaves as three phase controlled current source that can generate harmonics in phase opposition depending upon current reference
"
∗and
"*
∗ (Tekeet al., 2011).The calculated active power of the load can be separated into its average (P) and oscillating (
[image:3.612.322.542.197.350.2]Likewise, the load reactive power can be separated into its average (Q) and oscillating (-) parts. Then, undesired portions of the p and q of the loads that should be
Figure 5: First simulation
=Alternating value of the instantaneous real power rce and the load through c coordinates. Since alternating value of the instantaneous real power does not involve any energy transference from the source to load, it must be
taneous imaginary power, exchanged between system phases and does not imply transfer of energy between power sources and load. The choice of compensation of average value of the instantaneous imaginary power depends on reactive power
e to fundamental reactive current. =Alternating value of the instantaneous imaginary power exchanged between system phases and does not imply transfer of energy between power source and load. Since alternating value of the instantaneous imaginary power is unwanted, it must be compensated. It is also due to harmonic currents. All these powers are explained in
concept of different powers between power 2014)
c idea behind the shunt current . It shows a source hat is being APF is shunt APF behaves as three erate harmonics in phase opposition depending upon current reference
"
∗ ,of the load can be ) and oscillating (-) parts. can be separated into its
Then, undesired of the loads that should be
compensated are selected.
The reason for incorporating minus sign in the compensating power is to emphasize that the compensator must inject harmonics in perfect phase opposition Remember that convention of current in direction is selected as shows in Figure 4 that source current is the sum of load currents and filter current. Inverse Clarke transformation from α, β, and 0 to be coordinates
calculate the compensating current references
"*
∗ instantaneously.Figure 4: SAPF in 3-phase system (Priya
METHODOLOGY
In this paper MATLAB/SIMULINK is used tool to implement the proposed SAPF
conditions. Mainly, there are two simulation is with non-linear load while the with SAPF connected.
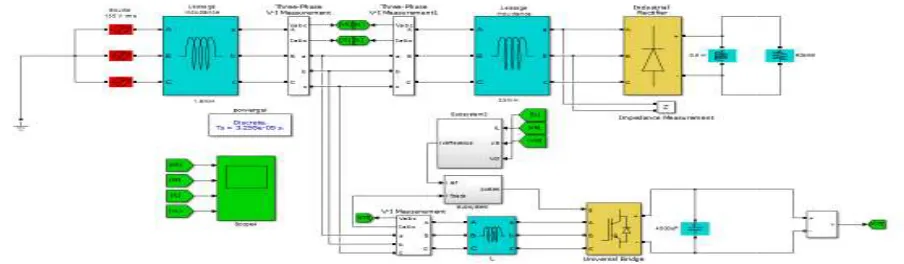
First simulation setup
The simulation diagram is 5.Three phase supply which is feeding non R-L parameters along with 3-phase rectifier is considered for simulation simulation parameters are shown in the
imulation setup in MATLAB/Simulink with nonlinear load
The reason for incorporating minus sign in the e that the compensator must inject harmonics in perfect phase opposition. emember that convention of current in direction is selected that source current is the sum of load verse Clarke transformation to be coordinates is applied then to current references
"
∗ ,"
∗and
Priya and Balu, 2014)
METHODOLOGY
this paper MATLAB/SIMULINK is used as a to implement the proposed SAPF in different load here are two simulations; first while the second one is
[image:3.612.74.544.581.706.2]Second simulation setup
To investigate the working of designed connected to Figure 5 under different suddenly connected R-L loadof 60 Ω, 50
unbalanced R-L load of 5, 10, 15 Ω on each phase respectively as shown in Figure 6.
Figure
P-Q and current compensation calculation This is the heart of APF.PQ theory calculation of P, Q and compensation current implemented as given below in Figure7.
MATLAB function block is used to implement all the mathematical operations involved in the algor
7shows all the blocks required for calculation of compensation current. In that Clarke transform to calculate real, reactive and zero sequence power and stationary frame at compensated reference current generate by using PI controller. The SAPF at using DC link capacitor and DC link reference voltage and actual voltage compared to the voltage to be regulated. Then inverse Clarke transform to calculate three phase compensated reference current.
Figure7: Blocks required for calculation of compensation current
The hysteresis band current controller
The principle of hysteresis current control is very simple. The purpose of the current controller is to control
o investigate the working of designed SAPF, it is under different conditions of Ω, 50 mH and on each phase
signal of the comparator which is used to activate the inverter power switching.
There are two inputs for the hysteresis
is the reference current and the new injection current shown in Figure 8.
Figure 6: Second simulation setup with SAPF
ompensation calculation
algorithm for , Q and compensation current are 7. Embedded implement all the algorithm. Figure calculation of n that Clarke transform to calculate real, reactive and zero sequence power and stationary frame reference current generate by using PI controller. The SAPF at using DC link capacitor and DC link reference voltage and actual voltage compared to the voltage to be regulated. Then inverse Clarke transform to calculate three phase compensated reference current.
for calculation of compensation
[image:4.612.78.530.141.273.2]The principle of hysteresis current control is very simple. The purpose of the current controller is to control
Figure 8: Hysteresis current control
The load current, by forcing it to (Mohapatra and Babu, 2010) is achieved by switching action of an inverter to keep the
hysteresis band (Zaveri and Chudasama,
currents are sensed and compared with respective command current by hysteresis band. The output
The error between reference current and the new injection current are fed to the six relay
guide the inverter’s switching to compensate the harmonic current.
PI controller
To control DC bus voltage, it is required to take care of little amount of power flow
thus compensating for switching and conduction losses. The dc link voltage control loop does not require
it responds to steady state operating condition. The actual DC link voltage is compared with a reference DC link voltage and passed through a PI controller. To maintain dc link voltage at a fixed reference value, the dc
requires a certain amount of real power, which is directly is used to activate the
the hysteresis band which is the reference current and the new injection current as
Figure 8: Hysteresis current control
by forcing it to follow is achieved by switching the inverter to keep the current within the and Chudasama, 2012). The load currents are sensed and compared with respective command
by hysteresis band. The output
erence current and the new injection current are fed to the six relays. This signal will guide the inverter’s switching to compensate the harmonic
To control DC bus voltage, it is required to take care of little amount of power flowing into DC capacitor, thus compensating for switching and conduction losses. The dc link voltage control loop does not require being as fast as to steady state operating condition. The actual DC link voltage is compared with a reference DC link voltage and passed through a PI controller. To maintain dc-link voltage at a fixed reference value, the dc-dc-link capacitor
proportional to the difference between the reference and actual voltages. The control signal coming from PI controller to regulate DC link voltage can be expressed as
6 789: ;<=6 >?@ 6A # ;
Where
;<
and;
8 are proportional and integral gains of the PI controller.Figure 9: PI controller
By increasing proportional gain
(;<
rise time and steady-state error. It also causes increase in the overshoot and settling time. Similarly increase of integral gain
;
8 reduces steady state error, and increases overshoot and settling time. The control diagram of PI controller shown in Figure 9.Simulation Parameters
Table 1: Simulation parameters used in this paper
Parameter Value
Source voltage (rms) 155 V Source frequency (F) 50 Hz Source resistance (RS) 1 mΩ
Source inductance (LS) 1e-3mH
Case 1: Load (R-L) 90 Ω, 0.5H Case 2: Additional load of
R-L
90 Ω, 0.5H
Case3: Additional Unbalanced R load with R-L load
5, 10, 15 Ω on each phase respectively
With 90 Ω, 0.50 DC link capacitor (Cdc) 4500 µF
Inductor filter 3.5 mH
DC link PI controller Kp = 25, Ki = 20 DC link Reference voltage 450 V
RESULTS AND DISCUSSION
The simulation results of voltage, current are obtained with MATLAB tool to analyze performance of SAPF without and with compensation as shown in Figure 10, 11, 12, 13 and 14.
Case 1 (R-L load)
Figure 10: Source voltage without and with
proportional to the difference between the reference and actual voltages. The control signal coming from PI controller to regulate DC link voltage can be expressed as:
A ;8B=6 >?@ 5C5D (7) are proportional and integral gains of the
<)
, it
reduces causes increase in the me. Similarly increase of integral increases overshoot of PI controller is aspaper Value
on each phase
Ω, 0.50H
= 20
current and THD ined with MATLAB tool to analyze the compensation as
without and with SAPF
Figure 11: Source current without S
Figure10 presents source voltage waveform which it is found that there is no distortion
waveform of current, distortion is present there Figure11. In that case THD found was
Figure 12.
Figure 12: THD without
Figure 13: Current with S
Figure 13 presents the current waveform and with the application of SAPF,
0.02seconds.The resultant current harmonic and THD was reduced from 28.59% to 1.7 Figure 14.The minimized THD below achievement of IEEE-519 standard. Also
was improved from 0.782to 0.9993 as shown in Table 2
Figure 14: Analysis of THD
without SAPF
source voltage waveform, in s no distortion. But in the is present there as shown in was 28.59 % as shown in
thout SAPF
with SAPF
Figure 13 presents the current waveform without , which was applied at current harmonic was mitigated from 28.59% to 1.77% as shown in THD below 5% confirms the . Also the observed PF as shown in Table 2.
Case 2 (Additional R-L load with R-L load)
Figure 15 show the harmonic current signal without SAPF. Figures 16 and 17 display the simulation results obtained in the HD analysis of the load current with nonlinear R-Land suddenly connected R-Lloads
[image:6.612.317.541.54.256.2]was 27.65%.The highest harmonics were the 5 7threpresenting 20.13%and 12.55% respectively fundamental. On the other hand, the PF was more poor level i.e. less than 0.778 as shown in Table 2
[image:6.612.69.295.193.276.2]Figure 15: Current waveform without SAPF
Figure 16: An analysis of THD without
The SAPF was connected to the harmonic distorted system at time t=0.2sec to mitigate the effect
hand, suddenly connected R-L load was connect It can be seen that the filter takes only 0.021 s shunt APF to follow the change of the load current shown in Figure 17.
Figure 17: Analysis of signal with S
By connecting SAPF, the THD was reduced 27.65% to 1.82%, which matches the IEEE limits as shown in Figures 17 and 18. The improved from 0.778 to 0.9987.
show the harmonic current signal Figures 16 and 17 display the simulation analysis of the load current with loads. The THD he highest harmonics were the 5thand the respectively of the the PF was reduced to as shown in Table 2.
without SAPF
nalysis of THD without SAPF
connected to the harmonic distorted to mitigate the effect. On the other connected at 0.3sec. the filter takes only 0.021 sec for the shunt APF to follow the change of the load current as
SAPF
was reduced from the IEEE 519 standard he PF was also
Figure 18: Analysis of THD with
Case 3 (Unbalanced R load with R-L
In this case SAPF was investigated with with additional unbalanced R load. T
was from 0sec to 1sec. The Figures 19, 20 the results without and with SAPF.
[image:6.612.73.294.309.464.2]voltage waveforms as pure but the waveform of current is distorted.
[image:6.612.319.544.372.470.2]Figure 19: Waveforms of voltage and
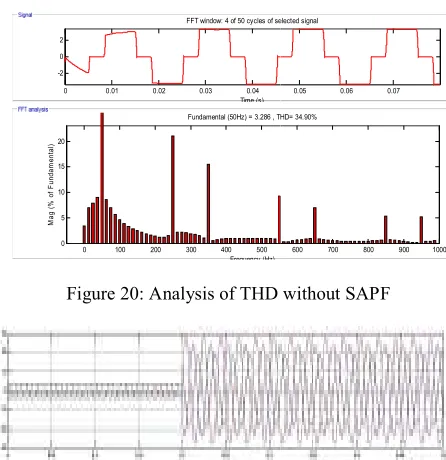
Figure 20: Analysis of THD without
Figure 21: Waveforms of current with unbalanced load
0 0.01 0.02 0.03 0.04
-2 0 2
FFT window: 4 of 50 cycles of selected signal
Time (s)
0 100 200 300 400 500
0 5 10 15 20
Frequency (Hz) Fundamental (50Hz) = 3.286 , THD= 34.90%
M
a
g
(
%
o
f
F
u
n
d
a
m
e
n
ta
l)
nalysis of THD with SAPF
L load)
investigated with R-L load The time of simulation 19, 20 and 21 depict all APF. Figure 19 shows the pure but the waveform of current is
voltage and current without SAPF
nalysis of THD without SAPF
aveforms of current with unbalanced load 0.05 0.06 0.07 FFT window: 4 of 50 cycles of selected signal
[image:6.612.316.539.496.726.2] [image:6.612.72.298.576.658.2]In Figure 20, the observed THD was 34.90%. While the PF reduced to 0.688. The effect of
unbalance R load can be seen connected at 0.2s Figure 21 to investigate how the SAPF worked, while connected to test case 3 at 0.1sec.
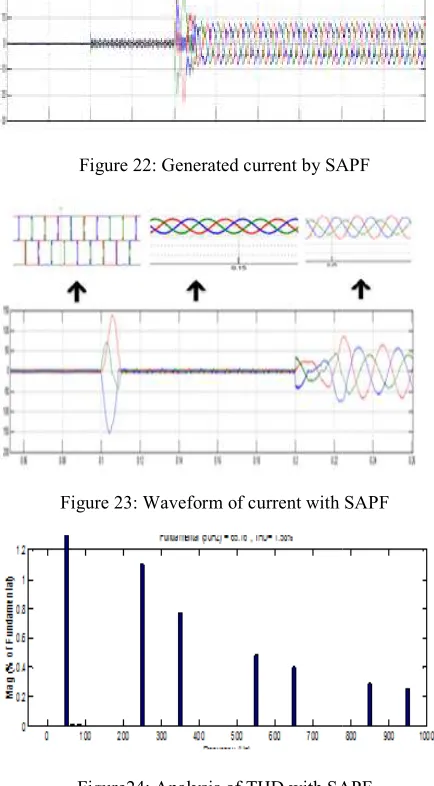
When the SAPF was connected,
[image:7.612.321.544.178.289.2]reference current to inject in the system to cancel the harmonic current as shown in Figure22. The corresponding current waveform is as shown in Figure 23. Analysed shows that it was reduced to 1.58% from 34.90% the PF was improved to 0.998 as shown in Figure given in Table 2.
[image:7.612.69.287.217.300.2]Figure 22: Generated current by SAPF
Figure 23: Waveform of current with S
Figure24: Analysis of THD with SAPF
The resulting THD of the current and PF with SAPF are summarised in Table 2.While Table 3 glance by describing the harmonic orders of all without and with SAPF.
CONCLUSION
The designed three phase SAPF based on instantaneous p-q theory was simulated in MATLAB /SIMULINK by using different load conditions i.e.
In Figure 20, the observed THD was 34.90%. he effect of additional at 0.2sec in the worked, while it was
SAPF was connected, it generated the system to cancel the The corresponding Analysed THD from 34.90% and also Figures 24 and
SAPF
with SAPF
APF
without and with able 3 gives a the harmonic orders of all simulations
hree phase SAPF based on q theory was simulated in MATLAB by using different load conditions i.e. R-L
load, suddenly connected R-L unbalance R load.Its application wa and the validity achieved by minimiz improving PF as summarised in Table 2
supply current is almost pure sinusoidal. THD observed fund to be within the prescribed limits of 5% as recommended by IEEE-519 standard.
Table 2: shows the results of simulations
Operation condition
Without SAPS
%THD PF
R-L load 28.59 0.782
R-L with additional R load
27.65 0.778
R-L load with R unbalanced load
34.90 0.688
Table 3: Harmonic orders of all cases SAPF
For future research
Simulation of APF for voltage harmonics compensation can be made by using
conditioner (UPQC).
Experimental investigations can be made
by developing a prototype model in the laboratory to verify the simulation results for both PI and hysteresis controllers.
REFERENCES
Testa, M. F. Akram, R. Burch, G. Carpinelli, G.
V. Dinavahi. (2007). Interharmonics: Theory and Modeling, IEEE Transactions on Power Delivery, 22,
Absalla, I, I. Rao, K. S.R. and Perumal, N. (2011). Cascaded Multilevel Inverter Based Shunt Active Power Filter In Four-Wire Distribution System. IEEE, 978(1), pp.4577--4584.
Adam, G., Zbant, A. and Livint, G, (2013). New Simulink control block for single phase shunt active power filters. Advanced Topics in Electrical Engineering (ATEE), 2013 8th International Symposium on IEEE
load, and additional Its application was successfully proved minimizing the harmonics and improving PF as summarised in Table 2. Consequently, the supply current is almost pure sinusoidal. THD observed was to be within the prescribed limits of 5% as
.
shows the results of simulations
With SAPF
%THD PF
0.782 1.77 0.9993 0.778 1.82 0.9987
0.688 1.58 0.9982
cases without and with
Simulation of APF for voltage harmonics by using universal PQ
ental investigations can be made on SAPF del in the laboratory to verify the simulation results for both PI and hysteresis controllers.
Testa, M. F. Akram, R. Burch, G. Carpinelli, G. Chang. and V. Dinavahi. (2007). Interharmonics: Theory and Modeling, ry, 22, pp. 2335-2348.
Absalla, I, I. Rao, K. S.R. and Perumal, N. (2011). Cascaded Multilevel Inverter Based Shunt Active Power Wire Distribution System. IEEE, 978(1),
Adam, G., Zbant, A. and Livint, G, (2013). New Simulink control block for single phase shunt active power filters. In Advanced Topics in Electrical Engineering (ATEE), 2013
[image:7.612.70.287.235.628.2] [image:7.612.319.538.317.490.2]Aniket V. Kulkarni, Dept of Electronics and Telecommunication PES Modern College of engineering Pune 411005, Automatic Power Factor Correction to reduce the power requirement. International Journal on Advanced Computer Theory and Engineering (IJACTE).
Badi, Manjulata.( 2012). Power quality improvement using passive shunt filter, tcr and tsc combination. Diss. National Institute of Technology, Rourkela-769008, India.
Chapman, D. (2001). Voltage dips. Power quality application guide. Filters under Non Ideal Mains Voltages, SPEEDAM 2010 International Symposium on Power Electronics, Electrical Drives, 5(1), pp.1--10.
Chaughule, B. I. Nehete, A. L. and, Shinde, R. (2013). Reduction In Harmonic Distortion Of The System Using Active Power Filter In Matlab Simulink. International Journal of Computational Engineering Research, 3(6), pp.59--64.
G, Tsengenes. and G, Adamidis. (2010). “A New Simple Control Strategy for Shunt Active Power Filters under Non Ideal Mains Voltages,” SPEEDAM 2010 International Symposium on Power Electronics, Electrical Drives, Automation and Motion.
Gopal, M. Rama, and Sobharani Yarnagula. (2014). "Simulation and Analysis of Shunt Active Power Filter for Power Quality Improvement." International Journal of Advanced Trends in Computer Science and Engineering, 3(1), pp.26--31.
H. Akagi, E.H. Watanabe, and M. Aredes. (2007). "Instantaneous power theory and applications to power conditioning, “Electrical Engineering.
Ibrahim, S. Prakash, S. and Bhardwaj A. (2013). "Power Quality Improvement Performance Using Hybrid (Solar Wind) Energy for Distributed Power Generation.”2(10), pp.412--413.
Sebasthirani, K. and Porkumaran, K . (2013). Efficient Control of Shunt Active Power Filter With Self-Adaptive Filter Using Average Power Algorithm. International Journal of Emerging Technology and Advanced Engineering, 3(5), pp.178-183.
Teke, A. Saribulut, L. Meral. M.E. and Tumay, M. (2011). Active Power Filter: Review of Convertor Topologies and Control Strategies. Gazi University Journal of Science, 24(2), pp.283-289.
Usaman, H. and Musa, S. (2013). "Harmonic mitigation single shunt active power filter with fuzzy logic controller for the improvement of power quality" Australian International Academic Centre, 1(2), pp.28--33.
Zaveri, N. and Chudasama, A. (2012). Control Strategies for Harmonic Mitigation and Power Factor Correction Using Shunt Active Filter under Various Source Voltage
conditions. International Journal for Electrical Power and Energy Systems, 42(2012), pp.661--671.
Chapman, D. (2001). Voltage dips. Power quality application guide.5(1), pp.1—10.
Ao, S. I. Douglas, C. Grundfest, W. S. and Burgstone, J. (2010).Proceedings of the World Congress on Engineering and Computer Science. II, pp. 978-988. 2010, San Francisco, USA