Georgia State University
ScholarWorks @ Georgia State University
Public Health Theses School of Public Health
Spring 5-12-2017
Physical Dating Violence in Georgia: A Growing
Disparity among Hispanic Youth
Britni Knott
Follow this and additional works at:https://scholarworks.gsu.edu/iph_theses
This Thesis is brought to you for free and open access by the School of Public Health at ScholarWorks @ Georgia State University. It has been accepted for inclusion in Public Health Theses by an authorized administrator of ScholarWorks @ Georgia State University. For more information, please contact [email protected].
Recommended Citation
Knott, Britni, "Physical Dating Violence in Georgia: A Growing Disparity among Hispanic Youth." Thesis, Georgia State University, 2017.
1
Abstract
Physical Dating Violence in Georgia: A Growing Disparity among Hispanic Youth
By
Britni Knott
April 24, 2017
Background:
Nationally representative data of high school students in the U.S. indicate that levels of physical dating violence are higher among students in Georgia than in most states. This study seeks to understand the increased risk for physical dating violence among youth in Georgia and make recommendations for prevention and interventions.
Methods:
Analyses were conducted using the 2013 Youth Risk Behavior Survey, a nationally
representative dataset sampling of high school students in grades 9-12 in the United States. Data from a total of 13,583 adolescents were used in the study. Physical dating violence was defined as reporting being hit, slammed into something, or injured with an object or weapon on purpose by someone they were dating or going out with among students who dated or went out with someone during the 12 months before the survey. Cross-sectional analyses of the prevalence of physical dating violence victimization by demographic characteristics will be conducted.
Results:
In the U.S. overall, 10.3% of high school students report any physical dating violence. Among the 38 states including data on physical dating violence in 2013, the state of Georgia ranked third highest (12.4%) only preceded by Louisiana (14.8%) and Arkansas (13.8%) for reports of
physical dating violence. In Georgia, physical dating violence did not differ by grade level or by sex. However, in terms of race/ethnicity, Hispanic youth (18.1%) were significantly more likely than African American youth (9.6%) or of white youth (10.7%) to report physical dating
violence.
Conclusion:
2
Physical Dating Violence in Georgia: A Growing Disparity among Hispanic Youth
by
Britni Knott
B.S., Howard University
A Thesis Submitted to the Graduate Faculty
of Georgia State University in Partial Fulfillment
of the
Requirements for the Degree
MASTER OF PUBLIC HEALTH
ATLANTA, GEORGIA
3
APPROVAL PAGE
Physical Dating Violence in Georgia: A Growing Disparity among Hispanic Youth
By
Britni Knott
Approved:
Dr. Monica Swahn
Committee Chair
John Steward
Committee Member
April 24, 2017
4
Acknowledgments
I would like to extend my sincere gratitude to my committee, Dr. Monica Swahn and Professor
John Steward, for encouraging and guiding me through this process. I would also like to thank
5
Author’s Statement Page
In presenting this thesis as a partial fulfillment of the requirements for an advanced degree from Georgia State University, I agree that the Library of the University shall make it available for inspection and circulation in accordance with its regulations governing materials of this type. I agree that permission to quote from, to copy from, or to publish this thesis may be granted by the author or, in his/her absence, by the professor under whose direction it was written, or in his/her absence, by the Associate Dean, School of Public Health. Such quoting, copying, or publishing must be solely for scholarly purposes and will not involve potential financial gain. It is understood that any copying from or publication of this dissertation which involves potential financial gain will not be allowed without written permission of the author.
Britni Knott
6
Table of Contents
List of tables ... 7
Introduction ... 8
1.1 Background... 8
1.2 Purpose of Study ... 9
1.3 Research Questions ... 9
Review of the Literature ... 10
2.1 Overview of Teen Dating Violence ... 10
2.2 Dating Violence Outcomes ... 13
2.3 Teen Dating Violence among Hispanic Youth ... 15
2.4 Teen Dating Violence Policies ... 18
Methods ... 21
3.1 Data Source ... 21
3.2 Variables ... 22
3.3 Analysis ... 23
Results ... 24
Discussion and Conclusion ... 26
5.2 Limitations ... 28
5.3 Implications of Findings ... 29
5.4 Conclusion ... 31
References ... 32
Table 1 ... 35
Table 2 ... 35
Table 3 ... 36
7
List of Tables/Figures
Table 1. Sample size, response rate and demographic characteristics
Table 2. Prevalence of Physical Dating Violence in the United States
Table 3. Prevalence of Physical Dating Violence in Georgia
8
CHAPTER 1
Introduction
1.1 Background
Teen dating violence (TDV) is a significant public health issue defined as the physical,
emotional, psychological, and sexual abuse within a dating relationship, including stalking.
Approximately 1.5 million high school students are physically abused by dating partners each
year. The mental and physical health consequences of teen dating violence can extend into
adulthood. Unhealthy relationships in adolescence can create a cycle of abusive relationships
throughout a person’s life. The development and implementation of effective, tailored
intervention and prevention strategies are pertinent to stopping this cycle. Healthy People 2020
lists dating violence among youth as an area that needs further research, analysis, and monitoring
to better understand the trends, causes, and prevention strategies related to TDV [1].
TDV has both short and long term negative effects on the physical and mental health of
victimized youth. These youth are more likely to experience symptoms of depression and
anxiety, participate in unhealthy behaviors such as drug and alcohol use, exhibit antisocial
behavior, and express suicide ideation. It is important to understand which youth are more
vulnerable to experiencing violence in their relationships. Risk factors linked to an increased
likelihood for teen dating violence include substance use, belief that dating violence is
acceptable, witnessing or experiencing violence in the home, having a friend involved in dating
violence, depression and anxiety, and having conflicts with a partner [2].
Although teen dating violence transcends race, gender, and sexuality, certain subgroups are
more likely to experience TDV compared to others. Comparing TDV reports at the state level
9
racial/ethnic groups. Nationally representative data reveal that approximately 10% of high school
students in the U.S. reported physical victimization from a dating partner. Physical dating
violence occurs when a partner is hit, slapped, shoved, pinched, kicked or punched. Data from
the 2013 Youth Risk Behavior Survey (YRBS) show that levels of dating violence are higher
among students in Georgia than in most states. It is not sufficient to know that teen dating
violence affects a certain group of people in a certain area. Research is needed to find out why.
1.2 Purpose of Study
Research is needed to help understand the high prevalence of teen dating violence among
youth in Georgia and make recommendations for prevention and intervention strategies.
Utilizing the 2013 YRBS, this study will compare the prevalence of teen dating violence on a
state level and examine the prevalence of teen dating violence across demographic subgroups in
Georgia. I hypothesize that Hispanic high school students will be more likely to experience
physical dating violence compared to their peers.
1.3 Research Questions
What is the prevalence of physical dating violence among high school students in
Georgia?
How does the prevalence of physical dating violence among high school students in Georgia compare to the rest of the U.S.?
Does the prevalence of physical dating violence among high school students vary for
demographic subgroups within Georgia (i.e., race, sex or grade level)?
Are there any changes in physical dating violence prevalence among high school students
10
CHAPTER II
Review of Literature
2.1 Overview of Teen Dating Violence
Dating violence is manifested in various forms, including physical, sexual, emotional,
and psychological abuse by a dating partner. Physical forms of dating abuse include intentional
hitting, slapping, or being physically hurt by a boyfriend or girlfriend. There are various terms
used to describe TDV including intimate partner violence, dating abuse, domestic abuse,
domestic violence, and relationship abuse [3]. Teens, however, define and describe dating
violence in various ways unique to their beliefs and understanding. It is important to understand
the ways in which teenagers interpret dating abuse to better understand the issue in various
contexts and social interactions. A study among Canadian 9th and 11th grade students found that
youth defined behaviors as abusive only in certain contexts. For instance hitting or name calling
may be abusive in one context, but not in another context. It may not be considered abusive if it
is perceived as a demonstration of love or if the person is “joking” [4]. Gender differences were
present throughout the study as male students defined abuse by its intent, while females
measured abuse by its impact. More findings from this study revealed that boys used more
physical abused, compared to girls who were more likely to use psychological abuse. Youth
disclosed that fear and embarrassment were factors that hindered them from disclosing or
reporting dating victimization [4]. These findings are consistent with the DAVILA study which
reported approximately 37% of Latino teen victims of dating violence sought neither formal nor
informal help, due to various reasons including embarrassment, wanting to keep the abuse
private, or not recognizing they were abused [5]. Estimates among all youth show as little as 1 in
11
Dating violence victimization occurs in various settings including school, community,
home, and other private dwellings. A substantial number of dating violence incidents occur in
school or on school grounds. A study of high school students ages 13 to 18 found that 42% of
males and 43.2% of females who reported dating victimization stated the incident transpired in a
school building or surrounding grounds [7]. Research suggests that school climates, values, and
norms regarding violence may influence teen dating violence perpetration and victimization.
According to the social learning theory, new patterns of behaviors can be acquired through direct
experience or by observing others’ behaviors [8]. This can explain why high school students
exposed to violence in their communities and schools are more likely to exhibit violent or
aggressive behaviors. However, observing violence is not a single factor or precursor to
adopting a pro-violence attitude. An analysis of dating violence among African-American and
Latino high school students found that exposure to school violence is a significant predictor of
TDV perpetration among males and females when co-occurred with exposure to interparetnal
violence [9]. A study assessing the relationship between school climate and violent risk
behaviors found that students who felt teasing and bullying were widespread in their school had
a higher likelihood to engage in these same risk behaviors [10]. These findings may also be
applicable to witnessing and being exposed to teen dating violence in schools or being influenced
by peer dating norms, such as dating abuse or lack of relationship exclusivity [11]. These studies
suggest that high school students’ views and beliefs on dating violence may be shaped by
broader peer networks and social influences stemming from larger contexts such as schools.
Dating violence affects heterosexual and same-sex couples, as well as youth of different
gender, racial background, and socioeconomic status. However, females experience the highest
12
victims of intimate partner violence were female [12]. Due to significant variations among TDV
research studies, prevalence among adolescents varies based on the time frame of the study, the
population surveyed, and how dating violence is defined. For instance, a study using a nationally
representative sample of adolescents found that the prevalence of severe dating violence was
approximately 2.7% for girls and 0.6% for boys, equating to about 335,000 girls and 78,000
boys. This study assessed lifetime prevalence and defined severe dating violence as any form of
physical abuse, sexual abuse, and/or rape perpetrated by a girlfriend, boyfriend, or other dating
partner [13]. Results from the National Survey of Children’s Exposure to Violence found that
overall TDV rates ranged from 1.4% to 7.5%, depending on inclusion criteria, while the National
Longitudinal Study of Adolescent Health found that 32% reported dating violence victimization
(verbal and physical) [14]. Despite variabilities in prevalence reported in studies, teen dating
violence is a significant public health concern.
Few studies on adolescent dating violence have assessed the frequency of all types of
dating violence victimization and number of abusive partners. A retrospective study among
college students found that 64.7% of females and 61.7% of males reported experiencing any type
of dating violence (physical, sexual, and psychological/emotional) from age 13 to 19 [15]. More
than one-third of abused females reported having two or more perpetrators. The majority of TDV
victims reported experiencing 2 to 5 incidents of each type of dating violence. However,
approximately 15% of females and males reported 20 or more occurrences for certain dating
violence types [15]. This study faced several limitations such as lack of generalizability due to a
predominately White sample of young adults and potential recall bias. However, these important
findings reveal that TDV does not occur in isolated incidents, which adds to the urgency to
13
Research shows that violence overall, including intimate partner violence, has declined
substantially. The Federal Bureau of Investigation’s (FBI) Supplementary Homicide Reports
reveal that 10% of girls ages 12 to 15 and 22% of girls ages 16 to 19, murdered between 1993
and 1999, were killed by an intimate partner [16]. Since 1993, the overall rate of intimate partner
violence has drastically declined, from 9.8 victimizations per 1,000 persons age 12 or older to
3.6 per 1,000 [12]. Data from the YRBS 1999 to 2011 was used to assess the prevalence rate of
physical dating violence over a 12-year period and examine any trends based on gender and
race/ethnicity. This study revealed that there were no significant changes in the overall rate of
physical dating violence victimization reports from 1999 to 2011. The physical dating violence
rate remained steady among females and there was a minimal increase among males. Across this
12-year period, the prevalence among Black (12.9%) and Multiracial (12.2%) high school
students was significantly greater than among White (8.0%), Asian (8.0%), and Hispanic youth
(10.5%) [17]. However, the prevalence among Hispanic youth was significantly greater than
among Whites. This study found a trend among Hispanic males, who experienced a small, yet
statistically significant increase in dating violence victimization during the study period [17].
This analysis revealed that physical dating violence victimization among US high school
students has neither increased nor decreased, but an overall prevalence rate of 9 to 10% remains
an issue requiring prevention efforts in communities and schools.
2.2 Youth Dating Violence Outcomes
Studies have found that dating violence victimization has an impact on the physical and
psychological health of youth and is associated with a multitude of adverse health outcomes. One
of the most severe results of dating violence is homicide. Among the 63.1% of homicides from
14
year old girls murdered between 1980 and 2008 were murdered by their dating partners. Among
murdered males, ages 12 to 17, 0.5% was killed by a dating partner [18]. Not only are females
reported to be more likely to experience dating abuse, murdered female victims were more likely
than male victims to be killed by an intimate or dating partner.
Data from the National Longitudinal Study of Adolescent Health, a nationally
representative sample of US high schools and middle schools, was used to assess the outcomes
of 12 to 18 year old adolescents who experienced physical and psychological dating violence.
Five years post-victimization, female participants reported increased heavy episodic drinking,
depressive symptoms, smoking, suicidal ideation, and adult IPV victimization, while male
participants reported increased antisocial behaviors, suicidal ideation, marijuana use, and adult
IPV victimization [19]. Another study found that females who experienced physical and sexual
dating violence victimization from age 13 to 19 were at increased risk of eating disorders,
depressive symptoms, smoking, and engaging in risky sexual behavior (having five or more
sexual partners) in late adolescence [20].
Not only are victimized teens more likely to experience adverse health outcomes and
exhibit risky behaviors, they are also more likely to be victims of more than one type of dating
violence. Studies of co-occurring victimizations find that being victimized by a peer was highly
associated with being a victim of physical teen dating violence. Additionally, youth who
experienced dating violence victimization also reported sexual victimization. Sexual
victimization by a non-dating partner was a predictor of serious dating violence victimization.
Revictimization is another potential adverse outcome for individuals that experience teen dating
violence. A study found that adolescent dating violence was directly associated with physical
15
associated with physical IPV experienced 12 years later in adulthood [21]. These findings stress
the vitality of preventing and intervening unhealthy dating relationships during adolescence.
Dating violence among youth has been shown to be associated with high school students’
school connectedness and violent risk behaviors. Findings from the 2003 YRBS revealed that
lower self-reported grades in school were associated with higher reports of physical dating
violence; 6.1% of students who received mostly A's reported physical dating violence
victimization compared with 13.7% of students receiving mostly D's or F's. Additionally,
physical dating violence was significantly associated with four other risk behaviors that
contribute to violence: currently sexually active, attempted suicide, episodic heavy drinking, and
physical fighting [22]. An analysis of the 2013 YRBS found that high school students who
experienced all types of TDV (physical only, sexual only, both physical and sexual, and any)
were more likely to report missing school because of the following risk behaviors: they felt
unsafe, having a physical fight at school, carrying a weapon at school, and being bullied on
school property [23]. Victimized Latino youth also experience adverse school outcomes related
to dating violence. Thirty-one percent of participants in the DAVILA study that reported dating
violence victimization were suspended from school and 3.1% dropped out of school.
Additionally, 15% received special education services, which was associated with experiencing
physical dating violence [5].
2.3 Physical Dating Violence among Hispanic youth
In efforts to address physical dating violence disparities among Hispanic youth in
Georgia, it is important to examine cultural-specific risk and protective factors. According to
Georgia Latino Health Report, Hispanic youth in Georgia show higher levels of depression than
16
psychological impact of adaptation to a new culture [24]. Acculturative stress, in addition to
cultural gender roles may further exacerbate ethnic based disparities for TDV among Hispanics.
However, other cultural factors such as ethnic pride and family cohesion may serve as strong
protective factors against physical dating violence.
Dating Violence Among Latino Adolescents (DAVILA) study, which examined Latino
adolescents aged 12 to 18 over a period of time, found that 19.5% of Latino teens, approximately
1 in 5, experienced dating violence in 2012 [5]. Physical dating violence was experienced
among 6.6% of Latino youth, while psychological dating violence was the most reported (14%).
Unlike most reports that find females to be more likely to experience dating violence, Latino
males in this study were significantly more likely to report any dating violence [5]. This finding
is similar to the interesting trend revealed in an analysis of YRBS 1999-2010, which found an
increase in physical dating violence among Hispanic male youth. Girls reported more attempted
rape compared to males who reported more incidents of being slapped, pushed, shoved,
threatened, and had partners insist sex.
Data from DAVILA was used to evaluate associations between dating violence, cultural
factors, and risks of subsequent dating victimization. [25] Latino teens who experienced physical
dating violence victimization were 7.7 times more likely to experience sexual dating violence
victimization in the same year compared to someone who did not experience physical dating
violence [25]. These findings support that dating types overlap and victims are more prone to
experience two types of dating violence. Although a lack of studies research co-occurring
victimization among Hispanics specifically, the National Longitudinal Study of Adolescent
Health (ADD) found that of Latino victimized adolescents, 9.9% continued to be victims through
17
Twenty-seven percent of Latino dating partners studied experienced the onset of victimization as
young adults.
Research suggests that the loss of culture-specific factors due to acculturation may
increase rates of IPV as Latinos in the United States becomes more acculturated. A study that
assessed acculturation, ethnic identity, and dating violence victimization among Latino high
school students found language used in the home, parental birthplace, importance of ethnicity,
and ethnic discrimination were significantly associated with dating violence victimization for
females. Parental birthplace outside of the United States was significantly associated with a
reduced likelihood of dating violence victimization among females [26]. Adolescent females
who reported both parents were born outside the United States were 41% less likely to report
dating violence compared with those whose parents were born in the United States [26].
Additionally, females who indicated their ethnicity was very important had a reduced likelihood
(20%) of dating violence victimization. Increased dating violence victimization among females
was strongly associated with reports of ethnic discrimination, as those who perceived
discrimination were more than twice as likely to report dating violence [26]. This study suggests
that greater acculturation may be associated with greater prevalence of dating violence
victimization among females. These findings are similar to reports from DAVILA which found
that teens that were high on Latino orientation had lower odds of experiencing any dating
violence, than those low on Latino orientation. This difference in victimization reports could be
due to cultural values that emphasize connectedness, family support, and the benefit of the
collective group [5].
Multiple community and school based TDV prevention programs have been developed to
18
programs are not geared toward predominately Hispanic youth populations. There is also scarcity
of research studies that examine the effectiveness of TDV prevention programs in reducing
victimization and perpetration specifically among Hispanic teens [27]. A review of existing
research found that only three TDV prevention programs have been developed and empirically
studied that focused on a predominately Hispanic population, with only one addressing the role
of Hispanic cultural factors such as ethnic pride and traditional gender roles [27]. Only one of
these three studies examined the long-term effects of TDV interventions for this specific
population. This study assessed the immediate and six month outcomes of Break the Cycle’s
Ending Violence curriculum in urban schools with a student population of at least 80% Latinos.
Among study participants, there was increased knowledge about legal rights associated with
dating violence, higher likelihood victims would seek help, increased positive perceptions about
seeking help, and less acceptance of female perpetration against males [9]. However, at
follow-up, there were no changes in reports of dating violence victimization or perpetration or recent
abusive dating experiences. The findings reveal the benefits of dating violence prevention
programs geared towards Latino youth, but also suggest that actual behavioral changes may be
difficult to achieve with brief prevention curriculums alone.
2.4 Teen Dating Violence Policies
Federal law and many state laws define domestic violence as abuse perpetrated by a
current or former spouse, co-habitant, or co-parent. Legislation pertaining to dating violence
among adolescents varies considerably from state to state. In certain states, domestic violence
laws apply only to individuals 18 years and older who are in specific types relationships, which
often include cohabitating. However, other states have domestic violence laws that protect
19
[16].Georgia’s domestic violence law, Family Violence Act, protects those who are abused by
current or former spouses, parents of the same child, parents and children, stepparents and
stepchildren, foster parents and foster children, or persons currently or formerly living in the
same household. This law does not apply to romantic relationships where individuals have never
lived together. Consequently, many victimized youth in Georgia are not easily able to obtain
protective orders or protection from partner abuse.
Studies have found that young victims of physical dating violence often experience abuse
on school grounds, but there is a lack of school policies establishing safety, security, and
intervention for students experiencing dating violence. Georgia Code Ҥ 20-2-314 Development
of rape prevention, personal safety education, and teen dating violence prevention programs”
requires the Georgia State Board of Education to develop a rape prevention and personal safety
education program and a program to prevent teen dating violence for grades 8-12 [28]. However,
schools are not required to implement such programs; they are only encouraged to do so. Local
boards may implement these programs at any time they deem necessary and for any grade level.
In addition to lack of school-based prevention programs and policies related to teen dating
violence, school personnel are not equipped with the tools needed to respond to dating violence
incidents.
A national study of randomly sampled high school counselors found that 81.3% did not
have a protocol in their schools to respond to TDV incidents. Additionally, 90% of counselors
reported that training to assist survivors of TDV had not been provided to personnel in the past
two years. The majority of counselors (83%) also reported their school did not administer
periodic student surveys to assess dating violence behaviors and 76% reported their school did
20
Start Strong: Building Healthy Teen Relationships, lasting from 2008 to 2012, was a
national program that promoted healthy relationships among 11 to 14 year olds, developed
prevention strategies, and influenced TDV policy changes. An evaluation of the program found
positive impacts on student behaviors, as well as progress on policies related to youth dating
violence. By fall 2012, over half of the Start Strong communities achieved policy changes to
TDV-related school district policies. Additionally, Start Strong sites provided technical
assistance and increased awareness to inform changes to state legislation, strengthening state
legislation in three states [30]. This evaluation shows the importance of conducting policy
assessments on local levels and how policy can be used to increase legislative support for TDV
21
CHAPTER III
Methods
3.1 Data Source
This study used data from the 2013 YRBS Survey conducted by CDC. The YRBS, an
element of the Youth Risk Behavior Surveillance System (YRBSS), is a national school-based
survey that is conducted biennially and provides data representative of students in grades 9–12
attending U.S. high schools. YRBSS data are used to compare prevalence of health behaviors
among students, monitor progress in improving health outcomes among youth, assess trends in
health risk behaviors, and help create and evaluate health policies and programs. Additionally,
YRBSS provides comparable national, state, territorial, and large urban school district data.
Nationally representative data for YRBS is provided by surveys conducted by states, territories,
tribal governments, and large urban school districts that receive funding from CDC [31].
The YRBS utilizes a three-stage cluster sample of students from a target population of
public and private students in grades 9-12 in all 50 states and the District of Columbia [32]. The
selected sample produces estimates that are accurate within ±5% at a 95% confidence level [31].
Fifty-four of 1,276 primary sampling units (PSUs ) were sampled from the first-stage sampling
frame. In the second stage of sampling, 193 schools with any of grades 9–12 were sampled. The
third stage of sampling consisted of random sampling in each of grades 9–12 and all students in
sampled classes were eligible to participate [32]. Student privacy is protected by voluntary and
anonymous participation and parental permission procedures are followed before surveys are
22
The 2013 YRBS questionnaire contained 86 questions and were completed in 148 of 193
sampled public and private schools for a 77% school response rate. The student response rate
was 88%. Out of 15,583 sample students, 13,633 submitted questionnaires and fifty
questionnaires were excluded due to failed quality control, leaving 13,583 questionnaires for
analysis [32]. Of 13,583 sample students, 50% were female, 55.6% were White, and 27.3% were
in 9th grade. The overall response rate was 68% [33]. In Georgia specifically, the student sample
size equaled 1,992 with a school response rate of 70%, a student response rate of 87%, and an
overall response rate of 61% [32]. Of these students, 50.5% were male, 46.1% were White, and
29.8% in 9th grade.
3.2 Variables
Physical dating violence was defined by a response to the following question: “During
the past 12 months, how many times did someone you were dating or going out with, physically
hurt you on purpose? (Count such things as being hit, slammed into something, or injured with
an object or weapon).” Participants answered with one of the following responses: “I did not date
or go out with anyone during the past 12 months”, “0 times”, “1 time”, “2 or 3 times”, “4 or 5
times,” or “6 or more times.”
Demographic subgroups of interest included gender (male or female), race (American
Indian or Alaska Native, Asian, Black or African American, Hispanic or Latino, Native
Hawaiian or Other Pacific Islander, White, or Multiple Race), and grade level (9th, 10th, 11th, or
12th). Race/ethnicity was computed from the following two questions and response choices: “Are
23
American Indian or Alaska Native, Asian, Black or African American, Hispanic or Latino,
Native Hawaiian or Other Pacific Islander, White.”
3.3 Analysis
Data was analyzed utilizing YRBSS Youth Online, a data-query application used to view
survey results, create tables and graphs, examine trends, and compare results from different
geographical locations.Youth Online was used to determine statistical differences between
physical dating violence reports by race, gender, and grade level. It was also used to compare
physical dating violence reports between states and compare prevalence rates between 2013 and
2015.
YRBS Survey results were accessed by first selecting the criteria for survey type (High
School) and then selecting the health topic (Unintentional Injuries and Violence) and question
(Experienced physical dating violence). The location (All locations, United States, Georgia) and
year (2013) were then selected to retrieve survey results. Data for subgroups were viewed by
selecting race, grade, and sex variables.
Differences between 2 data points were computed using T-tests generated by Youth
Online. T-tests were conducted to compare the following variables: physical dating violence
prevalence in 2013 and 2015; physical dating violence reports among Blacks, Whites, and
Hispanics; physical dating violence reports among males and females; physical dating violence
reports among grades 9th, 10th, 11th, and 12th; physical dating violence reports between Georgia
24
CHAPTER IV
Results
There was no change in physical dating violence among high school students nationwide
from 2013 (10.3%; 95% CI: 9.2, 11.4) to 2015 (9.6%; 95% CI 8.8, 10.6), p =.38. Among the
73.9% of students nationwide who were involved in dating, 10.3% had been hit, slammed into
something, or injured with an object or weapon on purpose by their partner one or more times
during the 12 months before the survey. The prevalence of physical dating violence among high
school students varied across demographic subgroups (Table 2). The findings show that gender
differences exist in teen physical dating violence incidences nationwide as female students were
more likely to experience physical dating violence than males. The prevalence of physical dating
violence nationwide was higher among female (13.0%; 95% CI: 11.6, 14.5) than male (7.4%;
95% CI: 6.4, 8.6) high school students. Students in 12th grade (11.7%; 95% CI: 10.4, 13.2) were
more likely to experience physical dating violence compared to students in 9th grade (8.8%; 95%
CI: 7.6, 10.2).
Nationwide, there were no significant differences found between physical dating violence
experienced by Hispanics (10.4%; 95% CI: 9.0, 10.0) and Whites (9.7%; 95% CI: 8.2, 11.5),
p=.50. No significant differences were found between physical dating violence experienced by
Hispanic (10.4%; 95% CI: 9.0, 10.0) and Black high school students (10.3%; 95% CI: 8.5, 12.4),
p=0.91. Additionally, no significant differences were found between physical dating violence
reports by White (9.7%; CI 95%: 8.2, 11.5), and Black students (10.3%; 95% CI: 8.5, 12.4),
p=.069.
Among the 38 states that reported data on physical dating violence, the prevalence of
25
(12.4%) only preceded by Louisiana (14.8%) and Arkansas (13.8%) for reports of physical
dating violence. The prevalence of teen dating violence did not vary for gender and grade-level
in Georgia, however it did vary for race. In Georgia there was no statistical difference in
physical dating violence reports between male (11.6%; CI: 9.1, 14.7) and female high school
students (12.9%; %95 CI: 9.9, 16.5), p =.42. There were also no statistical differences between
grade levels 9th (11.7%; 95% CI: 7.7, 17.3), 10th (12.5%; 95% CI: 9.0, 17.0), 11th (12.5%; 95%
CI: 7.9, 19.1), and 12th (11.1%; 95% CI 7.4, 16.4).
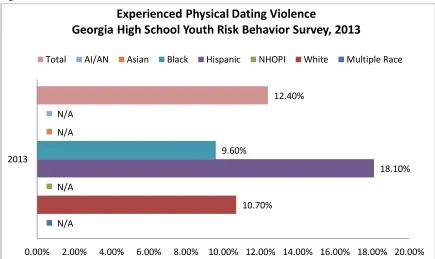
The prevalence of physical dating violence in Georgia among Hispanic high school
students (18.1%) was significantly higher compared to Whites (10.7%) and African-Americans
(9.6%) (Figure 1). In Georgia, Hispanics (18.1%; 95% CI: 13.2, 24.2) were more likely to
experience physical dating violence compared to African-Americans (9.6%; 95% CI: 6.8, 13.3),
p=0.02. Hispanics were also more likely to experience physical dating violence compared to
Whites (10.7%; 95% CI: 8.3, 13.8) p= 0.03. Hispanics in Georgia (18.1%; 95% CI: 13.2, 24.2)
were more likely to experience physical dating violence compared to Hispanics nationwide
(10.4%; 95% CI: 9.0, 10.0), p= 0.01. Additionally, males in Georgia (11.6%; CI: 9.1, 14.7) were
more likely to experience physical dating violence compared to males nationwide (7.4%; 95%
CI: 6.4, 8.6), p=0.01. There were no differences in physical dating violence likelihood between
26
CHAPTER V
Discussion and Conclusion
The results of this study reveal prevalence of physical dating violence among high school
students in the United States has not changed significantly since 1999. However, dating violence
remains an important public health issue as 10.3% of high school students have recently reported
being a victim of physical dating violence. Nationwide, 12th grade students were more likely to
report physical dating violence compared to 9th graders. Consistent with multiple research
findings, females were more likely than males to experience physical dating violence. In Georgia
however, there were no statistical differences between male and female victimization reports or
between grade levels.
National efforts are being made to address teen dating violence and should also be
reflected on state and local levels. Examining teen dating violence reports on solely a national
level can mask varying prevalence in different states and overlook the disparities affecting
individual geographical areas. This study found that Georgia, compared to most states, has high
reports of physical dating violence. Additionally, Hispanic high school students in Georgia are
more likely than their peers to experience physical dating violence. This outcome could have
cultural implications as Hispanic youth make up a smaller portion of the studied population, but
are experiencing a large rate of physical dating victimization.
These findings give insight into the magnitude of physical dating violence among
Hispanic high schools students in Georgia and the need for TDV prevention programs that
address ethnic pride, acculturation, family cohesion, and traditional gender roles within Latino
communities [34]. However, these cultural factors and the extent of their influence need to be
27
suggest that immigrant-status may not report violence due to fear of being deported. However, a
study among Latino adolescents found that help-seeking was not influenced by acculturation or
immigrant status [5]. There are additional ambiguities in the literature and findings regarding
Hispanic cultural influences as risk and protective factors. Values such as family cohesion,
respeto (respect), personalismo (formal friendliness), and ethnic pride are viewed as cultural
strengths among Hispanic families and may serve as protective factors against dating violence
victimization [5]. Research shows that low levels of family cohesion and higher levels of family
and acculturation conflict are associated with risk for dating violence victimization. On the other
end of the spectrum, upholding traditional Hispanic gender roles (i.e. machismo and marianismo)
has been linked to increased risk for dating abuse victimization. These cultural values need to be
measured among Hispanic youth involved in dating violence, as a perpetrator or victim, to fully
understand the context and magnitude of these factors. Two interesting findings were revealed in
the literature pertaining to higher reports and an increase of dating abuse victimization among
Hispanic male teens. An analysis of YRBS trends found a small, statistically significant increase
in physical dating violence among Hispanic male high school students from 1999 to 2011. The
DAVILA study reported that young Hispanic males were more likely to report any dating
violence, physical dating violence, sexual dating violence, and psychological dating violence
than girls [5]. Inconsistent with most reports of females being more likely to experience dating
violence victimization, these findings suggest a need for more research on TDV victimization
among Hispanic male youth.
Direct local action is limited without local data on physical dating violence among youth.
The findings from this study should prompt schools and local communities to monitor all forms
28
revealed that culturally specific influences are important elements for public health professionals
and policy makers to explore in efforts to reduce and prevent teen dating violence.
5.2 Limitations
There are several limitations of this study that must be considered. First, responses to
YRBS questions are self-reported, which may result in underreporting or overreporting of
physical dating violence victimization. Second, YRBS results may not be representative of all
youth in this age group because participants only include those who attend school [32]. This
excludes those who are home-schooled, not actively attending school, or imprisoned. In 2009,
approximately 4% of persons nationwide, ages 16 to17, were not enrolled in high school and had
not completed high school [31]. These youth in particular may be most at risk for
violence-related behavioral issues such as dating violence. In addition, exclusion of these groups may not
assess the full magnitude of physical dating violence among teens. Third, 2013 YRBS state-level
data are not available for all 50 states. Physical dating violence reports were not available for 9
states (Arizona, California, Colorado, Indiana, Iowa, Massachusetts, New Jersey, Ohio, and
Pennsylvania). Also, Minnesota, Oregon, and Washington do not participate in the YRBSS.
Some states that participate, do not achieve a high overall response rate to receive weighted
results. If data from all states had been reported, Georgia may not have ranked as 3rd highest
among physical dating violence prevalence.
Due to changes in the question and response options starting in 2013, long-term
chronological trends are not available for the prevalence of physical dating violence [35]. For
Georgia’s physical dating violence reports, sample size was less than 100 for Hispanic males and
females. This resulted in an inability to assess if Hispanic males were more or less likely than
29
5.3 Implications
These findings suggest multiple areas of potential prevention and research for teen dating
violence in Georgia. Based on the high prevalence of physical dating violence in Georgia,
particularly among Hispanic youth, research is needed to better understand risk factors stemming
from culturally-specific attributes. Among this population, more research is needed to assess the
dating experiences of victimized Hispanic male youth, as some reports suggest this group is
more likely to experience dating abuse. Prevention programs that have proven to be successful
need to be evaluated among majority Hispanic populations to assess the effectiveness of such
programs for short- and long-term outcomes in this specific ethnic group.
Based on findings that Hispanics and males in Georgia are more likely to experience
physical dating violence compared to nationwide prevalence, gaps in community data regarding
physical dating violence need to be filled. Recently, more attention has been given to dating
violence experienced in adolescence as the focus of IPV data and research has generally been
among adults. This study found that dating violence is prevalent among adolescents and teens,
which warrants continuous research on trends, risk factors, and protective factors for this
vulnerable population. Community assessments and local studies will provide more specific
information on the magnitude of teen dating violence and how geographical or community-level
influences affect TDV. The YRBS provides insightful representative data on physical data
violence and should be extended to assess additional measures such as socioeconomic status and
culturally driven risk behaviors.
In order to better assess why Georgia experiences high prevalence of teen dating
violence, policy assessments and evaluations can determine if and how school, state, or national
30
prevented through education, awareness, and policies. Studies have shown that prevention
curriculums alone are not sufficient to change behavior among victims or perpetrators of TDV. A
combined effort is needed to address influences associated with TDV at all levels from
individual to societal. Approximately 40% of males and females, who reported teen dating
violence, stated the abuse occurred in school or on school property. Additionally, school and
peer norms surrounding dating violence create social influences on youth’s likelihood to be
involved in TDV. The Georgia State Board of Education is required to develop a rape prevention
program and program teen dating violence prevention program for students in grades 8- 12.
However, there are no evaluations of this policy or data on where these programs have been
implemented. National school policies and prevention programs regarding dating violence need
to be standardized and not simply created, but also implemented. In addition to improving
education and awareness among students, school districts should work together to ensure
teachers and staff are trained to respond to dating violence and recognize when it occurs.
In efforts to address racial/ethnic disparities revealed in this study, prevention programs
that target social and cultural factors need to be created for vulnerable subpopulations,
specifically Hispanic youth. Prevention programs geared towards minorities cannot be
implemented in schools or communities if they do not exist. As previously stated, TDV
prevention programs should build on the cultural strengths of Hispanic youth by focusing on
protective influences such as family connectedness and ethnic pride. Overall, there is more to
learn about teen dating violence and how cultural factors play a role in victimization. There are
multiple challenges that must be overcome to accomplish this. One of these barriers is teens’
reluctance to report dating victimization due to fear, embarrassment, belief that violence is
31
and implemented to correct these barriers and misconceptions. Ultimately, a combination of
prevention and intervention strategies and policies are needed to prevent and deter physical
dating violence among youth.
5.4 Conclusion
The results of this study reveal that Georgia has the third highest prevalence of physical
dating violence among high school students in the United States. These analyses also indicate
that Hispanic youth in Georgia experience physical dating violence at significantly higher rates
than their peers. Culturally-specific risk factors and influences need to be explored to further
understand this growing disparity. In order to develop successful intervention and prevention
strategies to reduce physical dating violence and address disparities, there needs to be a shift in
32
References
1. Injury and Violence Prevention, Healthy People 2020. (2017). Healthypeople.gov. Retrieved March 2017, from
https://www.healthypeople.gov/2020/topics-objectives/topic/injury-and-violence-prevention
2. Understanding teen dating violence. (2016). CDC. Retrieved March 2017, from https://www.cdc.gov/violenceprevention/pdf/teen-dating-violence-factsheet-a.pdf
3. Teen Dating Violence, Intimate Partner Violence, Violence Prevention. (2017). Cdc.gov. Retrieved March 2017, from
https://www.cdc.gov/violenceprevention/intimatepartnerviolence/teen_dating_violence.ht ml
4. Sears, H., Byers, E., Whelan, J., & Saint-Pierre, M. (2006). “If It Hurts You, Then It Is Not a Joke”. Journal Of Interpersonal Violence, 21(9), 1191-1207.
5. Sabina, C., & Cuevas, C. (2013). The experience of dating violence among Latino adolescents. Retrieved from http://carloscuevasphd.com/davila-general-population.pdf
6. Ashley, O. S., & Foshee, V. A. (2005). Adolescent help-seeking for dating violence: Prevalence, sociodemographic correlates, and sources of help. Journal of Adolescent Health, 36(1), 5-31.
7. Molidor, C., & Tolman, R. (1998). Gender and Contextual Factors in Adolescent Dating Violence. Violence Against Women, 4(2), 180-194.
8. Bandura, A. (1977). Social Learning Theory. New York: General Learning Press. Retrieved from
http://www.esludwig.com/uploads/2/6/1/0/26105457/bandura_sociallearningtheory.pdf
9. O’Keefe Maura. Factors Mediating the Link between Witnessing Interparental Violence and Dating Violence. Journal of Family Violence. 1998;13(1):39–57
10.Klein Jennifer, Cornell Dewey, Konold Timothy. Relationships between Bullying, School Climate, and Student Risk Behaviors. School Psychology
Quarterly. 2012;27(3):154–169
11.Giordano, P., Kaufman, A., Manning, W., & Longmore, M. (2015). Teen Dating Violence: The Influence of Friendships and School Context. Sociological Focus, 48(2), 150-171.
33
13.Wolitzky-Taylor, K., Ruggiero, K., Danielson, C., Resnick, H., Hanson, R., & Smith, D. et al. (2008). Prevalence and Correlates of Dating Violence in a National Sample of Adolescents. Journal Of The American Academy Of Child & Adolescent Psychiatry, 47(7), 755-762.
14.Hamby, S., & Turner, H. (2013). Measuring teen dating violence in males and females: Insights from the national survey of children’s exposure to violence. Psychology Of Violence, 3(4), 323-339.
15.Bonomi, A., Anderson, M., Nemeth, J., Bartle-Haring, S., Buettner, C., & Schipper, D. (2012). Dating violence victimization across the teen years: Abuse frequency, number of abusive partners, and age at first occurrence. BMC Public Health, 12(1).
16.Hickman, L., Jaycox, L., & Aronoff, J. (2004). Dating Violence among Adolescents. Trauma, Violence, & Abuse, 5(2), 123-142. http://dx.doi.org/10.1177/1524838003262332
17.Rothman, E., & Xuan, Z. (2014). Trends in Physical Dating Violence Victimization Among U.S. High School Students, 1999–2011. Journal Of School Violence, 13(3), 277-290.
18.Cooper, A., & Smith, E. L. (2011). Homicide trends in the United States, 1980-2008. Retrieved from http://bjs.ojp.usdoj.gov/content/pub/pdf/htus8008.pdf
19.Exner-Cortens, D., Eckenrode, J., & Rothman, E. (2013). Longitudinal Associations Between Teen Dating Violence Victimization and Adverse Health
Outcomes. Pediatrics, 131(1), 71–78. http://doi.org/10.1542/peds.2012-1029
20.Bonomi, A., Anderson, M., Nemeth, J., Rivara, F., & Buettner, C. (2013). History of dating violence and the association with late adolescent health. BMC Public Health, 13(1).
21.Exner-Cortens, D., Eckenrode, J., Bunge, J., & Rothman, E. (2017). Revictimization After Adolescent Dating Violence in a Matched, National Sample of Youth. Journal Of Adolescent Health, 60(2), 176-183.
22.Physical Dating Violence Among High School Students --- United States, 2003. (2006). Cdc.gov. Retrieved 18 April 2017, from
https://www.cdc.gov/mmwr/preview/mmwrhtml/mm5519a3.htm#top
23.Vivolo-Kantor, A., Olsen, E., & Bacon, S. (2016). Associations of Teen Dating Violence Victimization With School Violence and Bullying Among US High School Students. Journal Of School Health, 86(8), 620-627.
34
http://www.healthcaregeorgia.org/uploads/publications/Georgia_Latino_Health_Report_ 2012.pdf
25.Sabina, C., Cuevas, C., & Cotignola-Pickens, H. (2016). Longitudinal dating violence victimization among Latino teens: Rates, risk factors, and cultural influences. Journal Of Adolescence, 47, 5-15.
26.Sanderson, M., Coker, A., Roberts, R., Tortolero, S., & Reininger, B. (2004).
Acculturation, ethnic identity, and dating violence among Latino ninth-grade students. Preventive Medicine, 39(2), 373-383.
27.Malhotra, K., Gonzalez-Guarda, R., & Mitchell, E. (2015). A Review of Teen Dating Violence Prevention Research. Trauma, Violence, & Abuse, 16(4), 444-465.
28.Teen Dating Violence. (2017). Ncsl.org. Retrieved March 2017, from http://www.ncsl.org/research/health/teen-dating-violence.aspx
29.Khubchandani, J., Price, J.H., Thompson, A., & Dake, J.A.,(2012). Adolescent Dating Violence: A National Assessment of School Counselors' Perceptions and Practices. Pediatrics, 130(2), 1-9.
30.Robert Wood Johnson Foundation. (2013). Start Strong: Building Healthy Teen Relationships Retrieved from
http://www.rwjf.org/content/dam/farm/reports/evaluations/2013/rwjf407673
31.Centers for Disease Control and Prevention. Methodology of the Youth Risk Behavior Surveillance System — 2013. MMWR 2013;62. Retrieved March 2017 from,
https://www.cdc.gov/mmwr/pdf/rr/rr6201.pdf
32.Kann L, Kinchen S, Shamklin SL, et al. (2013) Youth Risk Behavior Surveillance – United States, 2013. MMWR Recomm Rep 2014; 63. Retrieved March 2017, from http://www.cdc.gov/mmwr/pdf/ss/ss6304.pdf.
33.2013 YRBS Data User’s Guide. (2014). Retrieved from
http://ftp://ftp.cdc.gov/pub/data/yrbs/2013/YRBS_2013_National_User_Guide.pdf
34.Malhotra, K., Gonzalez-Guarda, R., & Mitchell, E. (2015). A Review of Teen Dating Violence Prevention Research. Trauma, Violence, & Abuse, 16(4), 444-465.
35.Kann L, McManus T, Harris W, et al. Youth Risk Behavior Surveillance — United States, 2015. MMWR Surveill Summ 2016;65. Retrieved March 2017 from,
35
TABLE 1. Sample sizes, response rates, and demographic characteristics— United States and Georgia, Youth Risk Behavior Survey, 2013 Sample
Size
Response Rate (%)
Sex (%) Grade (%) Race/Ethnicity (%)
Site School Student Overall Female Male 9 10 11 12 White† Black† Hispanic† Other§
National Survey
13,583 77 88 68 50.0 50.0 27.3 25.7 23.8 23.1 55.6 14.3 21.1 8.9
Georgia Survey
1,992 70 87 61 49.5 50.5 29.8 26.3 22.0 21.4 46.1 37.6 9.8 6.4
† Non-Hispanic. § American Indian or Alaska Native, Asian, Native Hawaiian or other Pacific Islander, and multiple race (non-Hispanic).
Table 2. Experienced physical dating violence, United States, Youth Risk Behavior Survey, 2013
Race
Sex Total AI/AN† Asian‡ Black‡ Hispanic NHOPI§ White‡ Multiple Race‡
Total 10.3 (9.2–11.4) 9,930|| N/A 89 10.6 (5.3–20.1) 223 10.3 (8.5–12.4) 2,351 10.4 (9.0–12.0) 2,426 N/A 86 9.7 (8.2–11.5) 4,040 11.8 (8.4–16.3) 503
Female 13.0 (11.6–14.5) 4,876 N/A 46 8.1 (3.5–17.8) 123 12.3 (9.6–15.6) 1,163 13.6 (11.9–15.5) 1,190 N/A 35 12.9 (11.0–15.1) 1,981 15.4 (10.6–22.0) 263
Male 7.4 (6.4–8.6) 5,043 N/A 43 13.4 (6.0–27.3) 100 8.2 (6.6–10.3) 1,186 7.0 (5.3–9.1) 1,236 N/A 51 6.4 (4.9–8.2) 2,057 8.0 (4.3–14.3) 240
[image:36.792.44.770.277.440.2]36
Table 3. Experienced Physical Dating Violence, Georgia, Youth Risk Behavior Survey, 2013
Sex
Race Total Female Male
Total 12.4 (10.2–15.1) 1,316†
12.9 (9.9–16.5) 669
11.6 (9.1–14.7) 635
American Indian or Alaska Native‡ N/A 13
N/A 8
N/A 5
Asian§ N/A
33
N/A 18
N/A 14
Black or African American§ 9.6 (6.8–13.3) 443
10.6 (6.5–16.6) 240
8.4 (5.9–11.8) 203
Hispanic or Latino 18.1 (13.2–24.2) 167
N/A 89
N/A 72
Native Hawaiian or Other Pacific Islander|| N/A 9 N/A 4 N/A 5
White§ 10.7 (8.3–13.8) 560
11.2 (7.3–16.8) 270
10.2 (7.2–14.4) 290
Multiple Race§ N/A
51
N/A 28
N/A 23
37 Figure 1.
N/A < 100 respondents for subgroups N/A
10.70% N/A
18.10% 9.60%
N/A N/A
12.40%
0.00% 2.00% 4.00% 6.00% 8.00% 10.00% 12.00% 14.00% 16.00% 18.00% 20.00%
2013
Experienced Physical Dating Violence
Georgia High School Youth Risk Behavior Survey, 2013