Substrate Influence on the Recrystallization of
1,2-Dodecanediol: An Atomic Force Microscopy Study
S. K. Dora
NanoMagnetics Instruments Pvt. Ltd., Turkey
Copyright©2017 by authors, all rights reserved. Authors agree that this article remains permanently open access under the terms of the Creative Commons Attribution License 4.0 International License
Abstract
1,2-dodecanediol otherwise known as lauryl glycol (LG), a skin conditioning agent in many skin cosmetics was recrystallized from chloroform on to a number of different technical substrates to understand how material properties affect their recrystallization behavior at the molecular level. For this purpose, four different technical substrates were chosen based on their polarity and crystallinity. On highly oriented pyrolytic graphite or HOPG (nonpolar, crystalline), LG recrystallization formed parallelogram-like-structures in the initial stage. On nonpolar, amorphous substrate like glassy carbon (GC) stalactite-like-structures were observed. Contrary to this, on polar substrates like mica (polar, crystalline) and glass (polar, amorphous), LG molecules were recrystallized as thin film. The morphological changes of LG at different time intervals were investigated and their mechanism of recrystallization on all the substrates is discussed in detail for the first time. Direct view of the recrystallization process at the molecular level on different technical substrates can be used as a model in understanding how these molecules as a constituent in skin cosmetic products behave, when applied to skins of varying physical and chemical barrier ultimately helping in better cosmetic development.Keywords
1,2-dodecanediol, Tapping Mode AFM,Recrystallization, Substrate Effect
1. Introduction
Straight-chain 1,2-alkanediols are multifunctional ingredients with moisturizing and antimicrobial activities [1-7]. They have been used in household and cosmetic products since very long time as solvents [1], viscosity modifiers [1, 2], cryoprotectors [3] as well as moisturizers [4]. Due to their low toxicity and strong antimicrobial properties, they have replaced the traditional preservatives such as parabens, potassium sorbate, sodium benzoate, and formaldehyde-releasing compounds in cosmetic products [1,
This change in amplitude is measured by a feedback control and plotted as an AFM image. Details of tapping mode AFM operation can be found in the literature [10]. In the last few decades, AFM played a vital role to study absorption and recrystallization mechanisms at the nano level [11-15]. The advantage of understanding the detailed absorption mechanism of LG at the nanoscale is actually two-fold. First, it will help understanding how material properties affect its absorption behavior. For instance, understanding of absorption of LG molecules on non-polar substrate like HOPG may be used as a model to understand their absorption on human skin which is also nonpolar in nature. Second, it will develop interest in scientists especially those working in the field of cosmetics to use AFM as an effective tool to learn about the absorption of other diols and constituents used in cosmetics at the nanoscale. Understanding the detailed absorption mechanism of such constituents will ultimately help the scientists to design better cosmetic products. For this purpose, in this study a low concentration of 0.4 mg/mL was used to understand their absorption phenomena at the LG-substrate interface on a number of different technical substrates. The technical substrates were chosen based on their polarity and crystallinity. They are highly oriented pyrolytic graphite in short HOPG (polar, crystalline), glassy carbon in short GC (nonpolar, amorphous), glass (polar, amorphous) and mica (polar, crystalline). Understanding the phenomenon at the nano level is also beneficial from consumer point of view as recent advances in nanotechnology has made it possible to manufacture products that provide dramatic visible improvements in skin quality in a matter of few weeks or in some cases in few days.
2. Experimental
In this study four different types of substrates are used depending upon their polarity and crystallinity. They are classified as HOPG (nonpolar, crystalline), glassy carbon (nonpolar, amorphous), mica (polar, crystalline) and glass (polar, amorphous). For HOPG and mica, new substrate surface was prepared by removing few top layers using adhesive tape. Cleaning of microscopic glass slides were carried out by putting them in a beaker containing ethanol under ultrasonic bath for 15 minutes. Sonication is a technique where sound energies with frequencies > 20kHz are applied to the samples to agitate particles for various purposes. In this experiment sonication was used to remove any adhering dust particles to substrates used in the experiment. Commercially available glassy carbon (GC) from HTW Germany was purchased and was cleaned like glass before using in this study.
AFM measurements were carried out in tapping mode using an Agilent 5500 system under ambient condition. PPP-NCH cantilevers from Nanosensors with a nominal resonant frequency of ~ 300 kHz were used for observation
of crystal growth process at different time intervals. Imaging conditions employed were a scan size of 4.9 × 4.9 µm2, a scan rate of 0.612 Hz, and an image size of 256 × 256 pixels. The set point was chosen close to the upper limit possible and all measurements were performed at room temperature (~22-240C). Recrystallization process at different time intervals was observed by AFM, after applying a 10 µL droplet of 0.4 mg/mL LG mass in chloroform on to different substrates. The chloroform took ca. 30 seconds to evaporate from the surface leaving the LG molecules attached to the substrates. The substrates were then mounted to the AFM sample plate by using metal clips separately. The first image acquisition started as soon as possible after the chloroform evaporation, typically after ~10 minute. AFM images were taken from the same substrate area at different time intervals applying a constant scan rate of 0.612 Hz. Experimental data was analyzed by using the program WSxM (Version 4.0 Beta 8.3; Nanotec Electronica, Madrid, Spain) [16].
3. Results
This section describes the details of morphological changes of LG molecules at various time intervals after recrystallizing them on different technical substrates. Depending on the nature of substrates used, the recrystallized LG structures varied. The principle findings of these structural variations with respect to time are presented here.
3.1. LG Recrystallization on HOPG
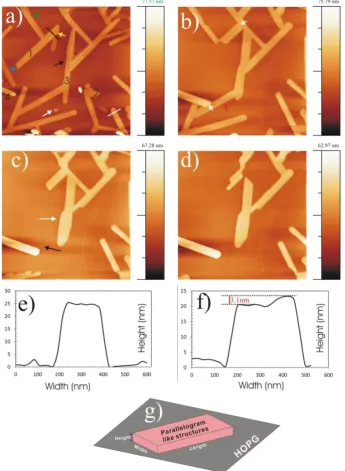
of these structures was found to be ~ 24 nm. As examples the height profiles along black and white line in fig. 1a (see profile heights in fig. 1e and 1f) have heights of ~ 24 nm for both the structures. This holds true for other areas of the HOPG surface also. Just to emphasize that all heights are measured from the lowest point on the surface assuming it to be HOPG surface. A closer look also revealed that individual structures are having multiple layers. The height profile of
[image:3.595.133.479.184.656.2]one such visible layer has given a height of ~ 3.1 nm (see the yellow arrow in fig. 1a and the vertical red line in fig. 1f). Some of these parallelogram-like-structures also seem to be partially overlapping sidewise (green arrow, fig. 1a) or merged completely in sidewise fashion along their width to form structures of larger width (blue arrow, fig. 1a). Further, they are also found to be arranged in a triangular fashion on HOPG (dotted white triangle marked in fig. 1a).
The observed structure in fig. 1a has undergone considerable morphological changes after ~ 2 hours (fig. 1b, ~ 126 min). Simultaneous dissolution and growth of few individual parallelogram-like-structures were noticed during image acquisition. A closer look also revealed that a single parallelogram-like-structure can both dissolve and grow simultaneously. For example, the one marked by number ‘1’ in fig. 1a was found to be undergoing dissolution from one end and growth at the other end in fig. 1b. Complete dissolution of some of these structures is also observed (see the one marked by number ‘2’ in fig. 1a disappeared completely in fig. 1b). Few of these structures were found to have grown both along their length and width but their heights remain constant. For instance structures in fig. 1a marked by number ‘3’ has grown along its width and marked by number ‘4’ has growth both along length and width in fig. 1b. In addition, growth of individual structures was found be terminating by the presence of obstacles e.g. another parallelogram-like-structure across its growth direction. See for instance, the white marked arrow junctions in fig. 1b acted as terminating points for the growth of the parallelograms.
Further topographical changes of the same surface recorded after 4 hours (~257 min) are shown in fig. 1c. Looking at the minute morphological change after a time interval of > 2 hours between fig. 1b and 1c, it is safe to assume that the kinetics (details of kinetics for LG growth/dissolution will be published in a separate paper) of growth/dissolution has decreased with passage of time. However, the recrystallization process has not ceased completely at this stage as it is found that the width and length of some of these structures continue to increase (black and white arrow in fig. 1c) and other structures continue to dissolve (red arrow in fig. 1b dissolved in fig. 1c). At this stage one of the parallelogram-like-structure whose growth was terminated (see lower left white arrow marked parallelogram in fig. 1b) due the presence of another one across it, started to grow again once the latter got dissolved completely. Even after more than 4 hours, no change in heights of the remaining structures is observed. At about 18 hours the growth/dissolution process has completely ceased indicating a saturation point has reached (fig. 1d, ~1067 min). No further morphological changes were observed even if the experiments were carried out up to 21 hours (data not shown).
3.2. LG Recrystallization on Glassy Carbon (GC)
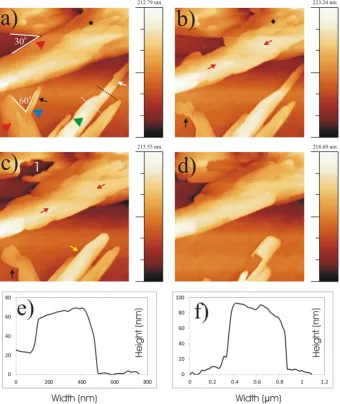
Recrystallization of LG on GC substrate resulted in the formation of stalactite-like-structures (see fig. 2a, time ~13 min). By scanning several different areas of GC in a number
of different experiments after freshly recrystallizing LG on to them, it was also found that these stalactite-like-structures are distributed in an inhomogeneous manner on the GC surface. Each such stalactite-like-structure seems to be formed by the agglomeration of many individual structures which are overlapped partially on top of others to form the complete stalactites. A closer look at one such individual structure (see black arrow in fig. 2a) revealed its similarity to the ones observed on HOPG with the exception that the edges do not look so sharp and distinct compared to those observed on HOPG. Variation of heights and widths of individual stalactites are random and it is practically impossible to make any meaningful statistics. However within the same stalactite, the widths and heights seem to decrease towards the pointed direction. For example, the heights and widths measured at dotted black and white lines in fig. 2a gives values of ~70 nm, ~90 nm for heights and ~ 430 nm, ~ 630 nm for widths respectively (see profiles in fig. 2e and 2f for black and white dotted line). Overlapping of stalactites is also observed and their overlapping seems to have certain directional in nature. As an example, the overlapping stalactites shown in fig. 2a made angles of 300 and 600.
Figure 2. Morphological changes observed by tapping mode AFM at different time intervals for LG crystals after recrystallizing 0.4 mg/mL LG solution (chloroform solvent) on to glassy carbon (GC) substrate. Figure 2a taken after ~13 min shows stalactite-like-structures of variable lengths, widths and heights. Morphological changes observed at ~ 70 min and ~ 257 min are shown in fig. 2b and 2c respectively. Figure 2d, taken at ~ 1276 min demonstrated the saturation morphology. Details are explained in text under heading “LG crystallization on GC” section. Figure 2e and 2f show the height profiles across the black and white dotted line in fig. 2a.
The growth/dissolution of some of the stalactites continued even after 4 hours (fig. 2c, 257 min). In addition, a stalactite which was partially dissolved previously (see fig. 2b, black arrow) started to grow (see fig. 2c, black arrow). It is interesting to note that the dynamics of dissolution/ growth of regions of stalactites in direct contact with or located very close to the GC substrates is quite prominent than the areas which are far away from GC substrate. See for example, the top surface of the largest stalactite (marked by red arrows in fig. 2b) has rarely undergone any visible morphological change even after scanning more than 4 hours (red arrows, fig. 2c). The recrystallization process became saturated at ~21 hours (fig. 2d, 1276 min) and no further change was observed on the surface even though scanning was performed for up to 24 hours. At this stage, few of those regions which was either dissolved or grown previously was found to have followed the opposite trend i.e., they have
overlapped one each other to form a complete film (marked number ‘1’ in fig. 2c completely overlapped in fig. 2d) or completely/partially dissolved again (black/yellow arrow marked areas in fig. 2c dissolved completely or partially in fig. 2d). The morphological changes on a GC substrate seems to be not so significant compared to the large morphological changes occurred on HOPG at the same time period. Also the saturation time period observed on GC was found to be considerably higher than on HOPG where surface saturation was reached at ~18 hours for 0.4 mg/mL LG solution.
3.3. LG Recrystallization on Glass
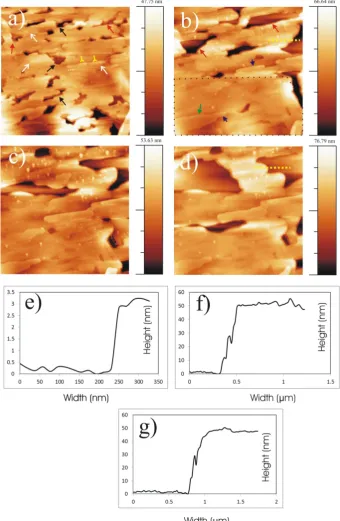
films with occasional pits developed in some areas (few pits are marked by black arrows in fig. 3a). A closer look also revealed the thin films are formed in a layer-by-layer fashion (see the white arrows in fig. 3a). The height measured across one such visible layer (white dotted line in fig. 3a) with respect to layer underneath gives a height of ~ 3.1 nm (see fig. 3e height profile). Layers visible on other areas of the image
[image:6.595.134.475.172.694.2]also gave similar heights and hence not discussed further. Another interesting observation is the gradual decrease in average size of the layers deposited at LG-glass interface from bottom (LG-glass interface) towards top (close to the reader). For instance the areas marked by bifurcated yellow arrows in fig. 3a shows the gradual decrease in the island sizes from bottom towards top.
Thin films observed during the initial stages in fig. 3a started to coalesce together to form larger islands after ~2 hours (fig. 3b, ~132 min). For example, the square area marked by black dots in fig. 3b shows the disappearance of pits previously observed at the exact location in fig. 3a to form an almost complete film with very few distinguishable pits. At the same time area lying outside the black dots in fig. 3b resulted in dissolution/merging of some of the islands. As a consequence, small pits observed for that area (red arrows, fig. 3a) developed in to larger pits (red arrows, fig. 3b). Further, it also found that the films have grown in a layer-by-layer fashion following Frank-Van der Merwe mechanism [17]. As an example, see grown layer marked by green arrow in fig. 3b where the top layer has grown over the already formed layer underneath. The layers which have grown over the other layers seem to have structures similar to those observed for HOPG (see navy blue marked arrows in fig. 3b). On the other hand, those formed at the LG-glass interface do not have such features. Few rounded globules appeared on the surface during the imaging (see the particles in fig. 3b) is believed to be dust particles from the environment which got deposited during long scanning hours.
Dissolution and growth process continued even after waiting up to ~11 hours (fig. 3c, ~ 668 min). As a consequence few of the pits developed in to larger pits whereas few others became tiny due to the coalescence of adjacent thin film. Looking at the relatively minute morphological changes that have occurred between fig. 3b and fig. 3c taken at a time gap of ~ 9 hours, it is safe to assume that the recrystallization process has slowed down considerably. This is in stark contrast to the relatively fast morphological change occurred within first two hours (see fig. 3a and fig. 3b). This observed trend in growth and dissolution behavior is similar to those observed on GC and HOPG substrate. Although imaging of that surface location was continued for up to ~22 hours, no visual change in surface morphology was observed after ~ 19 hours (fig. 3d, ~1145 min) indicating the growth/dissolution process has reached a saturation point. This saturation time period is confirmed by scanning another area of freshly recrystallized LG on glass. The heights of thin film in direct contact with the glass surface (assuming the lowest visible surface to be glass) were measured at the same location for fig. 3b, d (yellow dotted line) taken at a time gap of ~2 and 19 hours and found to remain constant (~50 nm) during recrystallization (see fig. 3f, 3g). Height at the same location in fig 3a could not be measured as the lowest surface was not visible. By comparing LG recrystallization on glass with that on HOPG and GC, it is found that the recrystallization saturation time lies between HOPG and GC. It is important to recall, the saturation time of 0.4 mg/mL LG crystallization
on HOPG and GC is ~18 hours and 21 hours respectively.
3.4. LG Recrystallization on Mica
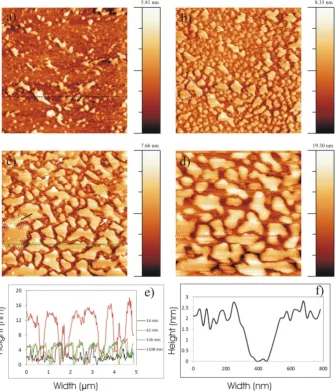
Figure 4. AFM images at different time intervals showing the morphological changes of LG mass after recrystallizing 0.4 mg/mL LG solution (chloroform solvent) on to mica substrate. Figure 4a taken after ~14 min shows homogeneously distributed islands of different shapes and sizes. Figure 4b, c taken after ~ 42 min and ~126 min demonstrates merging of several small island to grow in to bigger ones. At ~ 1108 min, island growth has completely ceased (fig. 4d) and no further change was observed. Figure 4e shows the height profiles along the dotted lines in all the images (dotted colored lines in figures corresponds to the same color profile in fig. 4e). Figure 4f represents height profile along the black line in fig. 4c.
4. Discussion
AFM imaging at different time intervals demonstrated for the first time the substrate effect on the growth and orientation of LG molecules. The morphological variations of LG molecule is presented in the table below.
Substrates Nonpolar Polar
Crystalline (Parallelogram-like-structuresHOPG )
Mica (Small islands of irregular shape and
size) Amorphous (Stalactite-like-structuresGC ) (Thin filmGlass )
Individual parallelogram-like-structures observed on HOPG is attributed to its nonpolar, crystalline nature. LG molecules have linear carbon-carbon (C-C) chains and their C-C chain length matches exactly to that of the C-C bond length of HOPG. This well matching C-C bond length
the hexagonal symmetry of HOPG substrate [20]. The average height of a single visible layer was found to be ~3.1 nm. Considering the length of a single LG molecule to be ~ 1.8 nm (chain length of dodecane is 1.8 nm [21]), such a layer should be formed by the close packing of two vertically standing LG molecule one over the other. But such an arrangement should give a height of 3.6 nm against 3.1 nm observed in this case. This may be attributed to the surface deformation by the applied force during the AFM measurement. Deformations observed on soft materials by AFM probe force is well documented [22]. With passage of time, some of these structures have grown while others dissolved simultaneously and as seen in figure 1, the topographical changes slowed down with time. It is believed that the growth and dissolution of these structures are solvent (chloroform) driven. In the initial stages of recrystallization, when LG solution was deposited on to the HOPG surface, more number of solvent molecules was present in the deposited crystal. These higher numbers of solvent molecules were responsible for the faster diffusion at the initial stage. As time passed by, although most of the solvent molecules evaporated, it may happen that some of these solvent molecules are trapped within the LG molecules and their evaporation took much longer. Hence diffusion has slowed down considerably due to the presence of lesser amount of solvent. The surface saturation has reached when all the solvents are evaporated and no further changes are observed ~18 hours. This solution driven recrystallization mechanism holds true for all other substrates discussed from here onwards and hence will not be discussed further. During the growth of these structures their vertical height remained constant. In other words growth was observed only along their length and width. This makes sense as adding LG mass below the area of the parallelogram-like-structure in direct contact with HOPG or above it requires a considerable amount of activation energy and hence is not energetically favorable. During growth their length increased at a faster rate compared to their width. This is due to the larger available area across their width compared to the smaller area at the growth end along the length. Assuming similar number of LG molecules gets arrived at the nucleation site at a particular time interval, these molecules must distribute themselves equally to the larger available area across width compared to the small area at the growth end along length. Hence their length increased at a faster rate compared to their width. What happened to the structures which disappeared with time? The flash point of LG molecules is ~ 134.30C and the experiments were performed at room temperature (20-240C) completely ruling out their evaporation from the HOPG surface. The only probable explanation would be their absorption on to the HOPG surface to form thin film. Although no self-assembly study of LG on HOPG is done, however a self-assembly study of its homologue 1, 12 dodecanediol demonstrated that the carbon chain lies parallel to the HOPG surface [23]. This is a strong indication that the parallelograms dissolved to form a thin film. If polar-polar
interaction between LG molecules is stronger then what drives the dissolution process of these structures? The argument would be to lower surface energy, the vertical standing LG molecules (less stable structure) undergo surface rearrangement to form a thin film where the carbon-carbon chain lies in parallel (more stable structure) orientation with respect to HOPG surface. The well matching carbon-carbon (C-C) bond distance between LG and HOPG provides a favorable environment for this rearrangement resulting in a hetero-epitaxial growth. The above explained mechanism is also responsible for the formation of similar structures for long chain alkanes e.g., dotriacontane (C32H66) and tritriacontane (C33H68) on HOPG demonstrated by Leunissen et al. [18]. If dissolution is favorable to give stability to the arrangement then why few parallelogram structures also grow simultaneously? One hypothesis would be the saturation of thin film in the nearby regions of grown parallelogram. As a result of this the molecules nearby its capture zone have nowhere to go but to get added to the existing parallelogram and hence the growth has occurred. The existence of parallelogram-like-structures and thin film together indicates the recrystallization process switched from Volmer-Weber mode to Stranski-Krastanov mode [17].
GC or on the already formed LG layer. Ultimately some LG molecules will get attached to GC substrate and other on top of already formed LG layer. This alternating deposition will continue until all the molecules from solution get deposited. However, once the first layer is formed, the number of molecules in droplet decreased further and hence less number of molecules remains in the droplet. This stepwise decrease in number of recrystallized molecule as well as their preferential absorption until complete recrystallization resulted in the formation of stalactites. The dissolution has also occurred at the interface between LG and GC. Similar factor as explained for HOPG most probably drives the dissolution in case of GC also. Transition to thin film in some areas along with the existence of stalactites most probably indicates a shifting of nucleation mechanism from pure Volmer-Weber type towards Stranski-Krastanov type [17].
Interestingly on polar amorphous substrate like glass the imaged area was found to be almost completely covered by the thin film. In the initial stage of recrystallization, the driving force for thin film formation is believed to be a combined effect of both LG-glass and LG-LG (inter molecular hydrogen bonding between –OH groups within LG molecules) polar interaction. Since glass substrate and LG molecules both are polar in nature, so the incoming molecules had the luxury of either depositing on glass or interact with the other LG molecules. It is probably this combined effect where one polar group (-OH group) of LG binds to the substrate and other one binds to the –OH group of adjacently placed LG to form the complete film. In other words, the recrystallization followed the well-known Frank-van der Merwe mechanism [17]. Once the film is formed, rearrangement of film started to occur to minimize the interfacial energy. The consequence is dissolution and rearrangement of few areas on these films at the latter stages of crystallization. The morphological changes appeared here is completely different to those observed on HOPG or GC indicating that substrate polarity plays an important role in determining the recrystallization behavior.
Finally on mica which is polar and crystalline, patches of small islands of irregular shape and size are observed which I attribute to the stronger LG-mica interaction than LG-LG (inter molecular hydrogen bonding between –OH groups within LG molecules) interaction. This LG-mica interaction resulted in LG molecules from solution phase to get attached to mica preferably forming a large number of small irregular shaped islands. The reason for the formation of such small patches at the initial stage is attributed to stronger LG-Mica polar-polar interaction. Mica being crystalline and negatively charged, its interaction with incoming LG molecules is much stronger compared to the intermolecular polar interaction between LG molecules. Hence, the incoming LG molecules from solution phase got attached to the mica surface preferentially forming large number of islands. These islands formed on the mica substrate in the initial stages of crystallization are completely different from those grown on glass. Just to recall thin films observed on a
glass substrate still have some regular shapes e.g. formed by close packing of individual parallelogram like structures. Growth of these small islands and their coarsening followed Frank-van der Merwe growth mechanism [17] to develop in to larger islands at the latter stages. An average height of ~1-5 nm of these islands in the initial stage of recrystallization (up to 2 hours) was observed indicating a random orientation of LG molecules on mica. Further no change in heights of these structures in the first couple of hours (see height profiles for in fig. 4e) combined with the island growth strongly supports that the molecular diffusion was strictly two dimensional e.g. along X and Y axes. Layer heights increase up to ~3-4 times in the final stage is indicative of layer by layer growth of LG thin film following a Frank-van der Merwe type of nucleation behavior. The complete merging of individual islands probably didn’t occur due to the unavailability of enough LG molecules as a low concentration of 0.4mg/mL LG solution was used.
The recrystallization saturation time period differed on different substrates used. The time period followed the following trend
Glassy carbon > glass > mica> HOPG
This difference can be explained based on their roughness and polarity. Commercial GC substrates have higher roughness (~100 nm [23]) compared to all other substrates used. This higher roughness will provide hindrance to the molecular diffusion thus requiring higher energy for the movement of LG molecules. On the other hand, glass being much smoother, the diffusion barrier is lower than that of GC. For mica and HOPG though both are atomically flat and thus diffusion barrier is low, however mica being polar, the stronger LG-Mica interaction will prevent LG molecular diffusion to a greater extent than HOPG which is nonpolar in nature and provides a weaker interaction with LG molecules.
5. Conclusions
to a Stranski-Krastanov nucleation mechanism. The molecular diffusion leading to growth and dissolution was also found to be controlled by both roughness and polarity of the investigated surfaces. It is believed the detailed understanding of their growth/dissolution mechanism as well as how substrate properties affect them is very interesting for scientists working in cosmetic industries and will behave as a catalyst to study many other constituents used in cosmetics. Better understanding of these processes at the nano-level will ultimately work as a stepping stone to prepare high quality cosmetic products in the near future.
REFERENCES
[1] R. Pillai, G. Schmaus, A. Pfeiffer, S. Lange, A. Trunet, 1,2-Alkanediols for Cosmetic Preservation, Cosmetics and Toiletries, Vol. 123, Issue 10, 53-64, 2008.
[2] H. J. Sagitani, Formation of O/W emulsions by surfactant phase emulsification and the solution behavior of nonionic surfactant system in the emulsification process, Dispersion Sci. Technol., Vol. 9, Issue 2, 115-129, 1988.
[3] S. J. Paynter, L. O’Neil, B. J. Fuller, R. W. Shaw, Membrane permeability of human oocytes in the presence of the cryoprotectantpropane-1,2-diol, Fertility Sterility, Vol. 75, No. 3, 532-538, 2001.
[4] A. E. Sagiv, S. Disktein, A. Ingeber, The efficiency of humectants as skin moisturizers in the presence of oil, Skin Res. Technol., Vol. 7, 32-35, 2001.
[5] S. B. Levy, A. M. Dulichan, M. Helman, Safety of a preservative system containing 1,2-hexanediol and caprylyl glycol, Cutaneous and Ocular Toxicology, Vol. 28(1), 23-24, 2009.
[6] W. Johnson Jr, W.F. Bergfeld, D.V. Belsito, R.A. Hill, C.D. Klaassen, D. Liebler, J.G. Marks Jr., R.C. Shank, T.J. Slaga, P.W. Snuder, F.A. Andersen, Safety Assessment of 1,2-Glycols as Used in Cosmetics, International journal of toxicology, Vol. 31 (supplement 2), 147s-168S, 2012. [7] Júnior CO, le Hyaric M, Costa CF, Corrêa TA, Taveira AF,
Araújo DP, Reis EF, Lourenço MC, Vicente FR, Almeida MV., Preparation and antitubercular activity of lipophilic diamines and amino alcohols, Mem Inst Oswaldo Cruz., Vol. 104 (5), 703-5, Aug 2009.
[8] Naidek KP, Bianconi F, da Rocha TC, Zanchet D, Bonacin JA, Novak MA, Vaz Md, Winnischofer H., Structure and morphology of spinel MFe2O4 (M=Fe, Co, Ni) nanoparticles chemically synthesized from heterometallic complexes, J Colloid Interface Sci., Vol. 358, Issue 1, 39-46, 2011.
[9] F. A. Freitas, D. Licursi, E. R. Lachter, A. M. R. Galletti, C. Antonetti, T. C. Brito, R. S. V. Nascimento, Heterogeneous catalysis for the ketalisation of ethyl levulinate with 1,2-dodecanediol: Opening the way to a new class of bio-degradable surfactants, Catalysis Communications, Vol. 73, 84–87, 2016.
[10]Greg Haugstad, Atomic Force Microscopy: Understanding Basic Modes and Advanced Applications, Wiley (September 2012).
[11]Ardeshir Danesh, Simon D. Connell, Martyn C. Davies, Clive J. Roberts, Saul J. B. Tendler, Phillip M. Williams, M. J. Wilkins, An In Situ Dissolution Study of Aspirin Crystal Planes (100) and (001) by Atomic Force Microscopy, Pharmaceutical Research, Vol. 18, No. 3, 299-303, 2001. [12]Tonglei Li, Kenneth R. Morris, Kinam Park, Influence of
Solvent and Crystalline Supramolecular Structure on the Formation of Etching Patterns on Acetaminophen Single Crystals: A Study with Atomic Force Microscopy and Computer Simulation, J. Phys. Chem. B, Vol. 104, No. 9, 2019–2032, 2000.
[13]Drug Dissolution Studies with Atomic Force Microscopy, Bruker Application note, 2010.
[14]L. Itzel Meza, Michael W. Anderson, Ben Slater, Jonathan R. Aggera, In situ atomic force microscopy of zeolite A dissolution, Phys. Chem. Chem. Phys., Vol. 10, 5066-5076, 2008.
[15]Justyna Pers, Bogdan Barwinski, Milosz Grodzicki, Antoni Ciszewski, AFM studies of pits formation on KBr(100) during its dissolution by water, Materials Science-Poland, Vol. 34(4), 863-867, 2016.
[16]I. Horcas, R. Fernandez, J.M. Gomez-Rodriguez, J. Colchero, J. Gomez-Herrero and A. M. Baro, WSXM: A software for scanning probe microscopy and a tool for nanotechnology, Rev. Sci. Instrum. Vol. 78, 013705, 2007.
[17]Ivan V. Markov, Crystal growth for beginners: Fundamentals of nucleation, crystal growth and epitaxy (2nd edition), World Scientific Publishing Company, February 2004.
[18]Mirjam E. Leunissen, W. Sander Graswinckel, Willem J. P. van Enckevort, and Elias Vlieg, Epitaxial Nucleation and Growth of n-Alkane Crystals on Graphite (0001), Crystal Growth & Design, Vol. 4, No. 2, 361-367, 2004.
[19]Arrigoni Claire, Schull Guillaume, Bléger David, Douillard Ludovic, Fiorini-Debuisschert Céline, Mathevet Fabrice, Kreher David, Attias André-Jean and Charra Fabrice, Structure and Epitaxial Registry on Graphite of a Series of Nanoporous Self-Assembled Molecular Monolayers, J. Phys. Chem. Lett., Vol. 1 (1), 190–194, 2010.
[20]Chong-yang Liu, Hsiangpin Chang, and Allen J. Bard, Large scale hexagonal domain like structures superimposed on the atomic corrugation of a graphite surface observed by scanning tunneling microscopy, Langmuir ,Vol. 7, 1138-1142, 1991. [21]J. R. Lu, R. K. Thomas, B. P. Binks, P. D.I Fletcher, J, Penfold,
Structure and Composition of Dodecane Layers Spread on Aqueous Solutions of Dodecyl- and Hexadecyltrimethylamm onium Bromides Studied by Neutron Reflection, J. Phys. Chem., Vol. 99, No. 12, 4113-4213, 1995.
[22]Albrecht L Weisenhorn, Mitra Khorsandi, Sandor Kasas, Vassilis Gotzos, Hans-Jurgen Butt, Deformation and height anomaly of soft surfaces studied with an AFM, Nanotechnology, Vol. 4, 106-113, 1993.
[23]C. L. Claypool, F. Faglioni, W. A. Goddard III, H. B. Gray, N. S. Lewis, R. A. Marcus, Source of Image Contrast in STM Images of Functionalized Alkanes on Graphite: A Systematic Functional Group Approach, J., Phys. Chem. B, Vol. 101, 5978-5995, 1997.