Journal of Chemical and Pharmaceutical Research, 2012, 4(9):4420-4425
Research Article
CODEN(USA) : JCPRC5
ISSN : 0975-7384
Stability Indicating Reverse phase Liquid chromatographic Method for the
Determination of Metoprolol succinate in Pharmaceutical Dosage Forms.
Sainath Kalisetty*
a, b, T. Sreenivasulu Reddy
b, A. Malleswara Reddy
a, Joy Babu Palnati
a,
Dama Venugopala Rao
aand R. Manikandan
ca
Analytical Research and Development, IPDO, Dr. Reddy’s Laboratories Ltd., Hyderabad, India.
bDepartment of
Chemistry
, Sri Krishna Devaraya University, Anantapur, India.
cFormulation Research and Development, IPDO, Dr. Reddy’s Laboratories Ltd., Hyderabad, India.
_____________________________________________________________________________________________
ABSTRACT
This paper describes the development and validation of simple, Robust, Rugged and stability indicating liquid chromatographic analytical method for the Assay of Metoprolol succinate in Pharmaceutical Dosage forms. The method employs a Waters X-Terra RP 18(150mm X 4.6 mm, 5 µm particle size) column with UV detection at 240 nm. Method was designed to extract the drug substance Metoprolol succinate in any type of matrix formulations available in the market. This method can be used for Quality control assay of Metoprolol in finished dosage forms and for stability studies as the method separates all impurities and degradation products from Metoprolol.
Keywords : Metoprolol succinate, Method development , Method validation and Forced degradation.
_____________________________________________________________________________________________
INTRODUCTION
Metoprolol Succinate is a beta-selective (cardioselective) adrenoceptor blocking agent, for oral administration, available as extended release tablets. The tablets comprise a multiple unit system containing metoprolol succinate in a multitude of controlled release pellets. Each pellet acts as a separate drug delivery unit and is designed to deliver metoprolol continuously over the dosage interval. Chemically Metoprolol succinate is a (±)1-(isopropylamino)-3-[p-(2-methoxyethyl) phenoxy]-2-propanol succinate.
Metoprolol succinate Extended release tablets [1] are official in United states pharmacopoeia and the Assay of the tablets is given as average value of ten units Uniformity of dosage units testing. It is tedious and time consuming to prepare ten samples for each batch, and this is not a stability indicating method. Very few methods [2-6] have been reported in the literature, but there were no stability indicating Assay methods capable to extract drug substance from the various types of formulations.
[image:1.595.146.457.671.729.2]The focus of the work described herein was to develop and validate [7-9] simple and sensitive HPLC method [10-11] for tablet formulation for which, time and efficiency are optimized for use in routine testing.
EXPERIMENTAL SECTION
2.1. Materials and Reagents
Samples of Metoprolol Extended release tablets, Working standard and impurities were received from Dr Reddy’s Laboratories, Hyderabad, India. Orthophosphoric acid, Sodium lauryl sulphate, Sodium dihydrogen phosphate monohydrate and Acetonitrile was purchased from Merck. High purity water was collected by using Milli pore Milli Q plus purification system.
2.2 Equipment
The M/s Waters HPLC System with a photo diode array detector was used for the method development and Force degradation studies .The out put signal was monitored and processed using Waters Empower net working software.
2.3 Chromatographic Conditions
The Chromatographic Column used was a Waters 150mm X 4.6 mm X-Terra RP18 column with 5µ particle size. The mobile phase was Acetonitrile and 0.05M sodium dihydrogen phosphate monohydrate, pH adjusted to 3.0 with orthophospharic acid in the ratio 25:75 v/v .The flow rate of the mobile phase was 0.8 mL min-1. The column temperature was maintained at 25ºC and the detection wavelength of 280 nm. The injection volume was 10µL.
2.4 Preparation of Diluent
Sodium lauryl sulphate solution (0.13% SLS in 0.1% aqueous phosphoric acid solution) and Acetonotrile in the ratio of 40:60 was used for the extraction of Metoprolol from the placebo matrix and Mobile phase was used for final dilutions.
2.5 Preparation of Standard Solution
The stock solution of Metoprolol working standard (0.95 mg mL-1) was prepared in diluent. The standard solution (0.19 mg mL-1) was obtained by dilution of the stock solution in Mobile phase.
2.6 Preparation of Sample solution
[image:2.595.127.486.481.541.2]Metoprolol succinate extended release tablets were taken in to the 500 ml volumetric flask, added about 200 ml of Sodium lauryl sulpahte solution and tablets were disintegrated with help of rotary shaking. Disintegrated tablets sonicated with the addition of 200 ml of Acetonitrile for about half an hour and diluted up to the mark with acetonitrile. The resulting solution was centrifuged at 3500 rpm for 10 minutes, and supernatant solution was diluted with mobile phase to get 0.19 mg mL-1-
Table 1: Test preparation.
S.no Metoprolol Succinate ER tablets Dosage strengths
No of tablets in 500 ml volumetric flask
Volume of Stock
solution taken Dilution volume
1 200 5 5 50
2 100 5 5 25
3 50 10 5 25
4 25 20 5 25
2.7 Specificity
Specificity is the ability of the method to measure the analyte response in the presence of its potential impurities. Chromatographic runs of placebo solution and force degradation studies were performed in order to provide an indication of the stability indicating properties and specificity of the method. The stress conditions employed were; Acid, Base, Neutral, oxidation media, heat, moisture and light. After the degradation treatment, the samples were allowed to equilibrate to room temperature, neutralized with acid or base (if necessary), and diluted with diluent to 0.19 mg mL-1. The samples were analyzed against a freshly prepared control sample (with no degradation treatment) and evaluated for peak purity by using photo diode array detector.
2.8 Method Validation 2.8.1 Precision
Assay of method precision (Intra day precision) was evaluated by carrying out six independent assays of test
samples of Metoprolol against qualified standard. The percentage of R.S.D of six assay values obtained was calculated.
2.8.2 Linearity
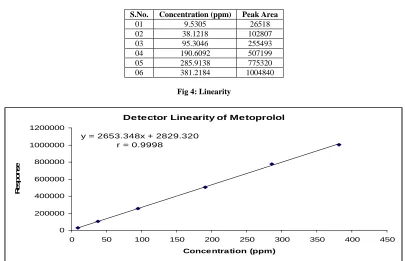
Linearity test solutions for assay method prepared from stock solution at 6 concentrations levels in the range of about 9.5 to 381 µg mL-1.Thepeak area versus concentration data correlation co-efficient was performed.
2.8.3 Accuracy
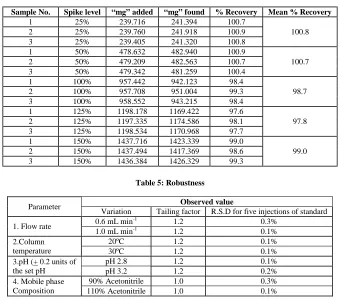
A study of recovery of Metoprolol from drug product was conducted. Sample solutions were prepared in triplicate at 25%, 50%, 100%, 125% & 150% concentration levels. The % recovery was calculated.
2.8.4. Robustness
To determine the Robustness of the developed method, experimental conditions were purposely altered and checked the method robustness.
RESULTS AND DISCUSSION
3.1. Method development and optimization
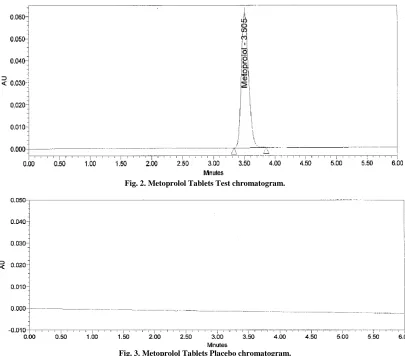
[image:3.595.101.506.335.691.2]Screening and optimization of diluent for the sample preparation was based on the extraction efficiency of the diluent and stability of the drug substance in the solution state. Complete extraction of the metoprolol from the Drug products is achieved by optimizing the various proportions of the Sodium lauryl sulpahte and Acetonotrile with different Rotary shaking and Sonication times. The HPLC procedure was optimized with a view to develop a stability indicating assay method. Forced degradation samples and Pure drug substance along with its related impurities were injected and run in different solvent systems to achieve non interference of impurities and Degradation products.
Fig. 2. Metoprolol Tablets Test chromatogram.
Fig. 3. Metoprolol Tablets Placebo chromatogram.
3.2 Method validation 3.2.1 Precision
different analyst, different HPLC system and different HPLC column in different days as described in the sample preparation. The mean % assay and percentage R.S.D for assay values were found to be 101.4 and 0.7 % respectively. The result shows that good precision of the method (Table 2).
Table 2: Precision
Sample No. % Assay of Metoprolol succinate ER Tablets USP 200 mg Precision Intermediate precision
1 100.4 102.6
2 100.2 101.2
3 102.1 101.2
4 99.9 101.5
5 100.3 100.5
6 100.2 101.1
Average 100.5 101.4
% RSD 0.8 0.7
3.2.2 Linearity
[image:4.595.102.507.312.573.2]Linear calibration plat for assay method was obtained over the calibration ranges tested, i.e. 9.5-381 µg mL-1 and the correlation co-efficient was found to be greater than 0.999. The result shows that an good correlation existed between the peek area and concentration of the analyte.
Table 3: Linearity.
S.No. Concentration (ppm) Peak Area 01 9.5305 26518 02 38.1218 102807 03 95.3046 255493 04 190.6092 507199 05 285.9138 775320 06 381.2184 1004840
Fig 4: Linearity
Detector Linearity of Metoprolol
y = 2653.348x + 2829.320 r = 0.9998
0 200000 400000 600000 800000 1000000 1200000
0 50 100 150 200 250 300 350 400 450
Concentration (ppm)
R
e
s
p
o
n
s
e
3.2.3 Accuracy
The percentage recovery of Metoprolol in pharmaceutical dosage forms is between 97.0 to 103.0
3.2.4 Robustness
Table 4: Accuracy
Sample No. Spike level “mg” added “mg” found % Recovery Mean % Recovery 1 25% 239.716 241.394 100.7
100.8 2 25% 239.760 241.918 100.9
3 25% 239.405 241.320 100.8 1 50% 478.632 482.940 100.9
100.7 2 50% 479.209 482.563 100.7
3 50% 479.342 481.259 100.4 1 100% 957.442 942.123 98.4
98.7 2 100% 957.708 951.004 99.3
3 100% 958.552 943.215 98.4 1 125% 1198.178 1169.422 97.6
97.8 2 125% 1197.335 1174.586 98.1
3 125% 1198.534 1170.968 97.7 1 150% 1437.716 1423.339 99.0
99.0 2 150% 1437.494 1417.369 98.6
[image:5.595.136.479.85.385.2]3 150% 1436.384 1426.329 99.3
Table 5: Robustness
Parameter Observed value
Variation Tailing factor R.S.D for five injections of standard
1. Flow rate 0.6 mL min
-1 1.2 0.3%
1.0 mL min-1 1.2 0.1%
2.Column temperature
20ºC 1.2 0.1%
30ºC 1.2 0.1%
3.pH (+ 0.2 units of the set pH
pH 2.8 1.2 0.1%
pH 3.2 1.2 0.2%
4. Mobile phase Composition
90% Acetonitrile 1.0 0.3% 110% Acetonitrile 1.0 0.1%
3.2.5 Results of force degradation studies
All the stressed samples prepared, were injected into the HPLC system with photodiode array detector as per the described chromatographic conditions.
[image:5.595.81.542.545.686.2]All degradant peaks were resolved from Metoprolol peak in the chromatograms of all stressed samples. The chromatograms of the stressed samples were evaluated for peak purity of Metoprolol using Waters Empower Networking software. For all forced degradation samples, the purity angle (The weighted average of all spectral contrast angles calculated by comparing all spectra in the integrated peak against the peak apex spectrum) found to be less than threshold angle and there was no purity flag (The purity flag is an indication of spectral homogeneity, compares the purity angle with the purity threshold) for the Metoprolol, Thus, this method is considered to be "Stability Indicating”. This indicates that there is no interference from degradants in quantification.
Table 6: Specificity-Forced degradation data
Stress Condition Drug Product % degradation Peak Purity Purity Angle Purity Threshold Purity Flag Stressed with 2N HCl solution for about 15 Hours at 60°C. 1.00 0.070 0.270 No Stressed with 2N NaOH solution for about 15 Hours at 60°C. 3.04 0.062 0.261 No Stressed with 1% Hydrogen peroxide (H2O2) for about 45 minutes at 60°C. 0.50 0.064 0.259 No
Stressed with water for about 15 hours at 60ºC. 0.38 0.068 0.266 No Exposed to visible light to attain 1.2 million Lux hours. Nil 0.074 0.267 No Exposed to UV light to attain 200 watt hours/square meter. Nil 0.074 0.263 No Dry heating done at 105°C for about 15 hrs. 3.61 0.259 0.506 No Exposed to humidity at 25°C, 90% RH for about 7 days. Nil 0.071 0.256 No
CONCLUSION
Acknowledgements
The authors wish to thank the management of Dr.Reddy’s Group for supporting this work. The authors wish to acknowledge the Formulation R&D Group for providing the samples for our research work.
REFERENCES
[1] Nilesh S.Patil; Deepali Kaduskar.Journal of Pharmacy Research., 2010, 3(10), 2555-2556.
[2] Kulkarni MN; Kshirsagar RV; Sakarkar DM. Int. J. Chemtech Res., 2009, 1(4): 1273-1277.
[3] Chawla S; Ghosh S; Sihorkar V; Nellore R; Kumar TR; Srinivas NR.Biomed. Chromatogr., 2006, 20(4), 349-357.
[4] S.Ashutoshkumar; G.Vijayakumar; M.Karthikeyan; S.Manidipa; V.Ravisankar; A.Arunachalam.International Journal of Pharmaceutical & Biological Archives., 2010; 1(5), 416– 420.
[5] Jadhav A. S; Tarkase K. N; Deshpande A.P; Der Pharmacia Lettre., 2012, 4(3), 763-767. [6] M.Cesme; D.Tarnic; A.Golcu. American Journal of chemistry., 2011, 1(1), 9-15. [7] ICH: Q2A, Text on validation of analytical procedure (October 1994).
[8] ICH: Q2B, Analytical Validation – Methodology (November 1996).
[9] ICH Q2 (R1), Validation of Analytical Procedures Text and Methodology (November 2005).
[10] A.Braithwaite, F.J.Smith. Chromatographic Methods, Fifth edition, Kulwer Academic publishers, Dordrecht-Netherlands, 1999, 258-354.