408
FEATURE SELECTION PRACTICE FOR UNSUPERVISED
LEARNING OF CREDIT CARD FRAUD DETECTION
1HOJIN LEE, 1DAHEE CHOI, 1HABIN YIM, 2EUNYOUNG CHOI,
2WOONG GO, 2TAEJIN LEE, 1INSUK KIM, 1KYUNGHO LEE
1Graduate School of Information Security, Korea University, Seoul, South Korea
2Korea Internet & Security Agent, Seoul, South Korea
E-mail: 1[email protected], 1[email protected], 1[email protected], 2[email protected],
2[email protected], 2[email protected], 1[email protected], 1[email protected]
ABSTRACT
Unsupervised Learning processes the massive data and discover the underlying patterns, even though explicit target values are nonexistent. Achieving high predictability for Unsupervised Learning, we practiced to select most influenced feature related to fraud detect system among numerous data. Financial transactions are provided through various channels. On this account, selection of new feature brings increment either on time and cost. In this paper, we practiced the various Feature Selection to detect abnormal transactions exploiting Unsupervised Learning. Here, we select proper features by valuing weight on various Feature Selection Algorithms. The efficiency and accuracy of Feature Selection we practiced are demonstrated by credit card data set. Therefore, it provides rapid response in compliance with feature variance and guide to efficient feature selection.
Keywords: Feature Selection, Unsupervised Learning, Credit Card Fraud Detection, Filtered Algorithm, Ranked Algorithm
1. INTRODUCTION
Recently, financial trades are provided by various channels through online and offline in real time, which makes trickier to detect fraud [1]. As a method to solve these problems, Financial institutions are enforcing FDS (Fraud Detection System).
FDS is a system used for fraud detection and prevention by analyzing overall information gathered through device data and access data in use for electronic financial transaction. To improve efficiency and detecting accuracy of fraud, intelligent FDS, which applied machine learning technique is being researched and developed recently [2]. Combining machine learning technique to financial institution derives accurate detection rate due to the fact that financial industry holds a massive amount of data than any other industry areas.
Unsupervised learning method in machine learning is capable of processing massive data and detecting the underlying patterns drawn from unlabeled data. For underlying threats which are related to fraud are enhancing rapidly and intelligence FDS might be an effective method to detect the unknown attack [3,4]. Feature Selection is being performed to extract features with strong influence in fraud detection for higher accuracy. Associating with internal structure, Unsupervised feature selection derives relatively specific and accurate discrimination. Selecting effective and highly relevant features leads to reduce the costs to detect fraud and maintenance expenditure in the financial industry [5].
409
2. RELATED WORK
2.1 Unsupervised Learning
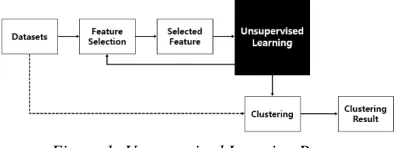
[image:2.612.93.292.206.280.2]Unsupervised Learning [6] is the machine learning method which aims to classify unlabeled data and combine in groups by similar feature. A cluster is the representative model of Unsupervised Learning. Fig 1 represents a process for clustering.
Figure 1: Unsupervised Learning Process
Clustering is the grouping process by gathering data based on high similarities. After performing feature selection with unlabeled data, clustering results could be drawn by applying unsupervised learning algorithms on selected features. Clustering algorithms in Unsupervised learning are as follows [7].
EM algorithm [8] is a iterative method for finding parameter of maximum likelihood or maximum a posteriori in statistical models, where the model depends on unobserved latent variables. It generates an initial model and then iteratively refines the model to generate an optimized model. In addition, the EM algorithm generates an optimal model by adjusting the probability that each object belongs to a Mixture Model through an iterative refinement process. It called Probability-based clustering.
K-means [9] has K centroids that are defined for each cluster while costs are calculated by distances of centroids. As re-calculating K centroids that result from the previous step, K centroids change their location step by step until no more changes are done. The goal is to find the cluster, which minimizes the defined cost.
FarthestFirst algorithm [10] is a variant of K means that places each cluster center in turn at the point furthest from the existing cluster centers. It proceeds through two scans of the dataset. The first scan constructs a number of hash table data structures equal to the number of characteristics based on the information about the characteristic value and frequency. In the second scan, the
property values in the corresponding hash table are determined by the expected time and frequency.
Filtered Clusterer has class for running an arbitrary cluster of data that has been passed through an arbitrary filter. Like the cluster, the structure of the filter is based exclusively on the training data and test instances will be processed by the filter without changing their structure.
X means [11] is the extended K-Means by an Improve-Structure part. The centers are attempted to be split in its region. At this time, a Bayesian Information Criterion (BIC) score is used as a criterion for partitioning. Increase the BIC score as much as possible and stop the split when there is no further increase in the score. After a group is divided, the data assigned to each group is determined by the Kmeans algorithm.
Density Estimation [12] estimates the probability distribution of an unobservable underlying probability density function based on observed data. Clusters of clusters with a minimum number of instances within a given radius are available, even if the data has noise and anomalies. It also uses clusters to return distributions and densities. Concretely, data existing on the same density and data existing in the same area are connected to form a cluster.
2.2 Feature Selection
Feature Selection [13,19] is the process of selecting relevant attribute which affects the most in detection or prediction among numerous data.
Elimination of overlapping or irrelevant data through feature selection leads to a deduction of accurate prediction without a data loss. Methods of feature selection are as follows.
410
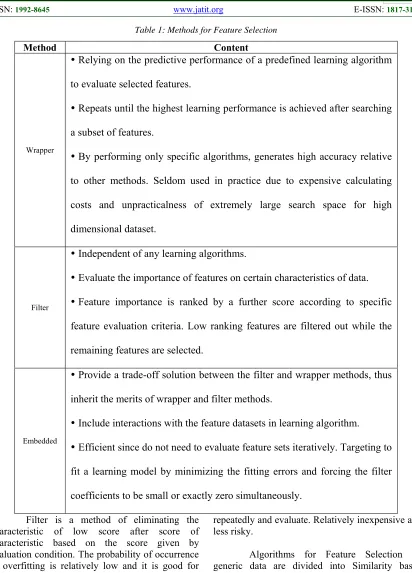
Table 1: Methods for Feature Selection
Method Content
Wrapper
Relying on the predictive performance of a predefined learning algorithm
to evaluate selected features.
Repeats until the highest learning performance is achieved after searching
a subset of features.
By performing only specific algorithms, generates high accuracy relative
to other methods. Seldom used in practice due to expensive calculating
costs and unpracticalness of extremely large search space for high
dimensional dataset.
Filter
Independent of any learning algorithms.
Evaluate the importance of features on certain characteristics of data.
Feature importance is ranked by a further score according to specific
feature evaluation criteria. Low ranking features are filtered out while the
remaining features are selected.
Embedded
Provide a trade-off solution between the filter and wrapper methods, thus
inherit the merits of wrapper and filter methods.
Include interactions with the feature datasets in learning algorithm.
Efficient since do not need to evaluate feature sets iteratively. Targeting to
fit a learning model by minimizing the fitting errors and forcing the filter
coefficients to be small or exactly zero simultaneously.
Filter is a method of eliminating the characteristic of low score after score of characteristic based on the score given by evaluation condition. The probability of occurrence of overfitting is relatively low and it is good for large-scale data. Evaluate the importance of characteristics based on reliable data features that are independent of learning algorithms.
Embedded is a feature search method that combines a wrapper and a filter. It is efficient because it involves the interaction of characteristic groups in learning algorithms and it does not iterate
repeatedly and evaluate. Relatively inexpensive and less risky.
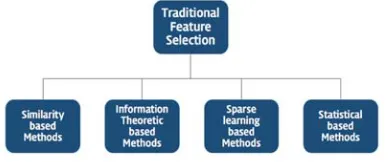
Algorithms for Feature Selection on generic data are divided into Similarity based methods, Information Theoretical based methods, Sparse Learning based methods, Statistical based methods.
411 from various distance metric measures in unsupervised feature selection.
Information theoretical based methods [15] are devised to maximize the correlation and minimize the unnecessity which are the basic characteristics of information theoretical based methods. To assess the importance of feature value, various kinds of filter criteria are being used. Since majority of algorithms in this method is only applied to discrete data, numeric data need discretization process.
Sparse learning based methods [16] select features which are independent to any other learning algorithms. However, this method does not consider that selected features might not be the best fit in specific learning condition. By regularizing sparsity, fitting errors would be minimized. By forcing some feature coefficients to be small or exactly zero with sparse regularizer, the corresponding features would be eliminated.
Statistical based methods analyze features separately by different statistical criteria. Irrelevant redundancies are ignored during the feature selection process and essential algorithms are used along with separate data and data sets.
Figure 2: Classification of Feature Selection Algorithms
Referable to the fact that the unsupervised feature selection is performed with unlabeled data, the importance of feature selection is being stressed for more precise detection and anticipation. Unsupervised feature selection algorithms used in unsupervised learning are as follows.
3. RESEARCH METHODOLOGY
3.1 Datasets Analysis
Gathering Credit Card data is a kind of tricky task and there is a limitation to distinct fraud from normal trade. Therefore, this study performs a study research on German and Austria credit card
[image:4.612.93.288.428.509.2]dataset in UCI repository. These data sets are widely used in research for credit card fraud detection. Characteristics of the credit card datasets are as below [17].
Table 2: Characteristics of the credit card datasets
Dataset Features Size Ratio
German 21 1,000 70:30
Austria 14 690 70:30
In German credit card dataset, it has 20 features consists of 13 categorical data and 7 continuous data. In Austria credit card dataset, it has 14 features consists of 8 categorical data and 6 continuous data.
3.2 Sampling and Evaluation metric
In this research, we performed different ratio of samplings using existing data sets to increase reliability and accuracy. We generate various datasets using SMOTE [18] (Synthetic Minority Oversampling Technique) over 50%, 60%, 70%, 80%, 90%, 95%, 99% ratios.
SMOTE is an oversampling technique that uses a method of generating arbitrary examples,
rather than simply oversampling through
duplication or replacement. Depending on the size of the fractional data clusters for which oversampling is required, the size of selecting adjacent data also varies, and the closest neighbors are randomly selected at random. For example, if the ratio of oversampling is 200%, then two of the five closest neighbors are selected and additional fractional data is generated in each of the other directions. This way, the decision area of the small number of data clusters becomes more efficient and general.
412
Figure 3: Confusion Matrix
False positive represents normal
transaction which was predicted as fraud. False Negative represents fraud which was predicted as a normal transaction.
Recall is the ratio of predicted true values among actual true values. Also referred to as the true positive or sensitivity. In fraud detection, it represents the ratio of detecting fraud among actual frauds.
Recall R (1)
Precision is the ratio of actual true among predicted as true value which is also referred to as positive value. It represents actual fraud rate among values predicting as fraud.
Precision P (2)
F-Measure represents accuracy at once by integrating the combined trade-off of precision and recall.
F measure (3)
Learning method is considered as well performed while the F–measure is getting near to 1.
3.3 Feature Selection and Unsupervised
Learning
In this paper, we choose Filter method among Wrapper, Filter, Embedded methods. Since Wrapper and Embedded method are subordinate in specific occasions, it would be improper to apply
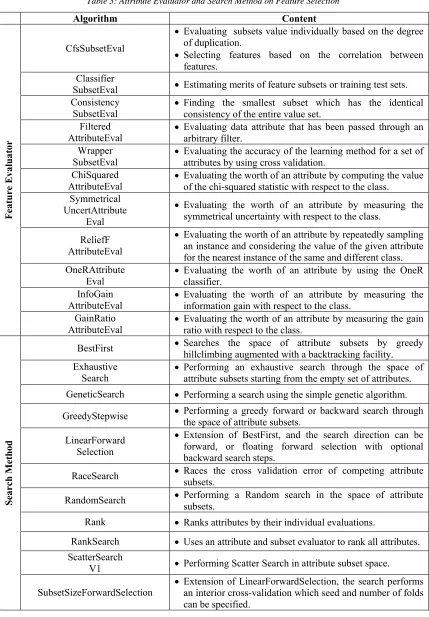
any algorithm [20]. Table 2 describe Feature Evaluator and Search Method for selecting features.
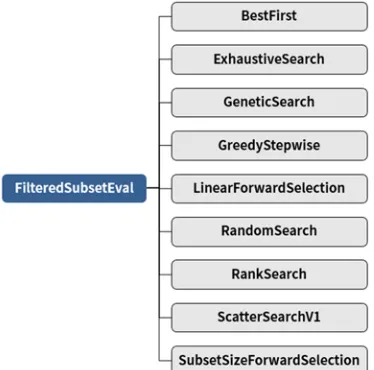
Our research aims to extract significant feature by adapting various search method to Filter algorithms [21, 23].
Figure 4: Unranked Feature Selection Algorithm
[image:5.612.317.497.439.587.2]By using characteristic of feature, we applied algorithms for Feature Selection. With Ranked based algorithm, we are aim to extract significant features by ranking.
413
Table 3: Attribute Evaluator and Search Method on Feature Selection
Algorithm Content
Feat
ure E
val
ua
to
r
CfsSubsetEval
Evaluating subsets value individually based on the degree
of duplication.
Selecting features based on the correlation between
features. Classifier
SubsetEval Estimating merits of feature subsets or training test sets.
Consistency
SubsetEval Finding the smallest subset which has the identical consistency of the entire value set. Filtered
AttributeEval Evaluating data attribute that has been passed through an arbitrary filter.
Wrapper SubsetEval
Evaluating the accuracy of the learning method for a set of
attributes by using cross validation. ChiSquared
AttributeEval Evaluating the worth of an attribute by computing the value of the chi-squared statistic with respect to the class. Symmetrical
UncertAttribute Eval
Evaluating the worth of an attribute by measuring the
symmetrical uncertainty with respect to the class.
ReliefF AttributeEval
Evaluating the worth of an attribute by repeatedly sampling
an instance and considering the value of the given attribute for the nearest instance of the same and different class. OneRAttribute
Eval Evaluating the worth of an attribute by using the OneR classifier.
InfoGain AttributeEval
Evaluating the worth of an attribute by measuring the
information gain with respect to the class. GainRatio
AttributeEval Evaluating the worth of an attribute by measuring the gain ratio with respect to the class.
Search
Me
th
od
BestFirst Searches the space of attribute subsets by greedy hillclimbing augmented with a backtracking facility. Exhaustive
Search
Performing an exhaustive search through the space of
attribute subsets starting from the empty set of attributes.
GeneticSearch Performing a search using the simple genetic algorithm.
GreedyStepwise Performing a greedy forward or backward search through
the space of attribute subsets. LinearForward
Selection
Extension of BestFirst, and the search direction can be
forward, or floating forward selection with optional backward search steps.
RaceSearch Races the cross validation error of competing attribute subsets.
RandomSearch Performing a Random search in the space of attribute subsets.
Rank Ranks attributes by their individual evaluations.
RankSearch Uses an attribute and subset evaluator to rank all attributes.
ScatterSearch
V1 Performing Scatter Search in attribute subset space.
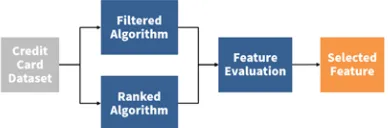
414 Applying filter and ranked algorithms, extracted 15 Feature Sets and assigned adequate weight for Feature Selection. Figure 6 indicates the Feature Selection process we presented.
Figure 6: Feature Selection Process for Card Fraud Detection
Feature Sets are made with Filtered and Ranked algorithms. Ranked algorithm make Feature Set by ranking the entire features. Filtered algorithm generates 1 to 2 Feature set in Austria and 1 to 8 in German. By evaluating the Feature set which is created by each algorithm, any feature could record the best result in one and a half-ranked algorithm while seven out of eight features are selected in Filtered algorithm.
For comparison of result in entire features, we performed 6 different clustering algorithms. Table 3 and 4 are the result of validation and F-measure in clustering algorithms.
Afterwards, re-perform was taken by using the selected features. Table 5 and 6 are the results of re-performance.
3.4 Comparing of results
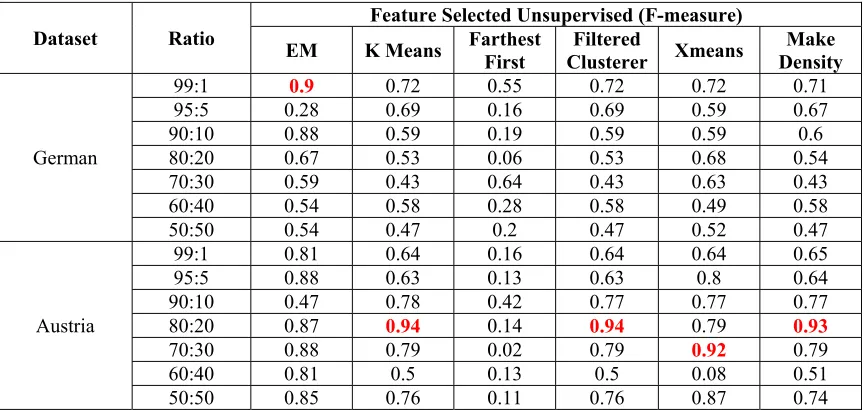
Validation of clustering before feature selection has achieved a relatively low rate in result, recording only a few values of rates over 90%. German dataset recorded highest rate of F-measure with the EM algorithm in the sampling ratio of 99%. Austria dataset recorded highest value with K-means, Filtered, Make Density algorithm on both Validation value and F-measure.
After implementing feature selection on both German and Austria data, the average value of clustering validation on both datasets has enhanced. The averages are calculated in various sampling ratios. Especially, the average validation value of clustering in Austria data has reached up to almost 90%. Although FarthestFirst algorithm applied in Austria data has reached over 90% in validation, the F-measure is not effective. On the contrary, EM algorithm which applied in Austria resulted better in F-measure than validation value. K-means, Filtered Clusterer, Make Density resulted over 90% in both validation and F-measure ratio.
[image:7.612.91.525.501.708.2]The overall results of validation and F-measure are enhanced, represents a well operation in Feature Selection method.
Table 4: Validation of clustering before feature selection
Dataset Ratio
Feature Selected Unsupervised (Validation)
EM K Means FarthestFirst Clusterer Filtered Xmeans Density Make
German
99:1 0.42 0.71 0.52 0.71 0.61 0.7
95:5 0.4 0.59 0.64 0.59 0.59 0.59
90:10 0.78 0.72 0.6 0.72 0.55 0.71
80:20 0.73 0.52 0.32 0.52 0.7 0.54
70:30 0.63 0.48 0.68 0.48 0.68 0.48
60:40 0.54 0.41 0.46 0.41 0.48 0.42
50:50 0.62 0.36 0.28 0.36 0.48 0.36
Austria
99:1 0.92 0.95 0.1 0.95 0.16 0.93
95:5 0.2 0.1 0.09 0.1 0.96 0.15
90:10 0.92 0.1 0.09 0.1 0.09 0.12
80:20 0.19 0.94 0.08 0.94 0.09 0.94
70:30 0.9 0.92 0.09 0.92 0.92 0.92
60:40 0.88 0.91 0.08 0.91 0.08 0.91
415
Table 5: F-measure of clustering before feature selection
Dataset Ratio
Feature Selected Unsupervised (F-measure)
EM K Means FarthestFirst Clusterer Filtered Xmeans Density Make
German
99:1 0.9 0.72 0.55 0.72 0.72 0.71
95:5 0.28 0.69 0.16 0.69 0.59 0.67
90:10 0.88 0.59 0.19 0.59 0.59 0.6
80:20 0.67 0.53 0.06 0.53 0.68 0.54
70:30 0.59 0.43 0.64 0.43 0.63 0.43
60:40 0.54 0.58 0.28 0.58 0.49 0.58
50:50 0.54 0.47 0.2 0.47 0.52 0.47
Austria
99:1 0.81 0.64 0.16 0.64 0.64 0.65
95:5 0.88 0.63 0.13 0.63 0.8 0.64
90:10 0.47 0.78 0.42 0.77 0.77 0.77
80:20 0.87 0.94 0.14 0.94 0.79 0.93
70:30 0.88 0.79 0.02 0.79 0.92 0.79
60:40 0.81 0.5 0.13 0.5 0.08 0.51
[image:8.612.91.525.295.744.2]50:50 0.85 0.76 0.11 0.76 0.87 0.74
Table 6: Validation of clustering after feature selection
Dataset Ratio EM K Means Feature Selected Unsupervised (Validation) Farthest
First Clusterer Filtered Xmeans Density Make
German
99:1 72.6 56 64.5 56 56 54.7
95:5 70.9 57.4 50.4 57.4 57.4 56.7
90:10 64.3 60.7 52 60.7 60.6 59.4
80:20 58.9 62.3 65 62.3 62.3 60.9
70:30 60.2 63.7 63.6 63.7 63.7 63.7
60:40 61 67.6 55.4 67.6 55 67.3
50:50 70.3 68.8 67.4 68.8 53.1 68.5
Austria
99:1 85.8 90.8 94.5 90.8 90.8 88.6
95:5 86.9 92.9 93.9 92.9 92.8 90.5
90:10 87.2 93.3 93.7 93.3 93.5 91.7
80:20 86.3 92 92.4 92 92 91.1
70:30 86.7 89.8 89.9 89.8 89.8 89.3
60:40 86.3 89.6 89.6 89.6 89.6 89.4
50:50 86.6 86.1 86.1 86.1 86.1 86.4
Table 7: F-measure of clustering after feature selection
Dataset Ratio
Feature Selected Unsupervised (F-measure)
EM K Means FarthestFirst Clusterer Filtered Xmeans Density Make
German
99:1 0.42 0.71 0.52 0.71 0.61 0.7
95:5 0.4 0.59 0.64 0.59 0.59 0.59
90:10 0.78 0.72 0.6 0.72 0.55 0.71
80:20 0.73 0.52 0.32 0.52 0.7 0.54
70:30 0.63 0.48 0.68 0.48 0.68 0.48
60:40 0.54 0.41 0.46 0.41 0.48 0.42
50:50 0.62 0.36 0.28 0.36 0.48
416 Austria
99:1 0.92 0.95 0.1 0.95 0.16 0.93
95:5 0.2 0.1 0.09 0.1 0.96 0.15
90:10 0.92 0.1 0.09 0.1 0.09 0.12
80:20 0.19 0.94 0.08 0.94 0.09 0.94
70:30 0.9 0.92 0.09 0.92 0.92 0.92
60:40 0.88 0.91 0.08 0.91 0.08 0.91
50:50 0.86 0.86 0.86 0.86 0.86 0.88
4. CONCLUSION
Credit card data is classified as a Generic data of Static data within a data perspective view. Since Generic data are consist of Structural Features, we practiced with structure feature selection algorithms [13]. This study has experimented 6 unsupervised learning algorithms with 10 feature evaluators and 11 search methods to find an effective feature selection in unsupervised learning to detect credit card fraud. The study also performed to increase credibility by adapting both ranked and unranked algorithms.
The expected effectiveness of our research is: Using unsupervised learning method, enables massive data processing which leads to reduction of costs and resources and detect underlying fraud among unlabeled data.
Moreover, it derives expandability to refer as a basic knowledgement in feature selection for fraud detection. Our research expects to lead the effective way for deducting results by practiced feature selection in fraud detect circumstances.
5. LIMITATION AND FUTURE RESEARCH
This research uses German and Austria credit card dataset in UCI repository. Real credit card data contains a lot of noise so it requires more processing. We have performed this study on limited data. If we get real data, we need to test validation and efficiency using that data. But It's too hard to get real credit card data. Related companies need to disclose the data for this research.
We're going to do research to automate finding Fraud Detection. Automate all processes from data collection to categorization to be able to change the feature. Because Fraud is constantly evolving, you need to modify the feature when you want.
6. ACKNOWLEDGEMENTS
This research was supported by the MSIP (Ministry of Science, ICT and Future Planning), Korea, under the ITRC (Information Technology Research Center) support program (IITP-2017-2015-0-00403) supervised by the IITP (Institute for Information & communications Technology Promotion) and by Institute for Information & communications Technology Promotion (IITP) grant funded by the Korea government (MSIP) (No. R0132-16-1004, Development of Profiling-based Techniques for Detecting and Preventing Mobile Billing Fraud Attacks)
REFERENCES:
[1] Jarrod West et al, “Intelligent Financial Fraud Detection Practices: An Investigation,” in
Proceedings of the 10th International
Conference on Security and Privacy in Communication Networks,2014.
[2] Seung-Hyun Kim, Huy Kang Kim, Eunjin Kim, “A Study on the Improvement of FDS Effectiveness over the Case Analysis on E-commerce Credit-card Fraud-to-sales,” Journal of Knowledge Information Technology and Systems, 2015.
[3] Maria R. Lepoivre et al, “Credit Card Fraud Detection with Unsupervised Algorithms,”
Journal of Advances in Information
Technology, Vol 7. No.1, 2016.
[4] Remi Domingues, “Machine Learning for Unsupervised Fraud Detection,” in Proc. of International Symposium on Augmented Reality (ISAR), 2015.
[5] Jennifer G. Dy, Carla E. Brodley, “Feature Selection for Unsupervised Learning,” Journal of Machine Learning Research, 2004
417 [7] Narendra Sharma, Aman Bajpai, Mr. Ratnesh
Litoriya, “Comparison the various clustering algorithms of weka tools,” International Journal of Emerging Technology and Advanced Engineering, Vol 2. 2012.
[8] Dempster, Arthur P., Nan M. Laird, and Donald B. Rubin. "Maximum likelihood from incomplete data via the EM algorithm." Journal of the royal statistical society. Series B (methodological), pp. 1-38, 1977
[9] Hartigan, John A., and Manchek A. Wong. "Algorithm AS 136: A k-means clustering algorithm." Journal of the Royal Statistical Society. Series C (Applied Statistics) 28.1, pp. 100-108, 1978
[10] He, Zengyou. "Farthest-point heuristic based initialization methods for k-modes clustering." arXiv preprint cs/0610043, 2006
[11] Pelleg, Dan, and Andrew W. Moore. "X-means: Extending K-means with Efficient Estimation of the Number of Clusters." ICML. Vol. 1. A, 2006r
[12] Silverman, Bernard W. “Density estimation for statistics and data analysis.” Vol. 26. CRC press, 1986
[13] Jundong Li et al., “Feature Selection: A Data Perspective,” arXiv:1601.07996v3 [cs.LG], 2016.
[14] Chen, Yihua, et al. "Similarity-based
classification: Concepts and algorithms." Journal of Machine Learning Research, pp. 747-776, 2009
[15] Torkkola, Kari. "Information-theoretic
methods." Feature Extraction. Springer Berlin Heidelberg, pp. 167-185, 2008
[16] Ye, Jieping, and Jun Liu. "Sparse methods for biomedical data." ACM SIGKDD Explorations Newsletter, pp. 4-15, 2012
[17] Anis, Maira, Mohsin Ali, Amit Yadav, “A COMPARATIVE STUDY OF DECISION
TREE ALGORITHMS FOR CLASS
IMBALANCED LEARNING IN CREDIT CARD FRAUD DETECTION,” International Journal of Economics, Commerce and Management, Vol. III, Issue 12, 2015.
[18] Chawla, Nitesh V., et al. "SMOTE: synthetic minority over-sampling technique." Journal of artificial intelligence research 16, pp. 321-357, 2002.
[19] Powers. David M. W, “Evaluation: From Precision, Recall and F-Measure to ROC, Informedness, Markedness & Correlation,” Journal of Machine Learning Technologies, No.2, pp. 37-63, 2011.
[20] Binita Kumari, Tripti Swarnkar, “Filter versus Wrapper Feature Subset Selection in Large Dimensionality Micro array: A Review,” International Journal of Computer Science and Information Technologies, Vol 2, No. 3, 2011. [21] Reformat, Marek, and Sonal Patel. "Criteria of
Human Software Evaluation: Feature Selection Approach." SEKE. 2011.
[22] M. Dash and H. Liu, “Feature Selection for Clustering,” Proc. Fourth Pacific Asia Conf. Knowledge Discovery and Data Mining, 2000. [23] Jennifer G. Dy, Carla E. Brodley, "Feature