THE DECISION-MAKING MODEL REGARDING THE
COMPLEXITY OF SYSTEM
SIHAM ABDULMALIK MOHAMMED ALMASANI1*, VALERY IVANOVICH FINAEV2, WADEEA AHMED ABDO QAID3, ALEXANDER VLADIMIROVICH TYCHINSKY4
1, 2, 4
Southern Federal University, Bolshaya Sadovaya Str, Rostov-on-Don, Russia
3
Faculty of Computer Science and Engineering, Hodeidah University, Yemen
E-Mail: [email protected]
ABSTRACT
The article is devoted to the development of methods and decision-making models for assessing the complex system concept. The justification of the relevance of the complex system assessment problem to solve the simulation and system control problems. The system definition and the basic concepts of the systems classification are given. The analysis of the existing complex systems definitions is shown. The necessity of using the expert assessment of the system complexity is determined. The method of the system complexity assessment (determination) based on the experts knowledge is proposed. In this article the application of the classification model for decision-making regarding the complex system is shown. The example of the stock market complexity assessment is considered.
Keywords
: S
ystem, Complexity, Assessment, Parameters, Simulation, Decision-making, Experts.1. INTRODUCTION
The determination of the concept “complex system” and assessing the system complexity are very important problems. During the assessment of the system complexity it can be selected the advance what suitable methods should be used for systems studying and simulation. The concept “complex system” has been used for a long time. The definition of the complex system was formulated by many scientists and was shown in many scientific papers. However, nowadays it’s still difficult to say “where are the boundaries between the concepts “system” and “complex system”. In the 20th century many scientists began to study the concepts “systems approach”, “the large-scale system” and “the complex system” in various branches of science: physics, mathematics, economics, biology, psychology, philosophy, etc. The mostly important it was in researching and designing the intelligent systems in different fields of human activity.
The large-scale system was defined as a controlled system, considered as a set of interrelated subsystems unified by a common goal of functioning [1], [2]. The complex system was defined as a compound object, whose parts can be regarded as systems, naturally integrated into a
single unit, in accordance with the certain principles or interconnected defined relationships.
These and other definitions have appeared in the studying of the control problem of the large-scale and the complex systems. Also they have been formulated by many famous scientists such as St. Bir, V.M. Glushkov, G.N. Pivovarov, B.S. Fleischmann, U.R. Ashby and others. The characteristics of the large-scale systems: the presence of separated parts (controlled subsystems); participation in the system of human, machines sand environment; the presence of material, energy and informational connections between the system parts as well as the connections between this system and others [2]. Typically, the system complexity is associated with the number of the elements and the connections between them.
simulation is shown. It starts from the difficult methods and ends with the analytical methods. The simulation methods form two large classes: the methods of the formalized systems representation; methods directed to the activation of the intuition and the experts knowledge application. In [3] it’s also stated that on the basis of methods from two different classes other special methods can be developed. Therefore, if a determination of the system complexity is entered, it can be beforehand drawn a conclusion on the application of the simulation method.
The rest of the paper is structured as follows: In section 2, a brief review of some of the literature works in the complex system and its complexity are presented. In section 3, the proposed method for assessing the complexity of the system by the experts is presented. Simulation the proposed model and an analysis are showed in Section 4. Finally, the conclusions are summarized up in Section 5.
2. REVIEW OF RELATED RESEARCH
The system complexity is connected with the system definition. There are a lot of works in which the system is defined [3] - [6]. The most reliable is to define the system by a number of sets [3], [7]:
S≡<A, QA, R, QR, B, Z, SZ, ∆T, N, LN>, (1)
where A={ai} - the set of the system elements,
QA – the set of the elements properties, R={rj} - the set of the connections between the elements, QR - the set of the connections properties, B - the
goal of the system functioning, Z - the conditions of
the goal formation, SZ - the set of the constructive
system parameters, ∆T - the time interval of the
system life cycle, N - the observer, LN - the observer
language.
In the systems theory there are the principles of the systems classification. And it’s noted that all classifications are relative and directed to the limitation of the system display variants from a common continuum. The common concepts for all classifications are:
- system openness, expressed in the ability of exchanges with the external environment, and the system closeness, expressed in the system isolation system from the external environment;
- system purposiveness;
- the system organization and self-organization degree;
- the nonstationarity, afteraction and nonlinearity manifestation;
- the degree of the adaptation into the external environmental conditions.
In [8] there is the following definition "the system is called a large-scale system if its research or simulation is complex because of its dimensions,
i.e. the set of the system states S has large
dimension". The author in this work didn’t answer what is the large dimension. In [8] it was proposed that "a system called complex if there is no enough resources to effective describing (situations, the laws of functioning) and the system control – determination, definition of the control parameters or to make decisions in such systems (in such systems there always must be the decision-making subsystem)". In this work the following problems are considered: uncertainty, what the effective system definition is and how the lack of the resources can be assessment.
In [9] when assessing the complexity, the priority is given to the number of connections between the elements and it’s introduced the
assessment criterion - the level for determining the
system complexity. In [10] it’s proposed an approach of the systems division into the complex and the simple systems using the dichotomy method
In [11] it’s proposed to distinguish four types of systems complexity: the complexity of the existing system analysis; the complexity of the new system synthesis; the complexity of the created system replication; the complexity of the existing system reproduction. The author pretend to the universal method of the system complexity assessment, i.e. it should be considered all the aspects of the interaction with the system: analysis, synthesis, replication, reproduction. Although the author of [11] writes about the mapping degree, but there is no concrete measure of the complexity assessment.
In [12] it’s presented that the determination of the engineered systems complexity has two components. The first is an objective component, which is an increasing function of the system elements number and their connections. The second component of complexity determination is the subjective component, which is the system distance from the reference model for simplicity.
Bayes' rule is utilized to obtain the new uncertainty weights of the criteria by integrating the AHP weights and the DEMATEL weights. The information theory is employed to evaluate the complexity of the supply chain system.
In [14] it’s proposed the IHC methodology meta-description to control the information system complexity and to verify it in practice on a SAP implementation project. This was made on the basis of determination the complexity of the data and organization dimensions and it was selected a variant with the lowest complexity.
In [15] it’s presented the symplectic entropy (SymEn) determination, an analysis method based on SymEn to assess the nonlinearity of the complex system by analyzing the given time series. Its algorithm is a logarithmic measure of the average amount of energy about the underlying probability distribution in different directions of a system, like the Shannon entropy.
There are many other works in which the authors propose assessing the system complexity. However, through a review of the references, it’s clear that no one could specify the limits of the complexity and give an acceptable degree for the complexity
assessment. The system complexity isn’t
quantitative but the characteristic are qualitative. Therefore, the experts assessments and the appropriate criteria for the complexity assessment are necessary for assessing the complexity degree of the particular system.
3. SYSTEM COMPLEXITY ASSESSMENT BY EXPERTS
The complexity is a verbal parameter. When determining the system complexity there is an uncertainty. In the analysis of any complex system there is an uncertain situation. This situation is characterized by specific variables or predefined specific parameters. These parameters have their measurements. The fuzzy situation can be classified according to the parameters values which are obtained previously in assessing the system complexity. On the basis of the classification results, it can be made a conclusion about the system complexity degree, defining previously the determination scale for this verbal variable. To formalize the concept "complex system" it’s proposed an approach based on the experts knowledge.
The linguistic variable (LV) s – “complex
system” is defined. It’s determined by a set < s, T(s), X, G, M >, where s is a name of the LV; T(s)
is a term-set of the LV s; X is a definitional domain
of the LV s; G is a syntactic rule; M is a semantic rule [16], [17].
For the LV s the term-set is defined, for
example, T(s) = {s1– “simple system”, s2 –
“complex system”, s3 – “very complex system”}.
For the fuzzy variables (FV) si experts define fuzzy
sets < si, C~(si), X >, where
} / ) ( { ) s ( ~
) s (
i = < i x x>
C µC , x∈X - fuzzy subsets of X;
) ( ) s (i x C
µ - membership functions of the elements
x∈X to the fuzzy sets C~(si). The set X is a scale of
complexity determination in units from 0 to 1 or as a percentage between 0% and 100%. The scale of complexity determination is a basic set for defining
the FV from the term set T(s).
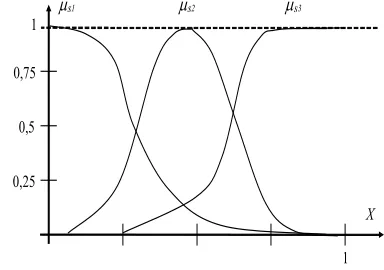
An example of defining the membership
functions C(s)
(
x
)
i
[image:3.612.321.513.330.465.2]µ
by experts is shown inFigure. 1.
µs1
1 0,25
0,75
X
1
0,5 1
µs2 µs3
Figure. 1. Membership functions of the fuzzy sets of the LV s – “complex system”
As the result, the measure is defined for the concept “complex system”. The system complexity can be determined on the basis of the experts knowledge.
Let’s consider the complex system parameters determination.
There is the system definition (1) and there are known the system properties [3]- [6]. System
parameters P are defined according to the system
properties, for example:
- p1 – the nonstationarity manifestation degree;
- p2 – the afteraction manifestation degree;
- p3 – the self-organization manifestation degree;
- p4 – the purposiveness manifestation degree;
- p5 – the adaptation to the external environment
degree;
- p6 – the dimension of the system state;
- p7 – the presence of the informational
resources;
- p9 – the degree of communication with
environment complexity, etc.
The number of parameters is determined by experts. Into the number of parameters may be included the other features of the system: the system structure, the number of the system elements, the number of connections between the elements, the subsystems number and others. Experts can enter the parameters ranking or define lexicographical relation on the set P. As a result it will be easier to make decisions about the complexity.
The parameters can be both the quantitative and the qualitative (have a verbal definition). Let’s define all the system parameters in the form of the LV. This will allow applying the decision-making model with respect to the system complexity. All fuzzy variables (FV) are determined by experts. Let’s consider the following example:
- the LV s – “complex system” with the term-set
T(s) = {s1 – “simple system”, s2 – “a little complex
system”, s3 – “almost complex system”, s4 –
“complex system”, s5 – “rather complex system”,
s6 – “a very complex system”, s7 – “above the
complex system”};
- the LV p1 – the nonstationarity manifestation
degree with term-set T(p1)={
1 1
p
- “weaknonstationarity manifestation”,
p
12 - “enoughnonstationarity manifestation”,
p
13 - “strongnonstationarity manifestation”};
- the LV p7 – the presence of the informational
resources with term-set T(p7)={
1 7
p
- “a littlenumber of informational resources”,
p
72 - “amedium number of informational resources”, 3
7
p
- “a large number of informationalresources”}.
As shown in the example, the term-set T(s) of
the LV s - “complex system” shows that the number of terms may increase to seven. The practical results show that we should not increase the number of terms more than seven. Experts define fuzzy variables on the basic sets. The basic sets are also determined by the experts on the basis of traditional assessments or on the basis of subjective views. For example, the basic sets can be applied as the set of real numbers on the interval [0, 1] or as the set of integers on the interval [0, 100] (percentages). The basic set can be defined in the measurement range of physical quantities.
Thus, the description of the system situations and their assessments can occur through a
measurable factors and specific basic sets of the LP
from set P. P verbal describes the parameters of the
complex system and sets S, which includes the
assessments of the system's complexity. Different models of fuzzy inference can be applied to assess the system complexity. To assess the system complexity (conclusion about the complexity) the widespread classification model is applied [16] – [23]. Model is defined as a mapping
w=<P,S,H>,
X
×
H
W→
H
, (2)where W – a mapping w graphic, P×S – a space
of the mapping w departure; S – a space of the
mapping w arrival.
The model of fuzzy inference is defined as a table of mapping “situation – decision”. The rules of the fuzzy inference are in the rows of the table. The fuzzy inference is defined by a fuzzy state IF
1
p
%
AND IF%
p
2 AND … AND IF%
p
n, THENs
%
. The premise of the rule IF%
p
1 AND IF%
p
2AND … AND IF
%
p
n defines the system state andat the end
%
s
- made decision.The classification model is not only using for the decision-making of system complexity. Other models [24]-[27] can be used. Thus, this approach uses the expert assessments to the system complexity to represent the system, which is necessary to solve the problems with a high degree of uncertainty. These problems may be different, for example, the study of industrial processes and the problems of the economy in particular investments, social orientation and other problems. In these problems the role of heuristic approaches and experiment is obvious to prove the adequacy of the model. These problems become increasingly complex. Also, the system model is needed to control the system. The more complex the system is, the harder it’s to find a system model for control problems. If the system complexity assessment is made before solving the control problem, the conclusion about the costs value to solve the simulation problem will be drawn beforehand. Based on the complexity degree, it can be concluded that during the simulation it’s enough to use only analytical methods or it’s necessary to apply decision-making model or to apply models symbiosis (aggregation)
of stationarity, in another subset – mayn’t. In states may be manifestations of randomness. A stock market is an example of such system [28] – [31]. On the stock market may be periods with stable states changing, and there may be periods with unpredictable changing.
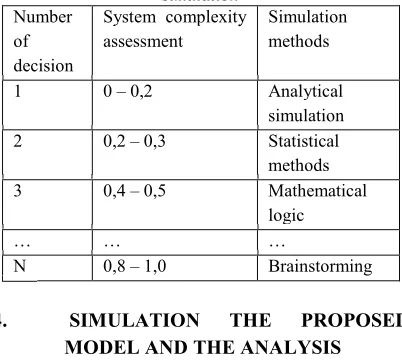
[image:5.612.94.295.267.447.2]The example of defining by experts the simulation method depending on the system complexity assessment is shown in Table 1. There are connections between the system complexity assessment and the methods used for simulation.
Table 1. The connections between the system complexity assessment and the methods used for
simulation Number
of decision
System complexity assessment
Simulation methods
1 0 – 0,2 Analytical
simulation
2 0,2 – 0,3 Statistical
methods
3 0,4 – 0,5 Mathematical
logic
… … …
N 0,8 – 1,0 Brainstorming
4. SIMULATION THE PROPOSED MODEL AND THE ANALYSIS
Let’s consider the determination (assessment) of the stock market complexity. Let’s define the system parameters, defined by the linguistic variables:
- p1 – the nonstationarity manifestation degree;
- p2 – the afteraction manifestation degree;
- p3 – the contingency manifestation degree;
- p4 – the degree of communication with
environment complexity;
- p5 – the presence of the informational
resources.
In the linguistic variable p4 – the degree of
communication with environment complexity the following factors are considered: the population involvement in the investing on the stock market; the stiffness of legislation regulating the stock markets activities and the supervisory authority pressure; the tension of the political situation in the country and in the world; the state of business activity; the overall economic situation.
In the linguistic variable p5 – the presence of the
informational resources the informational
connection with the leading stock markets should be considered.
The linguistic variables and theirs fuzzy variables are determined by experts:
- the linguistic variable p1 – the nonstationarity
manifestation degree with term-set Т(p1)={
1 1
p - little;
p
12 - medium; 3 1p
- large};- the linguistic variable p2 – the afteraction
manifestation degree with term-set Т(p2)={
1 2
p - little; 2 2
p - medium; 3
2
p - large};
- the linguistic variable p3 – the contingency
manifestation degree with term-set множество Т(p3)={ p13 - low; p32 - medium;
3 3
p - high};
- the linguistic variable p4 – the degree of
communication with environment complexity with
term-set Т(p4)={p41 - low; p42 - medium;
3 4
p - high};
- the linguistic variable p5 – the presence of the
informational resources with term-set Т(p5)={
1 5
p
- little;p
52 - enough; 3 5p
- large}.The set S of the stock market assessments, as a complex system, has the following values: the asses
s1=0– 0,2 – “simple system”; s2=0,2+ – 0,4 - “not
enough complex system”; s3=0,4+ - 0,6 – “complex
system”; s4=0,6+ – 0,8 – “very complex system”;
s5=0,8+ – 1 – “above the complex system”.
Experts define the mappings
[image:5.612.316.522.482.719.2]“situation - decision” to make a decision about the degree of the stock market complexity as shown in Table 2.
[image:5.612.316.520.484.717.2]table "situation-solution" Table 2. The
№ Rule
β1 β2 β3 β4 β5
Deci-sion
1 1
1 β 1 2 β 1 3 β 1 4 β 1 5
β S2
2 1
1 β 1 2 β 1 3 β 1 4 β 2 5
β S2
3 1
1 β 1 2 β 1 3 β 1 4 β 3 5
β S1
4 1
1 β 1 2 β 1 3 β 2 4 β 1 5
β S2
5 1
1 β 1 2 β 1 3 β 3 4 β 2 5
β S2
… … … …
241 3
1 β 3 2 β 3 3 β 3 4 β 1 5
β S4
243 1
1 β 3 2 β 3 3 β 3 4 β 3 5
β S5
Experts define the membership functions
} x / ) x ( i i ) p ( C j i >
1,5 i }, x / ) x ( {
) p (
C~ i C(pj) i i
i > =
<
= µ . To make a
decision the subset Rk is selected from the set of rules R for every decision sk∈S so that Rj×Rk=∅, j≠k. j,k=1,2304 . The membership of the decision
) x ,..., x , (x1 2 5 Lj
µ
to the reference class Ljis definedby the formula
5
1 2
5 1 2
1 2 5 1 2 5
( , ,..., )
( ... ) j j j j( ) & j( ) &...& j( )
j
j n
L x x x p p p L p x p x p x
µ µ µ µ
∈
= ∨
S 1, = j , 1,5 = i , XI
xi∈ . (3)
A decision about the stock market complexity is making according the following algorithm. A point is found in a factor space (x ,x ,...,x50) X
0 2 0
1 ∈ . This
point defines the stock market state at the current moment. The values of the fuzzy variables membership functions, which are substituted into
the formula (3) for all j, are compared to the values
0 5 0 2 0 1
,
x
,...,
x
x
on the basis sets X1 - X5The values of the membership functions of the
reference classes (x ,x ,...,x0),j=1,S
5 0 2 0 1 Lj
µ are
calculated. The reference classes maximum value
S L
µ
corresponds to the making decision hs, i.e.0 0 0
5
(
1,
2,...,
)
max
SL L n
j
x
x
x
µ
=
µ
(4)Experts define the mapping between the
elements of the set S and the elements of the
simulation set M to research the stock market. The
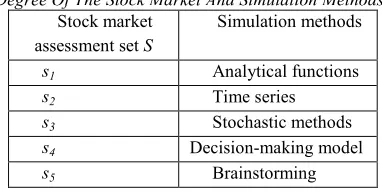
[image:6.612.100.291.497.595.2]way of the mappings defining is shown in Table 3.
Table 3. The Relationship Between The Complexity Degree Of The Stock Market And Simulation Methods
Stock market assessment set S
Simulation methods
s1 Analytical functions
s2 Time series
s3 Stochastic methods
s4 Decision-making model
s5 Brainstorming
Software in MATLAB was developed to make a decision about the degree of the stock market complexity. The expert defines the number of linguistic variables, theirs term-sets and the fuzzy variables membership functions. An example of defining and entering the linguistic, the fuzzy variables and theirs membership functions by the experts is shown in Figure.2.
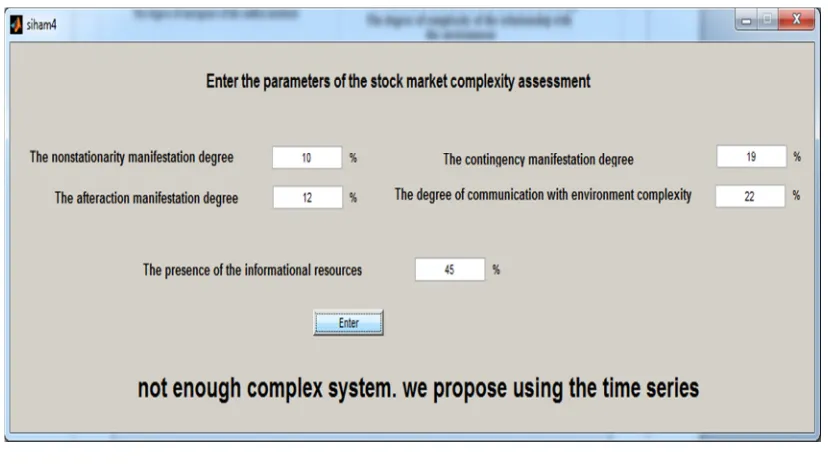
Then a user enters the stock market parameters: the values of the nonstationarity manifestation
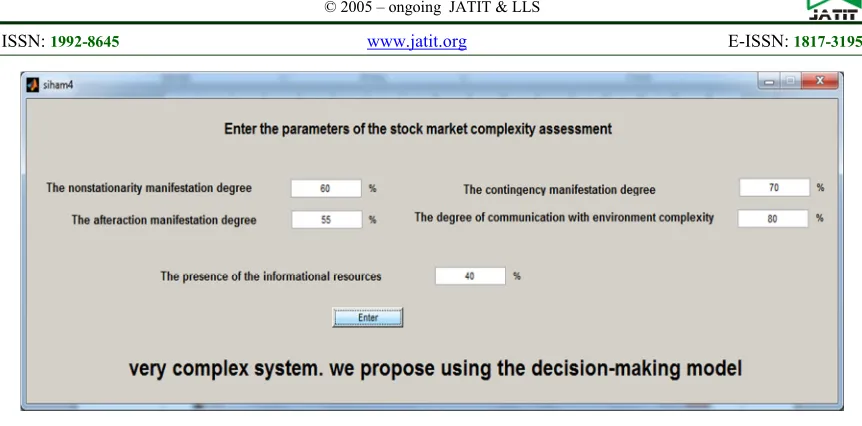
degree, the afteraction manifestation degree, the contingency manifestation degree, the degree of communication with environment complexity and the presence of the informational resources. The result is shown in Figure.3.
The program determines the stock market complexity degree and gives the recommendations about the most appropriate simulation method (see. Figure.3). In Figure. 4 another example of entering the parameters of the stock market and the decision-making is shown. The program defines the stock market as a very complex system and proposes the decision-making model as the simulation method.
Figure. 2. The Linguistic, Fuzzy Variables And Membership Functions
[image:7.612.100.514.391.623.2]Figure. 4. Another Example Of The Stock Market Complexity Assessment
5. CONCULUSIONS
In the article, the new method of system complexity determination is developed. The base of the method is the expert knowledge and the decision-making model. It’s difficult to formalize the concept “complex system” and to determine it. But the system complexity can be assessed by using the experts knowledge. Knowing the system complexity is necessary for the system simulation. The direction of the future researches can be planned according to the system complexity assessment to achieve the most effective results.
REFERENCES
[1] Safonov, V. The big system. 2006. [Electronic
resource]. – Access mode: http://victor- safronov.ru/systems-analysis/glossary/large-scale-system.html. (In Russian)
[2] Sadovsky V.N. Grounds of general systems
theory: Logic - methodological analysis.. - M
.:science, 1974. - 279 p. (In Russian)
[3] Volkova V.N, Denisov A.A. Basics of systems
theory and systems analysis. - L: Publishing house SPbGTU, 1997. 510 p. (In Russian)
[4] Mesarovic M. Takahara I. General Systems
Theory: mathematical foundations. M .: Mir, 1978. 311p. (In Russian)
[5] Uyomov A.I. System approach and general
systems theory. M.: Thought, 1978. 204p. (In Russian)
[6] Chernyak Y.I. System analysis in managing
the economy. M: Economy, 1975. 191p. (In Russian)
[7] Finaev V.I. Simulation systems. Taganrog:
Publishing House of the SFU, 2013.181p. (In Russian)
[8] The concept of a big and complex system.
2010 [Electronic resource]. Access mode: http://cribs.me/sistemnyi-analiz/ponyatie-bolshoi-i-slozhnoi-sistemy. (In Russian)
[9] Kokhanovskiy V.A, Sergeyeva M.K,
Komakhidze M.G. Evaluation the complexity
of systems. Rostov-on-Don, Publishing
House of DSTU, 2012. № 4 (65), pp. 22 - 26. (In Russian)
[10] Tsvetkov V.I. Dichotomic analysis of the
complexity of the system. Perspectives of
Science and Education, 2014, № 2(8): pp.15-20. (In Russian)
[11] Sokolov V.V. The approach to assessing the
complexity of the systems. 2012 [electronic
resource]. - Access mode:
http://www.ait.org.ua/p/pub_podhod.html. (In Russian)
[12] Mahmoud Efatmaneshnik and Mike Ryan. A
general framework for measuring system
complexity. Complexity ,2016, volume 21,
Issue S1,pp: 533–546.
[13] An-Yuan Chang , Kuo-Jen Hu , Philip Hsu ,
Chih-Hung Hsu. An integrated model for the evaluation of supply chain system complexity. Computational and Business Intelligence (ISCBI), 2016 4th International Symposium ,IEEE.
[14] Ilja Holub. Methodology for Measuring the
Complexity of Enterprise Information
Systems. Journal of Systems Integration,
2016, Vol 7, No 3.
[15] Min Lei, Guang Meng, Wenming Zhang ,
Joshua Wade and Nilanjan Sarkar.
Symplectic Entropy as a Novel Measure for
[16] Finaev V.I. Models of decision-making systems. Taganrog: TSURE, 2005. 118p. (In Russian)
[17] Borisov AN, Alekseev AV, Krumberg OA
and others. Models of decision-making on the
basis of linguistic variable. Riga, Zinatne, 1982. 256p. (In Russian)
[18] Borisov AN, Krumberg OA, Fedorov IP
Decision-making based on fuzzy models: examples of use. Riga: Knowledge, 1990. 184 p. (In Russian)
[19] Bershtein L.S., Bozhenyuk A.V. Fuzzy
decision-making model: deduction, induction, analogy. Monograph. - Taganrog: TSURE, 2001. 110 p. (In Russian)
[20] LA Zadeh. Fuzzy sets and their application to
pattern classification and clustering analysis. Published in: Book: Fuzzy sets, fuzzy logic,
and fuzzy systems. Pages 355 - 393. World
Scientific Publishing Co., Inc. River Edge, NJ, USA ©1996.
[21] Muhammad Saqlain, Rao Muzamal Liaqat,
Nazar A. Saqib, Mazhar Hameed. A Classification Model for Predicting Heart
Failure in Cardiac Patients. Internet of Things
Technologies for HealthCare, 2017,Volume 187 of the series Lecture Notes of the Institute for Computer Sciences, Social Informatics and Telecommunications Engineering, pp 36-43.
[22] Huihui Liu, Xianhai Yang, Rui Lu.
Development of classification model and QSAR model for predicting binding affinity of endocrine disrupting chemicals to human
sex hormone-binding globulin. Chemosphere,
Elsevier, 2016 , Volume 156, Pages 1–7.
[23] Ramirez. S. and Lizarazo. I. Decision tree
classification model for detecting and tracking
precipitating objects from series of
meteorological images. In: GEOBIA 2016:
Solutions and Synergies. University of Twenty Faculty of Geo-Information and Earth Observation (ITC) .
[24] Siham Abdulmalik Mohammed Almasani,
Valery Ivanovich Finaev, Wadeea Ahmed
Abdo Qaid end Tychinsky Alexander
Vladimirovich. Assessingthe current state of
the stock market under uncertainty. Journal of
Theoretical and Applied Information
Technology. Vol.89. No.1, 2016. - РР. 164 – 171.
[25] Melanie McBride. Decision-Making Models.
Project Management Basics, 2016, pp 145-148
[26] Zhinan Hao, Zeshui Xu, Hua Zhao, Ren
Zhang. Novel intuitionistic fuzzy decision making models in the framework of decision
field theory. Information Fusion, Elsevier,
January 2017, Volume 33, Pages 57–70.
[27] Okuneva Elena Olegovna. Comparison of the
mathematical models of decision making
under the condition of distinctness. Internet
journal «science knowledge», 2016, v
olume
8, No.3.( In Russian)
[28] KLAUS ADAM, ALBERT MARCET,
JUAN PABLO NICOLINI . Stock Market
Volatility and Learning. The Journal of
Finance, 2016, Volume 71, Issue 1, Pages 33– 82.
[29] Abiola A Babajide , Lawal Adedoyin Isola,
Russell Olukayode Somoye. Stock Market Response to Economic Growth and Interest Rate Volatility: Evidence from Nigeria. International Journal of Economics and Financial Issues, 2016, 6(1), 354-360.
[30] Naveed Ahmad, Muhammad Ramzan. Stock
MarketVolatility and Macroeconomic Factor
Volatility. International Journal of Research
in Business Studies and Management, 2016, volume 3, Issue 7, pp: 37-44.
[31] 31. Lialin VA The Russian stock market: the