IJPSR (2011), Vol. 2, Issue 11 (Research Article)
Received on 05 July, 2011; received in revised form 24 September, 2011; accepted 27 October, 2011
DISCRIMINATORY DISSOLUTION METHOD DEVELOPMENT AND VALIDATION FOR CEPHALEXIN OD TABLETS
C. N. Nalini 1, K.Kavitha 2, S. Ramachandran*3, Vijay Kumar B. S.1
Department of Pharmaceutical Chemistry, C. L. Baid Metha College of Pharmacy 1, Thoraipakkam, Chennai- 600096, Tamil Nadu, India
Anna University of Technology 2, Tiruchi, Tamil Nadu, India
Department of Pharmaceutical Chemistry, Mohamed Sathak A. J. College of Pharmacy 3, Shollinganallur, Chennai 600119, Tamil Nadu, India
ABSTRACT
In this study, a discriminative dissolution method was developed for Cephalexin OD (orally disintegrating) tablets 750mg. The solubility and stability of the cephalexin API was determined in ten different solutions. In that 0.01N HCl, glycine buffer pH 3-0, acetate buffer pH 4.5 and water gave good stability and the solubility. Dissolution profiling of cephalexin OD tablets 750mg of single batch was done with the selected media containing varying concentration of surfactants (tween 80 and Sodium lauryl sulphate- SLS). The release profile is compared with that of the control media. The media that gave discriminately faster release than that of the control were found to be 0.01N HCl with 0.75% of tween 80, 0.01N HCl with 0.5% of SLS, acetate buffer with 1% of tween 80 and water with 0.5% of SLS. With the selected media, dissolution profile was done on the three different batches of cephalexin OD tablets one with lesser polymer ratio and other with higher polymer ratio that that of the test batch. Only 0.01N HCl with 0.75% of tween 80 as dissolution medium was found to show good discrimination in the release profile with change in the formulation conditions. The discriminative dissolution method developed was validated for its specificity, accuracy, stability, linearity and precision and it passes all the parameters.
INTRODUCTION: Dissolution 1 is defined as the process by which a solid substance enters in the solvent to yield a solution. Pharmaceutical solid dosage forms and solid liquid dispersed forms on administration undergo dissolution in biological media followed by adsorption of drug entity in to systemic circulation. In determining the dissolution rate of drug from solid dosage forms under standardised condition one has to consider several physic chemical processes in addition to the process involved in the dissolution of pure chemical substances. The physical characteristics of dosage form the wettability of the dosage unit the penetration ability of the dissolution medium , the
swelling process, the disintegration and de aggregation of the dosage form are a few of the factors that influence the dissolution characteristic of the drug. Discriminative dissolution is a method which is sensitive to change in formulation, raw materials characteristic and critical manufacturing variables is said to be discriminative. Dissolution is the important parameter to forecast the bioavailability. Dissolution method should be developed which can differentiate the formulation manufactured by the same process. In official or QC release method, the two products may show same dissolution profile but when discriminative
Keywords: Cephalexin,
OD tablets,
Discriminative Dissolution Method
Correspondence to Author:
S. Ramachandran
Department of Pharmaceutical Chemistry, Mohamed Sathak A. J. College of
dissolution method is used we can differentiate the formulation by release profile.
OH
O N
HN
H2N O O
H S
cephalexin
Cephalexin is chemically (6R,7R)-7-((R)-2-amino-2-phenylacetamido)-3-methyl-8-oxo-5-thia-1-aza-bicyclo [4.2.0]oct-2-ene-2-carboxylic acid. Cephalexin is a first generation cephalosporin antibacterial 2. It is administered by mouth for the treatment of susceptible infections including those of respiratory and urinary tract and of the skin. It is bactericidal and acts similarly to benzyl penicillin by inhibiting synthesis of the bacterial cell wall. It is most active against gram positive cocci and has moderate activity against some gram negative bacilli.
MATERIAL AND METHODS: A study of Active Pharmaceutical Ingredients was conducted by carrying out the determination of Quantitative pH dependent solubility and stability. The comparative dissolution profiling in different media was conducted. Based on the solubility and stability four media were selected. These media were combined with varying concentration of two different surfactants and dissolution profile was studied on cephalexin OD tablets in these media.
Selection of Discriminative Media: By comparing the dissolution profile of the different media, four media were selected for discriminative dissolution study. Comparative dissolution profiling of Cephalxen OD tablets was done (three different formulations) in the selected media and from this the media giving best discrimination is taken. Validation of discriminative dissolution method was carried out.
Determination of Quantitative pH dependent Saturation Solubility: Totally 10 solutions have been selected for evaluation of solubility of cephalexin. They are 0.1N HCl (pH 1.00), 0.07N HCl (pH 1.25), 0.01N HCl (pH 1.75), Simulated gastric fluid (SGF pH 2.10), Glycine buffer (pH 3.00), Acetate buffer (pH 4.50), Water (pH
5.30), Phosphate Buffer (pH 6.80), Simulated Intestinal fluid (SIF pH 6.80), Phosphate buffer (pH 7.20).
Preparation of Standard Solution: 100mg of cephalexin working standard is dissolved and diluted to 100ml with the media in which solubility is studied. From this 5ml is withdrawn and diluted to 250ml with same media.
Preparation of Test Solution: Two conical flasks each containing 100ml of the media were taken. To both the flask known amount of API of Cephalexin was added and sonicated for 30minutes. Then the sample was visually inspected for the separation of solution. If the saturation of the solution did not occur then addition quantity of API was added and the sonication was further continued. This procedure was repeated till the solution shows a sign of turbidity or opalescence which indicated the saturation point. Then the solution was filtered through 0.45µ nylon filter. The filtrate was diluted arbitrarily to match with standard concentration. This is considered as test solution. The same procedure was carried out for all the test solution. The absorbance at the λmax of 260nm was measured for both the test and the standard solution. The quantitative pH dependent solubility of the API was calculated.
Determination of pH dependent Solution Stability:
Stock solution were prepared by dissolving 60mg of cephalexin working standard in 100ml of each media studied ( 30µg/ml)and kept in a water bath at 37oC. Then 5ml of the samples were withdrawn at 1hr, 2hr, 4hr, 6hr, 8hr, 10hr, 12hr and 24 hr and then diluted to 100ml with the same media. The absorbance was measured at 260nm,. The ph dependent solution stability was then calculated.
Comparative Dissolution Profiling in Selected Media:
Based on the solubility and stability data four solutions were selected as dissolution media and dissolution profile for the cephalexin OD tablets 750mg tablets. From the batch F1 was carried out. The profile was also carried out in the selected media in presence of surfactant 3. Two surfactants were used namely tween 80 and sodium lauryl sulphate at various concentrations the media used were;
2. 0.01N HCl with 0,0.1,0.25,0.5,1% of SLS
3. Glycine buffer pH3 with 0,0.1,0.25,0.5,1% of tween 80
4. Glycine buffer pH 3 with 0,0.1,0.25,0.5,1% of SLS
5. Acetate buffer pH 4.5 with 0,0.1,0.5,1% of tween 80
6. Water with 0,0.1,1% of tween 80 7. Water with 0.25,0.5% of tween SLS
Dissolution profiles of cephalexin OD tablets in all media were compared with that of the control media which is 0.1NHCl for 0 to 20 hrs and phosphate buffer of pH 6.8 for 3-24 hrs.
The dissolution parameters used are
Apparatus : USP Type I
RPM : 100
Medium : selected Medium
Sink Volume : 900ml Volume withdrawn : 10ml
λmax : 260nm
Procedure: One tablet was placed in each basket 4 (totally three units or vessels used). 10ml of the media was withdrawn at 1st hr, 2nd hr, and then at an interval of 2 hrs until about 90% of the drug is released. In case of test media, 10ml is replaced with same volume of fresh media where as for control (in house media) media is completely replaced with fresh media of phosphate buffer. This is filtered through 0.45µ nylon filter and 5ml of this filtrate was diluted to 100ml with media under study. These were considered as test solution. The absorbances of the test solutions at 260nm were measured and compared with that of standard solution using the formula to determine the percentage release. The dissolution medium was used as blank. The percentage purity was then calculated.
Standard Solution: 45mg of cephalexin working standard is dissolved and diluted 100ml in purified DM
water. From this 5ml is diluted to 100ml with the media under study.
Comparative Dissolution Profiles for different formulations of Cephalexin OD tablets in selected media: Based on the dissolution profile of cephalexin OD tablets of test batch (F1) in different media the media that gave faster release than that of the control were selected as discriminative media. They are
1. 0.01N HCl with 0.75% of tween 80 2. 0.01N HCl with 0.5% of SLS
3. Acetate Buffer pH 4.5 with 1% of tween 80 4. Water 0.5% of SLS
Comparative dissolution 5 profile studies were carried out on two other batches (F2 and F3) of cephalexin OD tablets, one with formula having lower percentage of polymer than that of our test batch and other with that higher percentage until 90% of the drug is released. Dissolution parameters procedure and dilution for the test and standard solutions were maintained the same. The absorbances for test and standard solutions were measured at 260nm against the dissolution medium as blank. The percentage release was calculated. Out of the four media the media that gave highly discriminative dissolution profiles6 for the different batches was selected as the discriminative media.The dissolution test method of cephalexin OD tablets was deteremined by UV spectrometry was validated7 for its specificity, linearity, precision, accuracy and stability in the discriminative media.
TABLE 1: DETERMINATION OF QUANTITATIVE PH DEPENDENT SATURATION SOLUBILITY
Media pH of media Solubility (mg/ml)
0.1N HCl 1.00 49.08
0.07N HCl 1.25 40.92
0.01N HCl 1.75 17.32
Simulated gastric fluid 2.10 15.66
Glycine buffer 3.00 14.53
Acetate Buffer 4.50 14.02
Water pH 5.30 13.41
Phosphate Buffer 6.80 17.22
Simulated Intestinal fluid 6.80 22.96
Phosphate Buffer 7.20 18.60
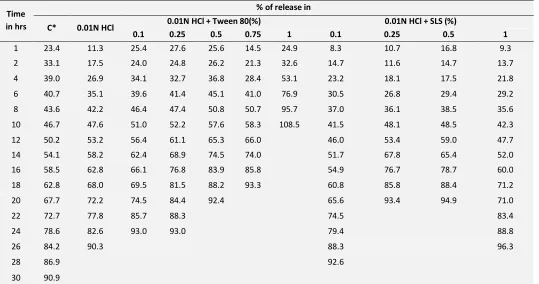
[image:4.612.32.295.69.216.2]Hence, the remaining buffers 0.01N HCl, glycine buffer, acetate buffer and water were found to be suitable media and they fall well the physiological pH range. With these four media dissolution profile was carried out on cephalexin OD tablets 750mg of a single batch (test batch F1). The rate of dissolution profile was also determined with these four media in presence of surfactant. Two surfactants were used namely tween 80 and sodium lauryl sulphate (SLS) at various concentrations. All the results were compared with in house control media. The results are tabulated in Table 3, 4, 5.
TABLE 2: DETERMINATION OF PH DEPENDENT SOLUTION STABILITY
Media Stability (% of degradation)
0.1N HCl 0.07N HCl 0.01N HCl SGF Glycine Buffer Acetate Buffer Water Phosphate buffer SIF Phosphate buffer
pH 1.00 1.25 1.75 2.1 3.0 4.5 5.3 6.8 6.8 7.2
1hr 0 0 0 -- 0 1 0.5 2 -- 2
2hr 0 0 0 0 0 1 1 4.5 3 4
4hr 0 0 0 0 0 1 1 8 9 10
6hr 0 0 0 0 0 1 2 12.5 10 14
8hr 0 0 0 0 0 1 2 15.5 17 17.5
10hr 0 0 0 0 0 2 2 21 25 21
12hr 0 0 0 0 0 2 2 23.5 35 26.5
24 hr 0 0 0 -- 0 6 3.5 38.5 -- 43
TABLE 3: COMPARATIVE DISSOLUTION PROFILING IN SELECTED MEDIA
Time in hrs
% of release in
C* 0.01N HCl 0.01N HCl + Tween 80(%) 0.01N HCl + SLS (%)
0.1 0.25 0.5 0.75 1 0.1 0.25 0.5 1
1 23.4 11.3 25.4 27.6 25.6 14.5 24.9 8.3 10.7 16.8 9.3
2 33.1 17.5 24.0 24.8 26.2 21.3 32.6 14.7 11.6 14.7 13.7
4 39.0 26.9 34.1 32.7 36.8 28.4 53.1 23.2 18.1 17.5 21.8
6 40.7 35.1 39.6 41.4 45.1 41.0 76.9 30.5 26.8 29.4 29.2
8 43.6 42.2 46.4 47.4 50.8 50.7 95.7 37.0 36.1 38.5 35.6
10 46.7 47.6 51.0 52.2 57.6 58.3 108.5 41.5 48.1 48.5 42.3
12 50.2 53.2 56.4 61.1 65.3 66.0 46.0 53.4 59.0 47.7
14 54.1 58.2 62.4 68.9 74.5 74.0 51.7 67.8 65.4 52.0
16 58.5 62.8 66.1 76.8 83.9 85.8 54.9 76.7 78.7 60.0
18 62.8 68.0 69.5 81.5 88.2 93.3 60.8 85.8 88.4 71.2
20 67.7 72.2 74.5 84.4 92.4 65.6 93.4 94.9 71.0
22 72.7 77.8 85.7 88.3 74.5 83.4
24 78.6 82.6 93.0 93.0 79.4 88.8
26 84.2 90.3 88.3 96.3
28 86.9 92.6
30 90.9
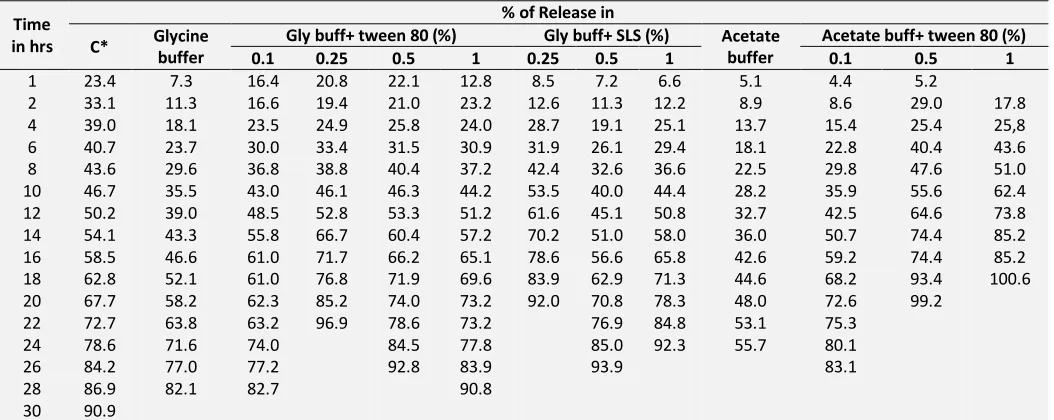
[image:4.612.25.594.254.435.2] [image:4.612.40.579.456.740.2]TABLE 4: COMPARATIVE DISSOLUTION PROFILING IN SELECTED MEDIA
Time in hrs
% of Release in
C* Glycine buffer
Gly buff+ tween 80 (%) Gly buff+ SLS (%) Acetate buffer
Acetate buff+ tween 80 (%)
0.1 0.25 0.5 1 0.25 0.5 1 0.1 0.5 1
1 23.4 7.3 16.4 20.8 22.1 12.8 8.5 7.2 6.6 5.1 4.4 5.2
2 33.1 11.3 16.6 19.4 21.0 23.2 12.6 11.3 12.2 8.9 8.6 29.0 17.8 4 39.0 18.1 23.5 24.9 25.8 24.0 28.7 19.1 25.1 13.7 15.4 25.4 25,8 6 40.7 23.7 30.0 33.4 31.5 30.9 31.9 26.1 29.4 18.1 22.8 40.4 43.6 8 43.6 29.6 36.8 38.8 40.4 37.2 42.4 32.6 36.6 22.5 29.8 47.6 51.0 10 46.7 35.5 43.0 46.1 46.3 44.2 53.5 40.0 44.4 28.2 35.9 55.6 62.4 12 50.2 39.0 48.5 52.8 53.3 51.2 61.6 45.1 50.8 32.7 42.5 64.6 73.8 14 54.1 43.3 55.8 66.7 60.4 57.2 70.2 51.0 58.0 36.0 50.7 74.4 85.2 16 58.5 46.6 61.0 71.7 66.2 65.1 78.6 56.6 65.8 42.6 59.2 74.4 85.2 18 62.8 52.1 61.0 76.8 71.9 69.6 83.9 62.9 71.3 44.6 68.2 93.4 100.6 20 67.7 58.2 62.3 85.2 74.0 73.2 92.0 70.8 78.3 48.0 72.6 99.2
22 72.7 63.8 63.2 96.9 78.6 73.2 76.9 84.8 53.1 75.3
24 78.6 71.6 74.0 84.5 77.8 85.0 92.3 55.7 80.1
26 84.2 77.0 77.2 92.8 83.9 93.9 83.1
28 86.9 82.1 82.7 90.8
30 90.9
[image:5.612.100.514.301.515.2]*Control with 0.1N HCl for 1 or 2 hrs then with pH 6.8 Phosphate Buffer with media replacement for every two hrs
TABLE 5: COMPARATIVE DISSOLUTION PROFILING IN SELECTED MEDIA
Time ‘hr
% of release in
C* water Water + tween 80(%) Water + SLS (%)
0.1 1 0.25 0.5
1 23.4 20.1 13.2 18.9 7.5 6.1
2 33.1 34.6 31.3 33.1 15.4 14.3
4 39.0 63.9 57.3 60.6 36.6 33.3
6 40.7 82.3 77.6 85.3 43.9 40.2
8 43.6 100.3 92.1 100.9 57.0 53.4
10 46.7 109.6 70.2 65.7
12 50.2 79.0 76.7
14 54.1 87.0 88.1
16 58.5 93.1 95.8
18 62.8
20 67.7
22 72.7
24 78.6
26 84.2
28 86.9
30 90.9
*Control with 0.1N HCl for 1 or 2 hrs then with pH 6.8 Phosphate Buffer with media replacement for every two hrs The release in control was achieved at 30hrs. The
release of 0.01N HCl, glycine buffer pH 3.0 and acetate buffer (pH 4.5) is almost the same as that of the control. So they were rejected. Also 0.01N HCl with 0.1%, 0.25%, 0.5% of Tween 80, 0.01N HCl with 0.1%, 0.25%, 1% of SLS gave almost similar results with that of the control. Similarly glycine buffer with both surfactants at all concentrations has not yielded a good discriminative release with that of the control. Also acetate buffer with 0.1%, 0.5% of tween 80 and water with 0.25% of SLS has given the similar result. Hence the media were rejected.
On the other hand 0.01N HCl with 1% tween 80, water, water with 0.1%, 1% of tween 80 and water with 0.25% of SLS gave fast release for which the chance of
being discriminative media is less and makes in-vivo –
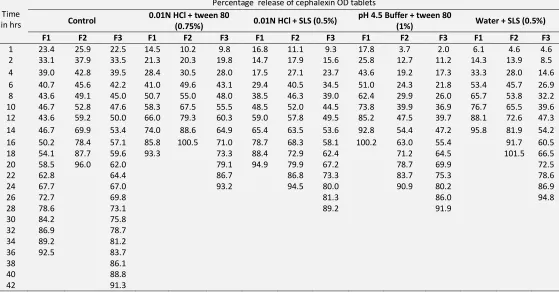
Similarly in acetate buffer with 1% tween 80 shows release profile is extended for F2 in spite of lesser polymer ratio, where as in water with 0.5% SLS there is no discrimination between F1 and F2. Hence all the three media i.e., 0.01N HCl with 0.5%SLS, acetate buffer with 1% tween 80 and water with 0.5% SLS are
[image:6.612.29.588.157.449.2]rejected. The remaining 0.01N HCl with 0.75% tween 80 shows a retarded release profile for F2 (lesser polymer ratio) and extended released profile (higher polymer ratio) for F3 than that of the test batch F1. Hence, this media 0.0N HCl with tween 80 is the discriminative media.
TABLE 6: DISCRIMINATIVE MEDIA EVALUATION WITH DIFFERENT FORMULATION WITH VARYING POLYMER CONCENTRATION
Time in hrs
Percentage release of cephalexin OD tablets
Control 0.01N HCl + tween 80
(0.75%) 0.01N HCl + SLS (0.5%)
pH 4.5 Buffer + tween 80
(1%) Water + SLS (0.5%)
F1 F2 F3 F1 F2 F3 F1 F2 F3 F1 F2 F3 F1 F2 F3
1 23.4 25.9 22.5 14.5 10.2 9.8 16.8 11.1 9.3 17.8 3.7 2.0 6.1 4.6 4.6 2 33.1 37.9 33.5 21.3 20.3 19.8 14.7 17.9 15.6 25.8 12.7 11.2 14.3 13.9 8.5 4 39.0 42.8 39.5 28.4 30.5 28.0 17.5 27.1 23.7 43.6 19.2 17.3 33.3 28.0 14.6 6 40.7 45.6 42.2 41.0 49.6 43.1 29.4 40.5 34.5 51.0 24.3 21.8 53.4 45.7 26.9 8 43.6 49.1 45.0 50.7 55.0 48.0 38.5 46.3 39.0 62.4 29.9 26.0 65.7 53.8 32.2 10 46.7 52.8 47.6 58.3 67.5 55.5 48.5 52.0 44.5 73.8 39.9 36.9 76.7 65.5 39.6 12 43.6 59.2 50.0 66.0 79.3 60.3 59.0 57.8 49.5 85.2 47.5 39.7 88.1 72.6 47.3 14 46.7 69.9 53.4 74.0 88.6 64.9 65.4 63.5 53.6 92.8 54.4 47.2 95.8 81.9 54.2 16 50.2 78.4 57.1 85.8 100.5 71.0 78.7 68.3 58.1 100.2 63.0 55.4 91.7 60.5
18 54.1 87.7 59.6 93.3 73.3 88.4 72.9 62.4 71.2 64.5 101.5 66.5
20 58.5 96.0 62.0 79.1 94.9 79.9 67.2 78.7 69.9 72.5
22 62.8 64.4 86.7 86.8 73.3 83.7 75.3 78.6
24 67.7 67.0 93.2 94.5 80.0 90.9 80.2 86.9
26 72.7 69.8 81.3 86.0 94.8
28 78.6 73.1 89.2 91.9
30 84.2 75.8
32 86.9 78.7
34 89.2 81.2
36 92.5 83.7
38 86.1
40 88.8
42 91.3
The discriminatory dissolution method developed by considering media as an important factor for cephalexin OD tablets was validated for its specificity, precision, stability, linearity and accuracy. The placebo has not given a peak or absorbance at 260nm. Moreover the sample, standard and the placebo spiked with the standard gave λmax of 260nm. Hence, this method is specific to cephalexin. The system precision was determined and was found to be good with %RSD of 0.380. The method precision was also good with percentage relative standard deviation of 0.852% and it fell well with the acceptance criteria. The results are given in table 7.
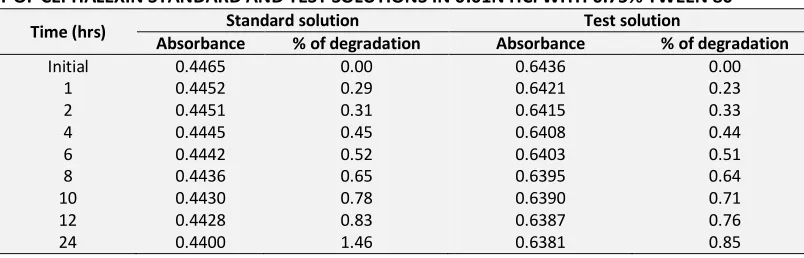
The cephalexin standard and sample solution in the developed media was found to be stable for about 24 hrs. The results are given in table 8. The cephalexin standard solution in the discriminative media was found to be linear over a concentration range of 1to 100 RPM.
The slope if the linear line is 0.0184, Y intercept is 0.0033, which shows that line passes through the origin and the regression coefficient is 0.9998 which falls well with in the acceptance criterion. The results were given in table 9. The range of the method was found good between lower (5µg/ml) with % RSD of 0.95 and higher concentration (425µg/ml) with %RSD of 0.33. These results were given in table 10.
TABLE 7: SYSTEM PRECISION AND METHOD PRECISION OF CEPHALEXIN IN 0.01N HCl WITH 0.75% TWEEN 80
S. No System Precision Method precision Absorbance
1 0.4438 93.3
2 0.4403 93.1
3 0.4429 92.6
4 0.4450 92.9
5 0.4414 94.4
6 0.4423 94.5
Average 0.4426 93.47
[image:6.612.320.581.614.728.2]TABLE 8: STABILITY OF CEPHALEXIN STANDARD AND TEST SOLUTIONS IN 0.01N HCl WITH 0.75% TWEEN 80
Time (hrs) Standard solution Test solution
Absorbance % of degradation Absorbance % of degradation
Initial 0.4465 0.00 0.6436 0.00
1 0.4452 0.29 0.6421 0.23
2 0.4451 0.31 0.6415 0.33
4 0.4445 0.45 0.6408 0.44
6 0.4442 0.52 0.6403 0.51
8 0.4436 0.65 0.6395 0.64
10 0.4430 0.78 0.6390 0.71
12 0.4428 0.83 0.6387 0.76
24 0.4400 1.46 0.6381 0.85
TABLE 9: LINEARITY OF CEPHALEXIN IN 0.01N HCl WITH 0.75% TWEEN 80
Concentration in ppm Absorbance
0 0.0000
1 0.0224
5 0.0957
10 0.1892
20 0.3773
30 0.5422
40 0.7450
50 0.9343
60 1.0912
70 1.2800
80 1.4748
100 1.8445
slope 0.0184
Y- Intercept 0.0033
Regression coefficient 0.9998
TABLE 10: SYSTEM PRECISION AT LOWER AND HIGHER CONCENTRATION OF CEPHALEXIN IN 0.01N HCl WITH 0.75% TWEEN 80
S. No Absorbance at lower concentration (5µg/ml)
Absorbance at higher concentration (42µg/ml)
1 0.0985 0.7523
2 0.0972 0.7595
3 0.0974 0.7582
4 0.0993 0.7553
5 0.0986 0.7568
6 0.0970 0.7539
Average 0.0980 0.7560
%RSD 0.95 0.33
TABLE 11: ACCURACY OF THE METHOD
Recovery level Cephalexin in mg( in 0.01N HCl with 0.75% tween 80)
Added recovered % recovery mean %RSD
80%-1 600.19 595.47 99.21
99.36 0.19
80%-2 599.79 595.16 99.23
80%-3 599.87 597.62 99.62
100%-1 749.68 742.52 99.04
99.30 0.28
100%-2 749.15 746.82 99.69
100%-3 749.84 743.65 99.17
120%-1 900.00 902.37 100.26
100.60 0.24
120%-2 899.50 906.88 100.82
120%-3 899.91 906.26 100.71
CONCLUSION: With apparatus I (basket type ) RPM 100, dissolution medium volume 900ml, only 0.01N HCl with 0.75% tween 80 as dissolution medium was found to show good discrimination in the release profile with change in the formulation condition ie retardation in profile with decrease in polymer ration and extension in profile with increase in polymer ratio. Thus, a discriminative dissolution method was developed for cephalexin OD tablets 750mg with 0.01N HCl with 0.75% tween 80 as the discriminative media. This method was validated for its specificity, accuracy, stability, linearity and precision and it passes all the parameters.
REFERENCES:
1. Wagner. J.G, Clin.Pharm, Drug Intelligence Publications, 1970; 4:32.
2. Merck Index., 13th edition, 1996;1986
3. Sunil B.Jaiswal and Brahmankar .D.M, Biopharmaceutics and Pharmacokinetics, A treatise, M.K. Jain for Vallabh Prakashan, Delhi, 2000; 40-44.
4. United States Pharmacopoeia 25th edition, 2002; 711.
5. Shah et al, “Invitro Dissolution of sparingly water soluble drug dosage forms”, International Journal of Pharmaceutics, 1995;125:99-106.
6. Shah etal.”Influence of Higher rate of Agitation on release patterns of Immediate release drug products”, Journal of Pharmaceutical Sciences, 1992; 81:500-503.